背景
ラズパイにMESHハブ入れたから使いたい。
Googleスプレッドシートでもいいけど、どうせならそれっぽいサービスでグラフ表示したい。
ThingSpeakを使えるようになったので、色々グラフにしたい。
室温はNature Remoで温度モニターできるので、別の場所はかりたい。
冷蔵庫の開け閉めでどれくらい温度変わるか興味あった。
MESHタグ使わないともったいないので、使いたい。
使ったもの
結構高い。
やったことあったこと
MESH SDKとThingSpeakは使ったことあった。
なので、まあ、つなぐだけ。
- MESH SDK
MESH動きタグとtogglで時間管理 - Qiita - ThingSpeak
ThingSpeakに登録してcurlでデータを送ってグラフを表示するまで - Qiita
MESH SDK
こんな感じで入力してく。
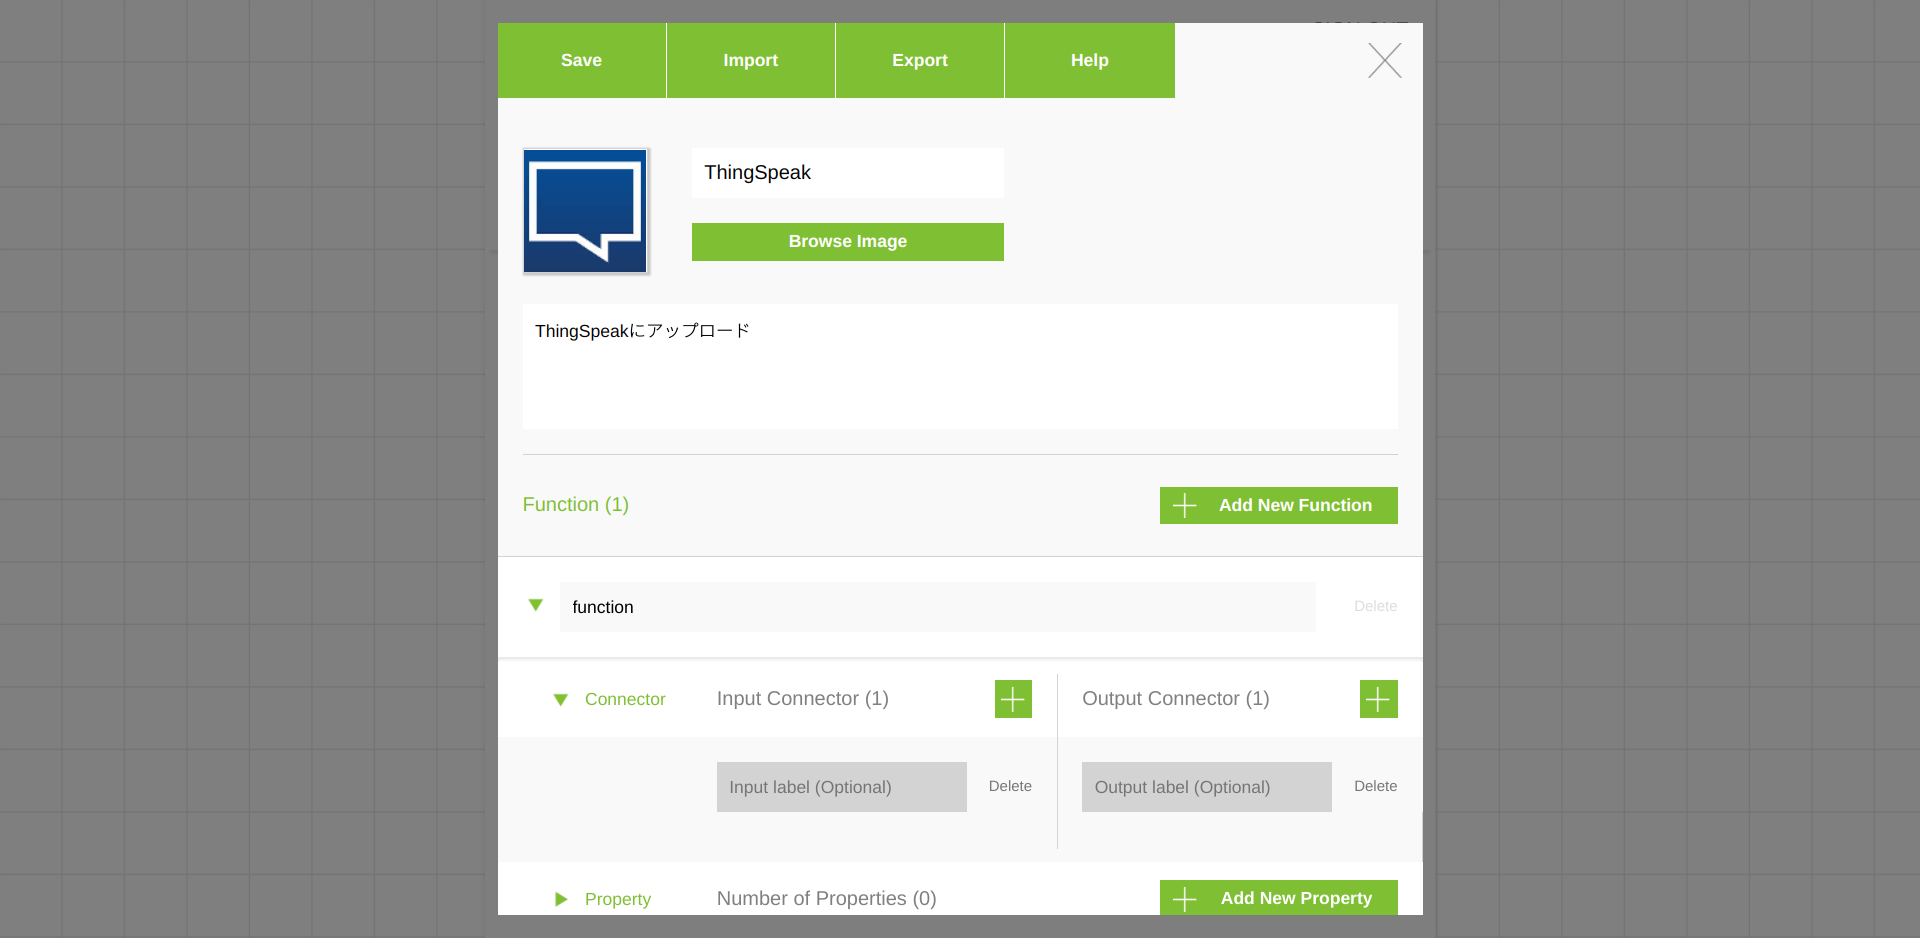
コードはこんな感じ↓
デバッグ手段が、最後実行してログみるだけ。実行前はシンタックスエラーも検出してくれないので、せめて、かしこいエディタで確認してコピペしたほうがいいと思う。
変更なし↓
//Initialize "outputIndex"
return {
    runtimeValues : {
        outputIndex : 0
    },
    resultType : "continue"
};
変更なし↓
/*** No Receive Codes ***/
xxxに自分のAPI Keyを入れる。
fieldの数字は、ThingSpeakのChannelの自分の使いたいやつを入れる。
今回は、温度と湿度をそれぞれfield6, field7に入れた。
認証がないから、シンプル。
ajax
({
	type: "GET",
	url : "https://api.thingspeak.com/update?api_key=xxx&field6=" + messageValues.temperatureValue + "&field7=" + messageValues.humidityValue,
	timeout : 5000,
	success: function (){
		log(messageValues.temperatureValue);
		log("GET success");
			callbackSuccess( {
			resultType : "continue",
		} );
	},
	error : function ( request, errorMessage ) {
		log("Network error");
		callbackSuccess( {
			resultType : "continue",
		} );
	}
});

return {
	resultType : "pause"
};
変更なし↓
//Select an output connector depending on the "outputIndex" value updated in "Execute"
return {
    indexes : [ runtimeValues.outputIndex ],
    resultType : "continue"
};
MESH アプリ
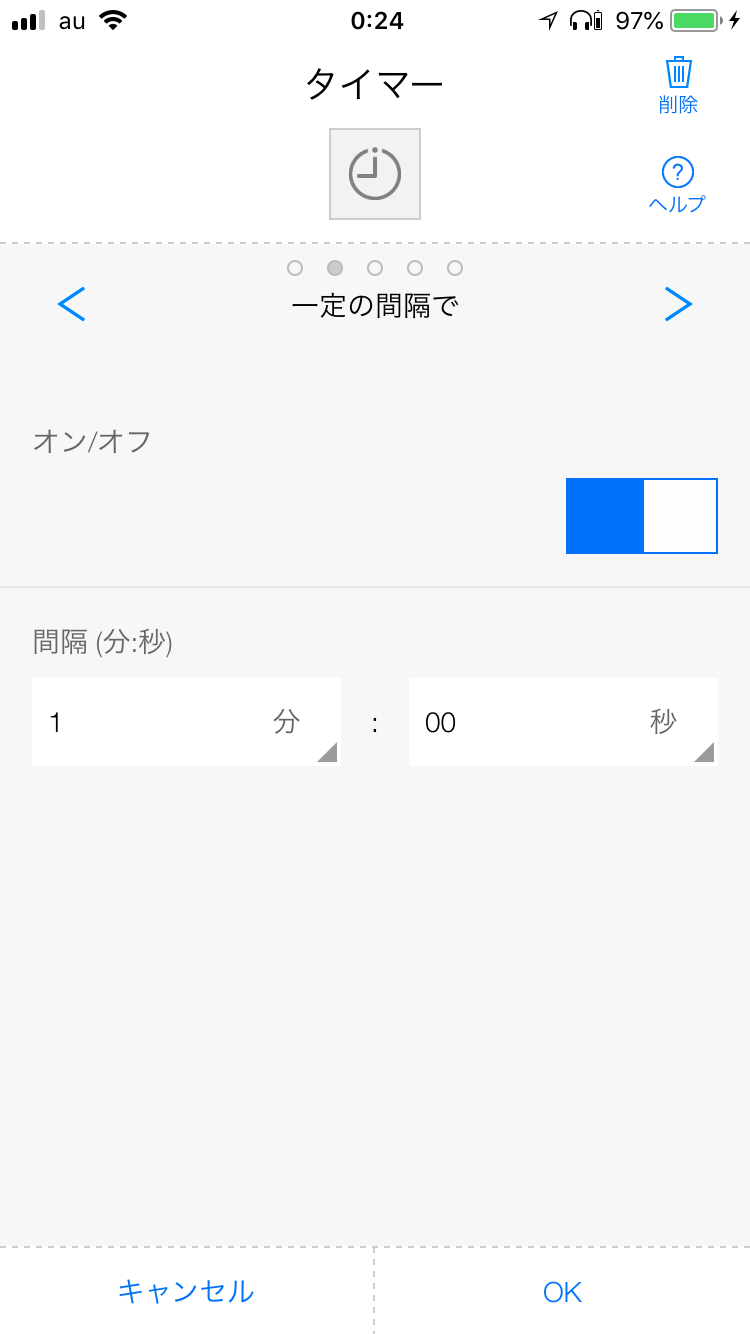
こんな感じでつなぐ。一定周期でログとる。
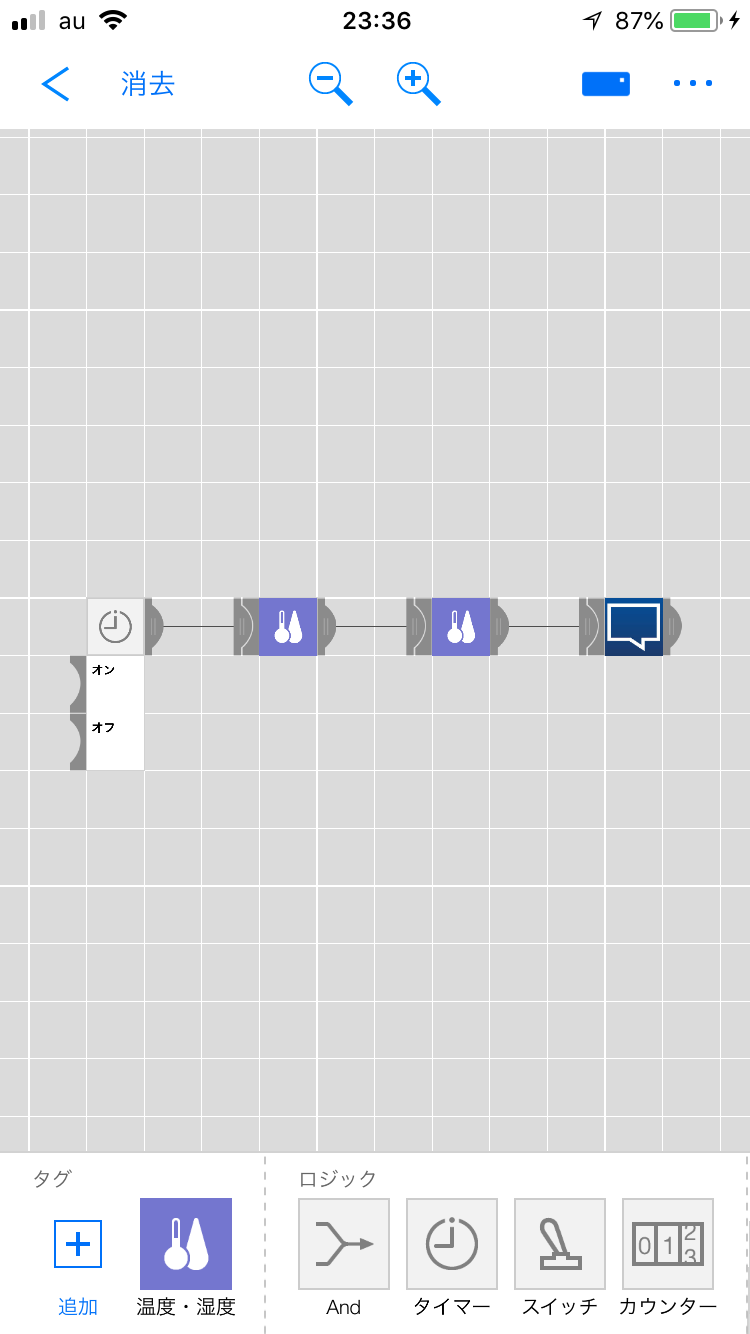
タイマー
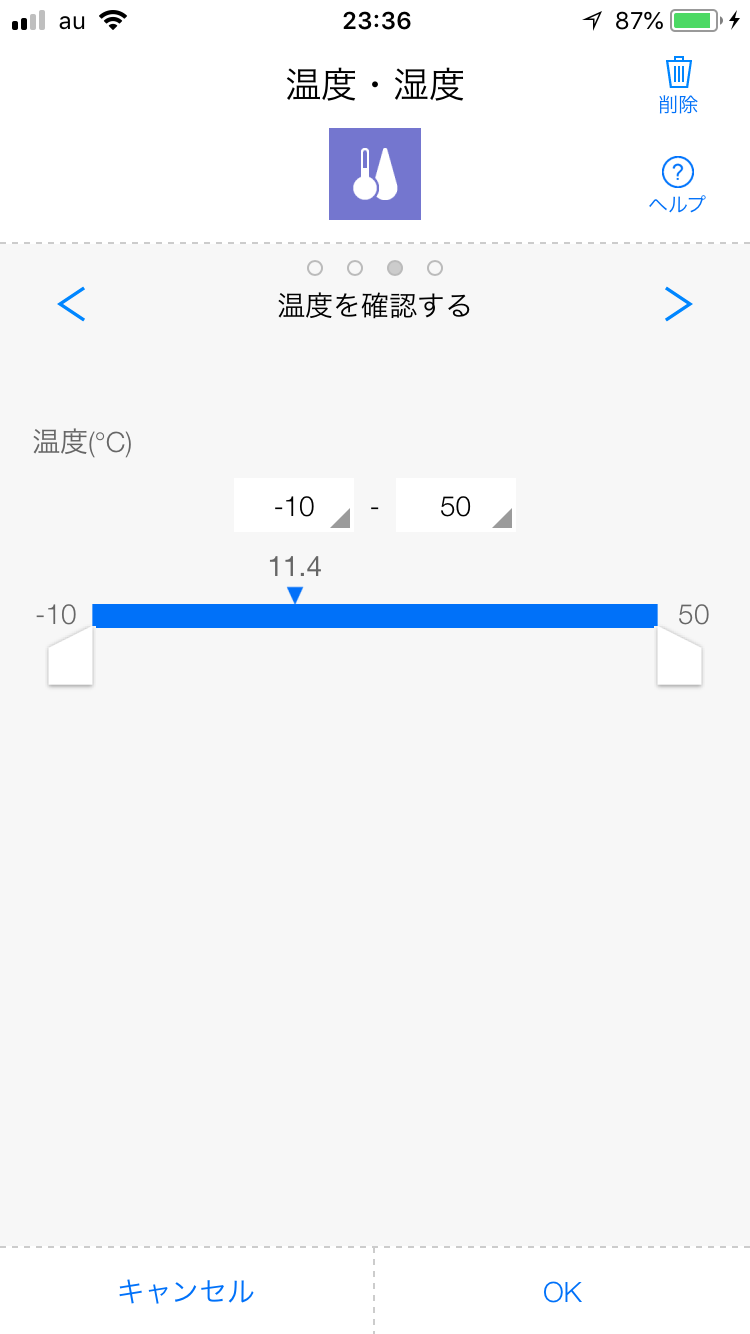
温度
湿度
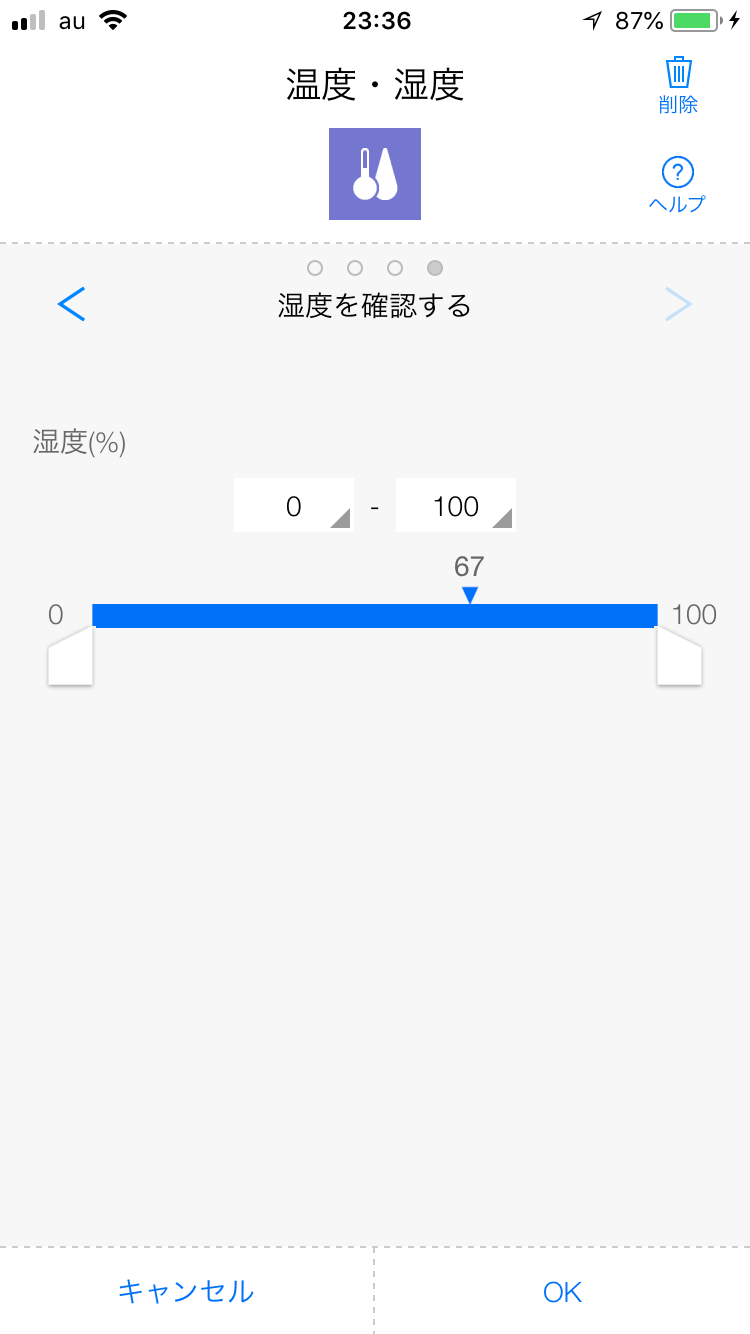
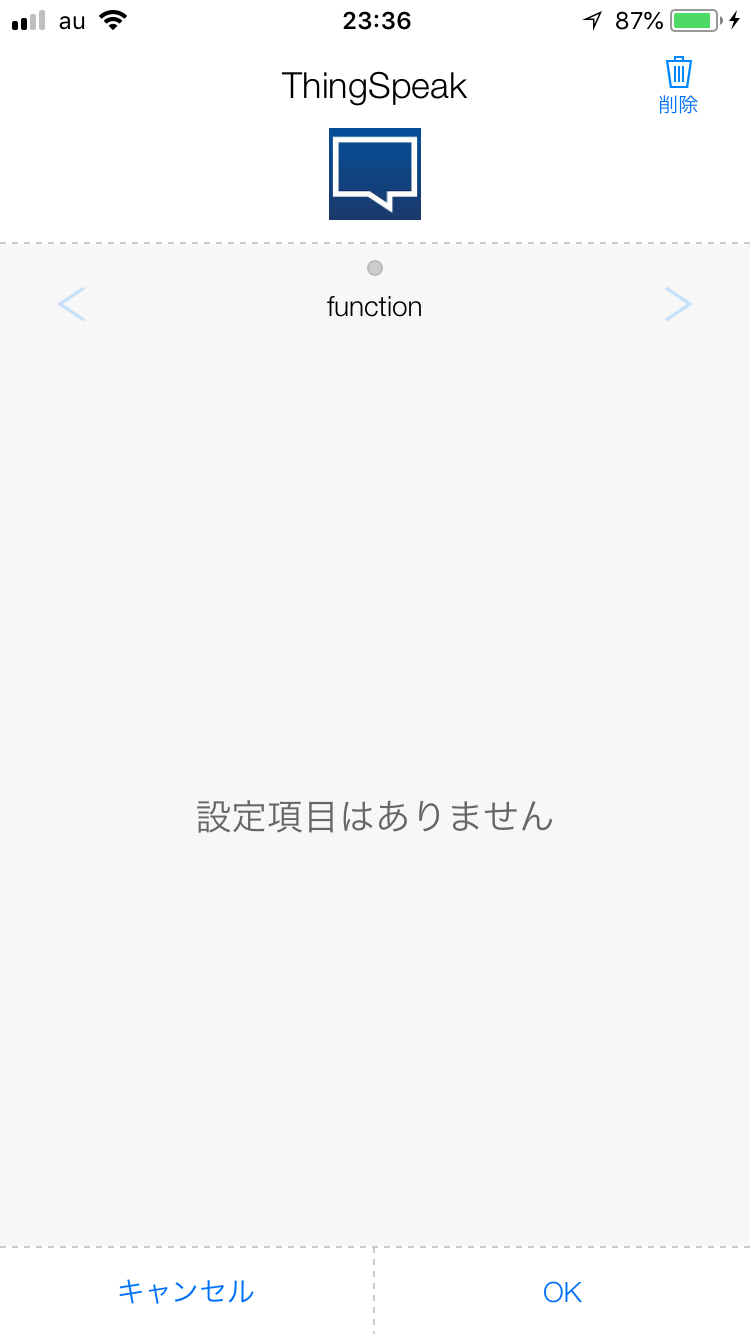
設定項目(ない)
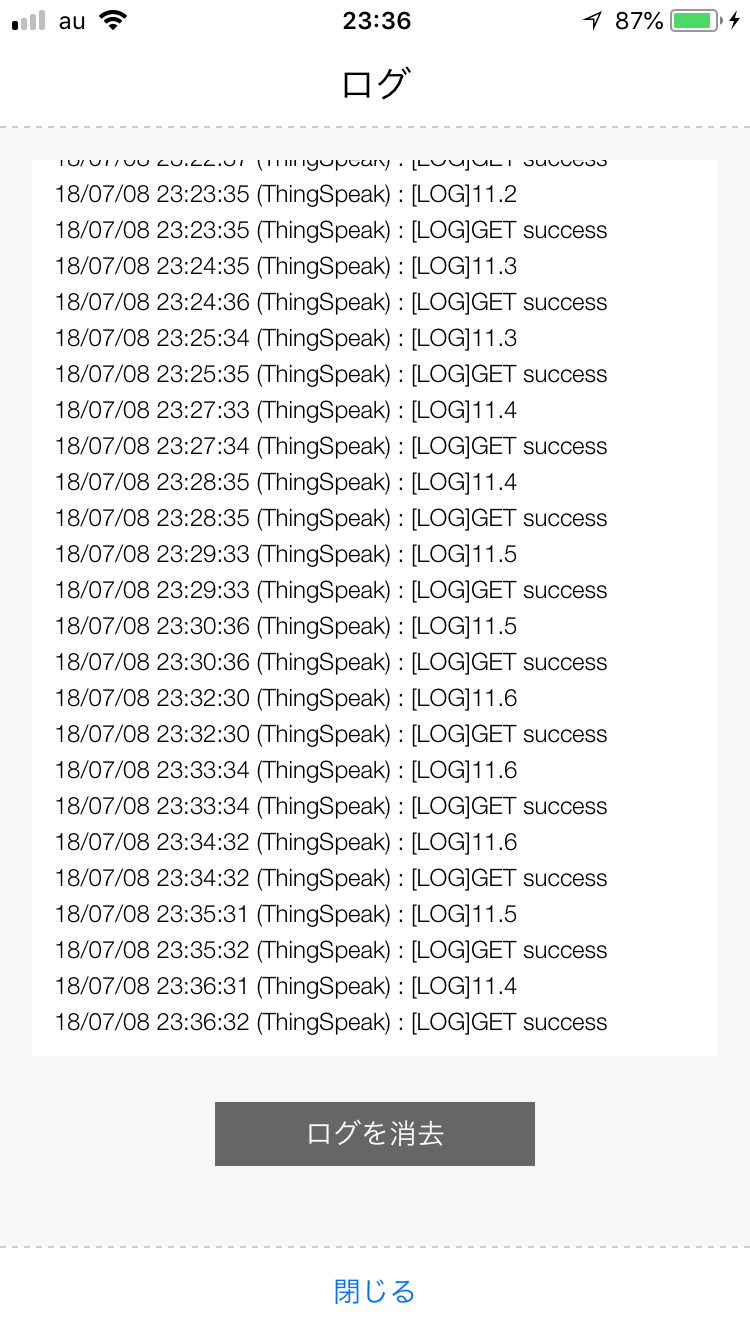
ログ
ThingSpeak
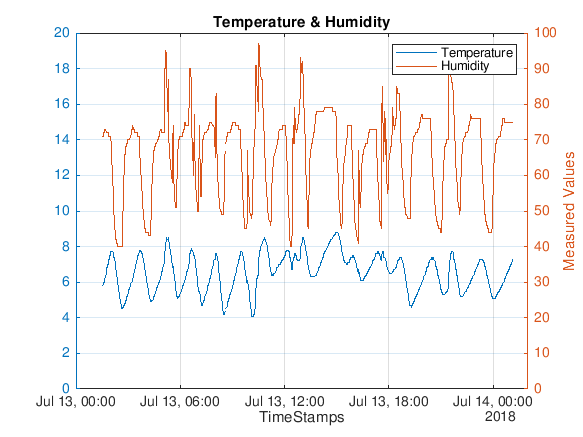
1日分のデータを表示してみる。
二種類のデータを表示したいので、yyaxisを使う。
2 つの y 軸があるチャートの作成 - MATLAB & Simulink - MathWorks 日本
readChId = xxx;
readKey = 'yyy';

[temps,time] = thingSpeakRead(readChId,'fields',[6,7],'NumDays',1,'ReadKey',readKey);
yyaxis left;
plot(time, temps(:,1));
ylim([0,20]);

yyaxis right;
plot(time, temps(:,2));
ylim([0,100]);

title('Temperature & Humidity');
xlabel('TimeStamps');
ylabel('Measured Values');
legend({'Temperature','Humidity'});
grid on;
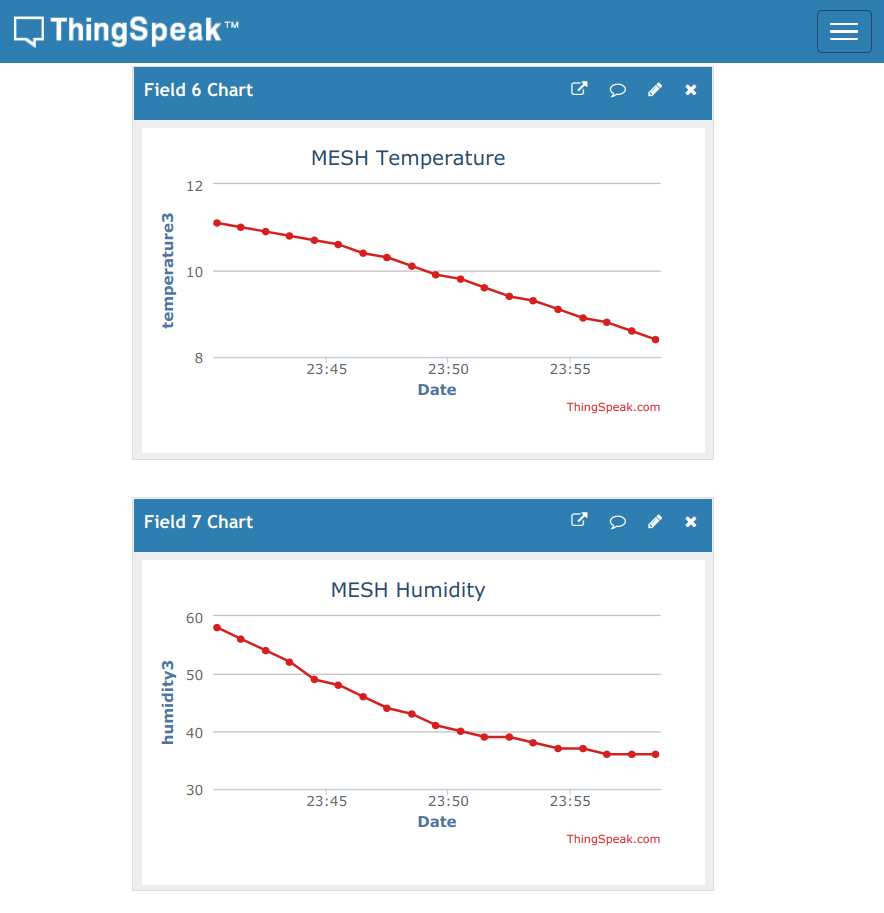
結果
それっぽいグラフになった。
ドアポケットの卵の横においたけど、おもったより温度高い。
1日の変動を確認してみた。
開け閉めすると、+2度くらい温度上昇して、湿度も上がる。面白いなぁ。
冷蔵庫ってオンオフ制御なのか。
参考
カスタムブロックでMESHブロックが検知したデータを取得する方法を教えてください – MESHサポート | 遊び心を形にできる、アプリとつなげるブロック形状の電子タグ