構成
-
オンプレ側
テスト用サーバ2台とCiscoスイッチを用意。各機器のログはSyslogサーバに転送する。
SyslogサーバのログをLogstashでETL処理しElasticsearchに保存する。
最後にKibanaで各種設定やグラフ作成をする。 -
AWS側
CloudTrail、VPC FlowlogsをCloudwatchに送信する。
LogstashからCloudwatchのロググループを指定してログを取りに行く。
Kibanaで各種設定やグラフを作成する。

完了後
-
SyslogをKibanaで表示・検索

-
ログファイル別、ログメッセージ別、時間帯別、プログラム別のグラフを作成

環境・前提条件
- AlmaLinux release 8.5 (Arctic Sphynx)
- 下記の設定は設定済み
- CloudTrail,VPCFlowlogs,CloudWatchの設定
- LogstashからCloudWatchにアクセスするIAMユーザの作成及びIAMロールの設定
参考
- Logstashのfilter箇所の記載方法(CloudTrail、VPCFlowlogs)は下記サイトを参考にさせて頂きました。
VPC FlowLogsをLogstashで正規化してみた
CloudTrailをElasticsearchに取り込んでみた
構築手順(オンプレミス側のログ取込み)
Elasticsearchサーバ構築
- Elasticsearchインストール
wget https://artifacts.elastic.co/downloads/elasticsearch/elasticsearch-7.10.1-x86_64.rpm
rpm --install elasticsearch-7.10.1-x86_64.rpm
- Elasticsearch設定
/etc/elasticsearch/elasticsearch.yml
vim elasticsearch.yml
network.host: 0.0.0.0
node.name: node-1
cluster.initial_master_nodes: ["node-1"]
- vm.max_map_countパラメータ設定
/etc/sysctl.conf
vm.max_map_count=262144
sysctl -q -w  vm.max_map_count=262144
systemctl enable elasticsearch
systemctl start elasticsearch
Kibanaも同じサーバにインストールしておく
- Kibanaインストール
wget https://artifacts.elastic.co/downloads/kibana/kibana-7.10.1-x86_64.rpm
rpm --install kibana-7.10.1-x86_64.rpm
- Kibana設定
/etc/kibana/kibana.yml
server.host: "0.0.0.0"
- Kibana起動
systemctl enable kibana
systemctl start kibana
- Kibana動作確認
http://xx.xx.xx.xx:5601/にアクセス
Logstashサーバ構築
- OpenJDKのインストール
yum -y install java-1.8.0-openjdk
- Logstashインストール
rpm --import https://artifacts.elastic.co/GPG-KEY-elasticsearch
/etc/yum.repos.d/logstash.repo
[logstash-7.x]
name=Elastic repository for 7.x packages
baseurl=https://artifacts.elastic.co/packages/7.x/yum
gpgcheck=1
gpgkey=https://artifacts.elastic.co/GPG-KEY-elasticsearch
enabled=1
autorefresh=1
type=rpm-md
yum -y install logstash-7.10.1
- Logstash起動
systemctl enable logstash
systemctl restart logstash
Syslogサーバ構築
- Syslog設定
IPアドレスでログファイルを分ける設定
/etc/rsyslog.conf
module(load="imudp") # needs to be done just once
input(type="imudp" port="514")

module(load="imtcp") # needs to be done just once
input(type="imtcp" port="514")

#### RULES ####
:fromhost-ip, isequal, "xxx.xxx.xxx.xxx" -/var/log/server/pst.log
& ~
:fromhost-ip, isequal, "xxx.xxx.xxx.xxx" -/var/log/server/redmine.log
& ~
:fromhost-ip, isequal, "xxx.xxx.xxx.xxx" -/var/log/server/ciscosw.log
& ~
/etc/logrotate.d/server
/var/log/server/*.log {
weekly
rotate 54
compress
create 0664 root root
postrotate
/bin/systemctl restart rsyslog
endscript
}
systemctl restart rsyslog
Syslog転送側設定
- サーバ設定
/etc/rsyslog.conf
*.* @@xxx.xxx.xxx.xxx:514
systemctl restart rsyslog
- スイッチ設定
テストのためレベルをdebuggingで設定
logging host xxx.xxx.xxx.xxx
logging trap debugging
NFS設定
LogstashサーバからSyslogサーバを見えるようにする
- Syslogサーバ側設定
yum -y install nfs-utils
systemctl enable nfs-server
systemctl start nfs-server
/etc/exports
/var/log xxx.xxx.xxx.xxx/xx(rw,no_root_squash)
- Logstashサーバ側設定
yum -y install nfs-utils
systemctl enable nfs-server
systemctl start nfs-server
mount -t nfs xxx.xxx.xxx.xxx:/var/log /mnt
/etc/fstab
xxx.xxx.xxx.xxx:/var/log /mnt nfs defaults 0 0
Logstash設定
- Confファイル作成
/etc/logstash/conf.d/syslog.conf
input {
     file {
        path => "/mnt/server/redmine.log"
        path => "/mnt/server/pst.log"
        path => "/mnt/server/ciscosw.log"
        start_position => "beginning"
     }
}
filter {
    grok {
      match => {
        "message" => "%{SYSLOGBASE}%{SPACE}%{GREEDYDATA:SYSLOGMESSAGE}"
      }
    }
}
output {
     elasticsearch {
         hosts => ["xxx.xxx.xxx.xxx:9200"]
         index => "syslog-%{+YYYY-MM-dd}"
     }
}
- Logstash再起動
systemctl restart logstash
Kibana設定
- Develper Toolの画面にアクセス
http://xx.xx.xx.xx:5601/app/dev_tools#/console
- Indexが登録されているか確認
GET /_cat/indices?v

health status index                           uuid                   pri rep docs.count docs.deleted store.size pri.store.size
yellow open   syslog-2022-02-21               KfyhDKVjRwGGVk2TWuGD1A   1   1        407            0    145.2kb        145.2kb
yellow open   syslog-2022-02-22               lmZFW50vTveDW2wriHFW_w   1   1        381
- Document情報確認
GET /syslog-2022-02-* /_search
{
  "query": { "match_all": {} }
}
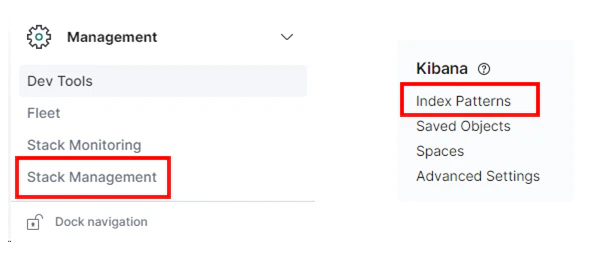
- Index Patterns登録
Stack Management⇒Index Patternsの順に選択
Syslog-*と入力後、Next stepをクリック
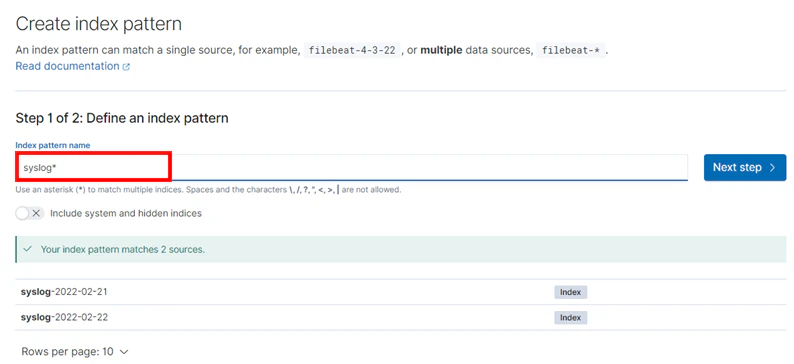
timestampを選択後、Create index patternをクリック

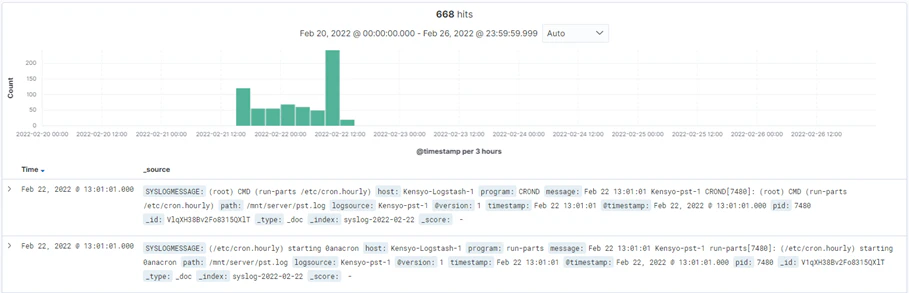
- Syslog確認
Discoverをクリック
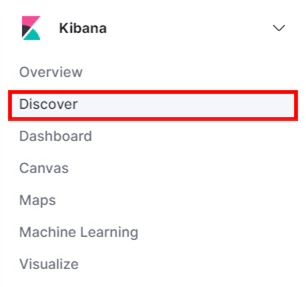
Syslogの内容が表示されることを確認
- グラフ作成
Visualizeを選択後、好きなグラフを作成

構築手順(AWS側のログ取込み)
Logstash設定
- CloudWatchプラグインのインストール
/usr/share/logstash/bin/logstash-plugin install logstash-input-cloudwatch_logs
- Flowlogsのgrokパターン作成
/etc/logstash/patterns/vpcflowlogs_patterns
VPCFLOWLOG %{NUMBER:version} %{NOTSPACE:account-id} %{NOTSPACE:interface-id} %{IP:srcaddr} %{IP:dstaddr} %{NOTSPACE:srcport} %{NOTSPACE:dstport} %{NOTSPACE:protocol} %{NUMBER:packets:float} %{NUMBER:bytes:float} %{NOTSPACE:start} %{NOTSPACE:end} %{NOTSPACE:action} %{NOTSPACE:log-status}
- Confファイル作成(VPC Flowlogs)
/etc/logstash/conf.d/vpcflowlogs.conf
input {
  cloudwatch_logs {
    region => "ap-northeast-1"
    log_group => [ "vpcflowlogs" ]
    access_key_id => "xxxxxxxxx"
    secret_access_key => "xxxxxxxxx"  }
}
filter {
    grok {
      patterns_dir => [ "/etc/logstash/patterns/vpcflowlogs_patterns" ]
      match => { "message" => "%{VPCFLOWLOG}"}
    }
    date {
      match => [ "start","UNIX" ]
      target => "@timestamp"
    }
    date {
      match => [ "start","UNIX" ]
      target => "start_time"
    }
    date {
      match => [ "end","UNIX" ]
      target => "end_time"
    }
    geoip {
      source => "srcaddr"
      target => "src_geoip"
      tag_on_failure => "src_geoip_lookup_failure"
    }
    geoip {
      source => "dstaddr"
      target => "dst_geoip"
      tag_on_failure => "dst_geoip_lookup_failure"
    }
    mutate {
      remove_field => [ "start", 'end' ]
    }
}

output {
  elasticsearch {
    hosts => [ "xx.xx.xx.xx:9200" ]
    index => "vpcflowlogs-%{+YYYY-MM-dd}"
  }
}
- Confファイル作成(CloudTrail)
/etc/logstash/conf.d/cloudtrail.conf
input {
  cloudwatch_logs {
    region => "ap-northeast-1"
    log_group => [ "ClouTrail-LogGroup" ]
    access_key_id => "xxxxxxxxx"
    secret_access_key => "xxxxxxxxx"
    sincedb_path => "/var/lib/logstash/sincedb_cloudtrail"
  }
}

filter {
  json {
    source => "message"
  }
  date {
    match => [ "eventTime", "ISO8601" ]
    target => "@timestamp"
  }
  ruby {
    code => "event.set('[@metadata][local_time]',event.get('[@timestamp]').time.localtime.strftime('%Y-%m-%d'))"
  }
  useragent {
    source => "userAgent"
    target => "useragent"
  }
  geoip {
    source => "sourceIPAddress"
  }
  mutate {
    remove_field => [ "message" ]
  }
}

output {
  elasticsearch {
    hosts => [ "xx.xx.xx.xx:9200" ]
    index => "cloudtrail-%{+YYYY-MM-dd}"
  }
}
- Pipelineファイル設定
複数confファイルを読み込ませる際の設定
/etc/logstash/pipelines.yml
#- pipeline.id: main
#  path.config: "/etc/logstash/conf.d/*.conf"

- pipeline.id: syslog
  pipeline.batch.size: 125
  path.config: "/etc/logstash/conf.d/syslog.conf"
  pipeline.workers: 1
- pipeline.id: vpcflowlogs
  pipeline.batch.size: 125
  path.config: "/etc/logstash/conf.d/vpcflowlogs.conf"
  pipeline.workers: 1
- pipeline.id: cloudtrail
  pipeline.batch.size: 125
  path.config: "/etc/logstash/conf.d/cloudtrail.conf"
  pipeline.workers: 1
- Logstash再起動
systemctl restart logstash
Kibana設定
設定方法は上記オンプレ環境と同様