【2019/06/10更新】M5 UI.Flow v1.3 で変更になった MicroPython に合わせて対応
- wifisetup → wifiCfg
- rtc.ntp_sync → ntptime.py
- ntptime.py については「M5GO(M5Stack)で気温・湿度・気圧・CO2濃度メーター&時計表示」参照
- time.strftime → .format で対応
【2019/02/06更新】動作環境を M5GO Cloud (io.m5go.com Firmware 0.15) から M5 UI.Flow (Firmware v1.0.1-en) への変更に合わせて修正
概要
- M5GO
- M5 UI.Flow (Firmware v1.3.2-en)
- 環境センサー(DHT12、BMP280)
- MicroPythonで記述
- 直近の数時間の計測値を継続的にグラフ表示
- グラフの最小値・最大値を超えたときは、自動調整
実行結果
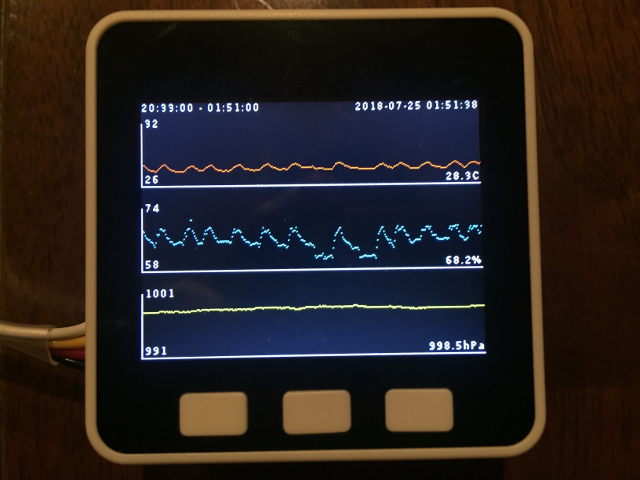
過去319分(5時間19分)の気温・湿度・気圧のグラフです。上のグラフの気温と湿度の波は我が家のエアコンの温度調節の様子です。
プログラム
env_graph.py
from m5stack import lcd
from dht12   import DHT12
from bmp280  import BMP280
import i2c_bus
import machine
import time
import gc


# グラフの表示間隔(秒)
graph_interval = 60


class Graph:
    def __init__(self, x, y, w, h, v_range, color, value_format):
        y_gap = 20
        self.x = x # グラフの表示領域位置
        self.y = y # グラフの表示領域位置
        self.w = w # グラフの表示領域幅
        self.h = h # グラフの表示領域高
        self.v_range = v_range           # 初期状態でのグラフ表示範囲
        self.color = color               # グラフ色
        self.value_format = value_format # 値表示フォーマット

        self.graph_x = x + 1         # グラフ表示位置
        self.graph_y = y + y_gap     # グラフ表示位置
        self.graph_w = w - 1         # グラフ表示幅
        self.graph_h = h - y_gap - 1 # グラフ表示高
        self.last_value = None       # 最新値
        self.v_min = None            # グラフ最小値
        self.v_max = None            # グラフ最大値
        self.v_history = []          # 履歴データ用配列
        self.bg_color = lcd.get_bg() # 背景色を取得
        self.i = 0

        # グラフ枠線描画
        lcd.line(x, y + y_gap, x,     y + h - 1)
        lcd.line(x, y + h - 1, x + w, y + h - 1)

    def plot_graph(self):
        # 表示する値がない(初回から値が取得できなかった)場合は何もしない
        if self.last_value is None:
            return

        # 最初の値を表示する際に、その値を基準としてグラフの最大値・最小値を決定する
        if self.v_min is None:
            self.v_min = int(self.last_value) - self.v_range // 2
            self.v_max = int(self.last_value) + self.v_range // 2

        # 履歴データとして追加
        self.v_history.append(self.last_value)

        if self.last_value <= self.v_max and self.last_value >= self.v_min:
            # 最大値・最小値の範囲に収まっている場合はそのまま表示
            if self.i < self.graph_w:
                # グラフがグラフ表示幅に達していなければ、最後に現在値の点をプロット
                y = self.graph_y + self.graph_h - 1 - int((self.last_value - self.v_min) / (self.v_max - self.v_min) * (self.graph_h - 1))
                lcd.pixel(self.graph_x + self.i,
                          y,
                          self.color)
                self.i += 1
            else:
                # グラフがグラフ表示幅に達していれば、
                # グラフの各点を消去・再表示してシフト表示
                for i in range(len(self.v_history) - 1):
                    lcd.pixel(self.graph_x + i,
                              self.graph_y + self.graph_h - 1 - int((self.v_history[i]     - self.v_min) / (self.v_max - self.v_min) * (self.graph_h - 1)),
                              self.bg_color)
                    lcd.pixel(self.graph_x + i,
                              self.graph_y + self.graph_h - 1 - int((self.v_history[i + 1] - self.v_min) / (self.v_max - self.v_min) * (self.graph_h - 1)),
                              self.color)
                self.v_history.pop(0)
        else:
            # 最大値・最小値の範囲外の場合は値に合わせて最大値・最小値を変更
            if self.last_value > self.v_max:
                self.v_max = int(self.last_value + 2)
            if self.last_value < self.v_min:
                self.v_min = int(self.last_value - 2)

            # グラフ部分を消去し、新しい最大値・最小値に合わせてグラフを再表示
            lcd.rect(self.graph_x, self.graph_y, self.graph_w, self.graph_h, self.bg_color, self.bg_color)
            if self.i < self.graph_w:
                self.i += 1
            else:
                self.v_history.pop(0)
            for i in range(len(self.v_history)):
                    lcd.pixel(self.graph_x + i,
                              self.graph_y + self.graph_h - 1 - int((self.v_history[i] - self.v_min) / (self.v_max - self.v_min) * (self.graph_h - 1)),
                              self.color)

        # 表示しているグラフの時間範囲を表示
        fw, fh = lcd.fontSize()
        lcd.print('{}'.format(self.v_max), self.graph_x + 2, self.graph_y - fh // 2)
        lcd.print('{}'.format(self.v_min), self.graph_x + 2, self.graph_y + self.graph_h - 1 - fh)

    def new_value(self, value):
        # 値が取得できなかった場合(I2C bus error等)は前回取得値を再利用
        if value is None:
            value = self.last_value

        # 表示する値がない(初回から値が取得できなかった)場合は何もしない
        if value is None:
            return

        # 右端に取得値を表示
        fw, fh = lcd.fontSize()
        lcd.print(self.value_format.format(value), lcd.RIGHT,
                              self.graph_y + self.graph_h - 1 - fh)
        # 取得値を保存
        self.last_value = value

    def history_len(self):
        # 履歴データ数
        return len(self.v_history)


def env_graph_update():
    while True:
        # 次の秒までの差分(ミリ秒)を求めてスリープ
        time.sleep_ms(1000 - int(time.time() % 1 * 1000))
        ts = int(time.time())
        localtime = time.localtime(ts)
        datetime_str = '{}-{:02d}-{:02d} {:02d}:{:02d}:{:02d}'.format(*localtime[:6])
        time_str = '{:02d}:{:02d}:{:02d}'.format(*localtime[3:6])
        try:
            # DHT12 から湿度を取得
            dht12.measure()
            h = dht12.humidity()

            # BMP280 から気温、気圧を取得
            t, p = bmp280.values
            lcd.print(datetime_str, lcd.RIGHT, 0, lcd.WHITE)
            t_graph.new_value(t)
            h_graph.new_value(h)
            p_graph.new_value(p)
        except Exception as e:
            # 時々I2C bus error が起きる。
            # データを取得できなかった時は時刻を赤字で表示
            print('{}-{:02d}-{:02d} {:02d}:{:02d}:{:02d}'.format(*time.localtime()[:6]), ' Script Name: ', __name__)
            print('Exception: ', e)
            lcd.print(datetime_str, lcd.RIGHT, 0, lcd.RED)
            t_graph.new_value(None)
            h_graph.new_value(None)
            p_graph.new_value(None)

        # グラフ表示間隔で各取得値のグラフを表示
        if ts % graph_interval == 0:
            t_graph.plot_graph()
            h_graph.plot_graph()
            p_graph.plot_graph()
            lcd.print('{} - {}'.format(
                    '{:02d}:{:02d}:{:02d}'.format(*time.localtime(ts - (t_graph.history_len() - 1) * graph_interval)[3:6]),
                    time_str),
                    0, 0)

        gc.collect()


# M5 UI.Flow からの実行ではなく、APP.LIST に登録して実行する場合は、
# プログラム内でネットワーク接続を行う必要がある。
# Connect network
#
# UI.Flow 1.2 以前は以下
# import wifisetup
# wifisetup.auto_connect()
#
# UI.Flow 1.3 以降は以下
import wifiCfg
wifiCfg.autoConnect(lcdShow=True)

# 日本時間に同期
# UI.Flow 1.2 以前は以下
'''
rtc = machine.RTC()
rtc.ntp_sync('ntp.nict.jp', tz='JST-9')

# 同期が完了するまで100ms程度かかる
for i in range(100):
    if rtc.synced():
        print('synced.')
        break
    print(i, end=' ')
    time.sleep_ms(10)
'''
# UI.Flow 1.3 以降は以下
# ntptime は以下のモジュールの改訂版(オフセット指定を追加)
# https://github.com/micropython/micropython/blob/master/ports/esp8266/modules/ntptime.py
import ntptime
ntptime.settime(9*60*60) # +09:00:00 for JST

lcd.setBrightness(255)
lcd.setColor(lcd.WHITE, lcd.BLACK)
lcd.clear()
lcd.font(lcd.FONT_DefaultSmall)

win_w, win_h = lcd.winsize() # (320, 240)

t_graph = Graph(0,  0,              win_w, win_h // 3,  4, lcd.ORANGE, '  {:.1f}C')
h_graph = Graph(0,  win_h // 3,     win_w, win_h // 3,  4, lcd.CYAN,   '  {:.1f}%')
p_graph = Graph(0,  win_h // 3 * 2, win_w, win_h // 3, 10, lcd.YELLOW, '  {:.1f}hPa')

i2c = i2c_bus.get(i2c_bus.M_BUS)
dht12 = DHT12(i2c)
bmp280 = BMP280(i2c)

env_graph_update()
M5GO Cloud利用時の名残り
M5GO Cloudを利用していたときは、以下のようなboot.py/main.py の書き換えを行っていましたが、M5 UI.Flow ではそのような問題も無くなったので、以下のような対応は不要です。
boot.py/main.py 書き換え
今回のプログラムはM5GO Cloudからも実行可能ですが、しばらく動かすと「stack overflow」で止まってしまうことがあります。そのため、boot.py/main.py を書き換えて実行することで、安定動作させています。
boot.py
import sys
sys.path[1] = '/flash/lib'
from m5stack import lcd, buttonA, buttonB, buttonC

# ---------- M5Cloud ------------
if buttonB.isPressed():
    lcd.println('On: OFF-LINE Mode', color=lcd.ORANGE)
else:
    import wifisetup
Adafruit MicroPython Tool (ampy) を使って、boot.py/boot.py 書き換えます。
$ ampy put boot.py /flash/boot.py
$ ampy put main.py /flash/main.py
書き換え後、再起動すれば boot.py/main.py が実行されます。