はじめに
次世代のPython Notebookとして「Marimo」が登場しており、インタラクティブなUIを作成できるということで試してみました。
UIのサンプル
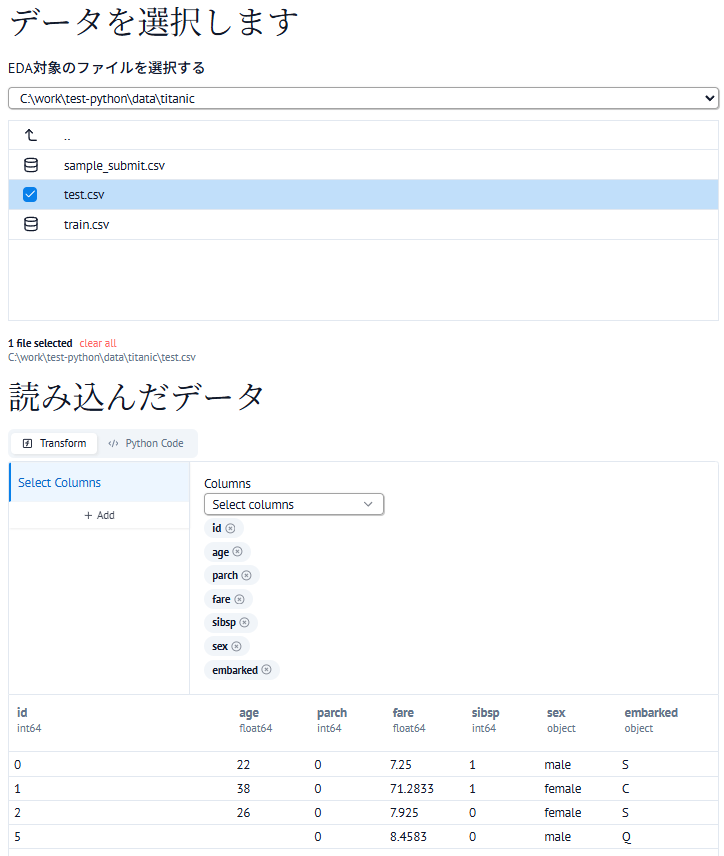
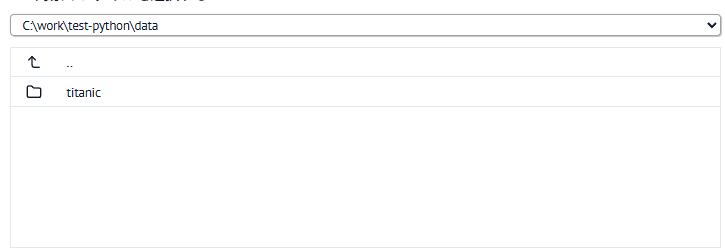
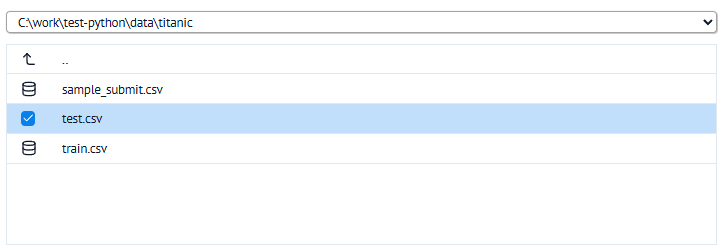
ファイルブラウザ
UI操作でファイルを選択することができます。
file_browser = mo.ui.file_browser(initial_path = "data",label="EDA対象のファイルを選択する",filetypes=[".csv"],multiple = False)
mo.vstack([file_browser])
ファイルブラウザで選択したファイル名を取得して、次の処理に進んだり、
ファイルが選択されていないときは処理を止めることができます。
file_path = file_browser.path()
mo.stop(predicate=not(file_path))
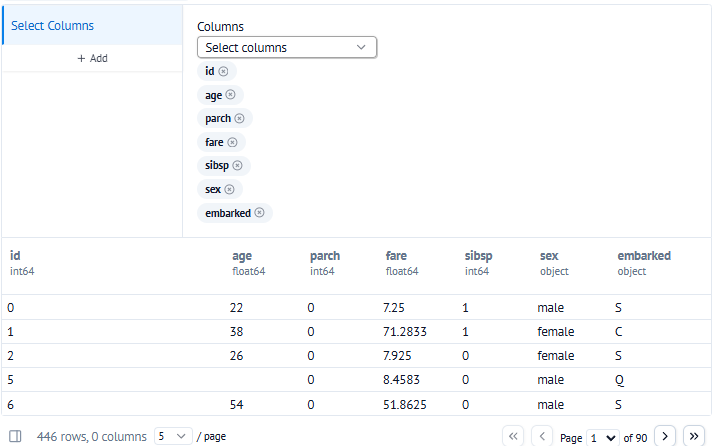
データフレーム
読み込んだデータフレームを表示し、絞り込みなどをかけることができます。
df = pandas.read_csv(file_path)
mo.ui.dataframe(df)
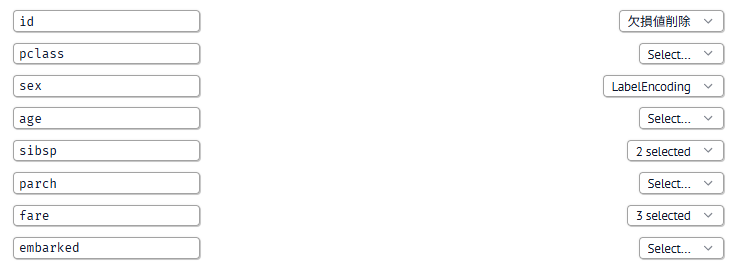
複数選択肢
複数選択の選択肢を表示することができます。
また、UIを水平方向に並べることができます。
cleansings_hstacks = []
for col in columns:
    cleansings_hstacks.append([mo.ui.text(col),mo.ui.multiselect(options=cleansings.keys())])
mo.vstack([mo.hstack(hstack) for hstack in cleansings_hstacks])
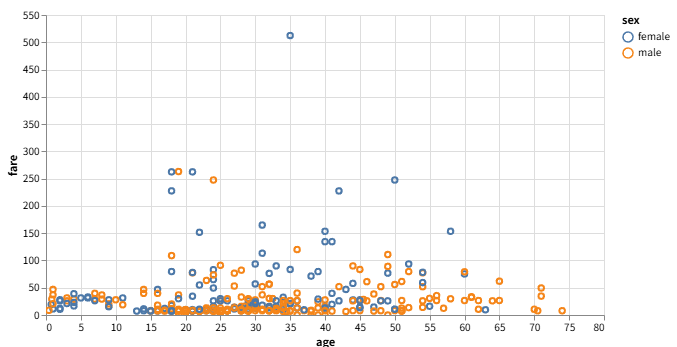
グラフ
グラフを表示することができます。
選択肢と組み合わせることで、インタラクティブにデータを可視化して内容を分析できます。
if len(plt_x_columns.value)!=1 & len(plt_y_columns.value)!=1 & len(plt_color_columns.value)!=1:
    mo.stop(predicate=True)
chart = mo.ui.altair_chart(altair.Chart(df).mark_point().encode(
    x=plt_x_columns.value[0],
    y=plt_y_columns.value[0],
    color=plt_color_columns.value[0]
))
mo.vstack([chart])
ブラウザ上での操作
ブラウザ上では、コードを非表示にして、UIや実行結果、ログなどのみを表示することができる。
この状態だと、Pythonプログラミングができない人でも扱うことができるので、非プログラマー向けのツールとして提供することができると考えている。