はじめに
今回はWindowsのEC2に、CloudWatch Agentをインストールする手順を公開します。
EC2に CloudWatch Agent をインストールして、メモリ使用率やログ収取等を取得することが出来ます。
CloudWatch Agentをインストールした後、諸ログ監視が非常に便利になるので、大変お勧めいたします。
今回の諸情報を下記に載せます。
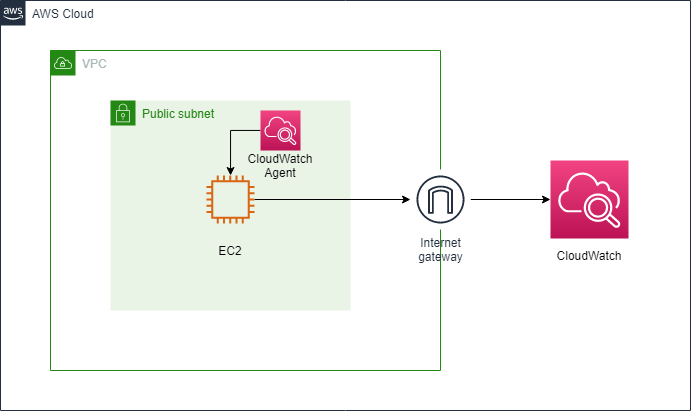
・OS: Windows Server 2019
・サブネット:パブリックサブネット
・CloudWatch Agentで採取するログ:
Windows Systemログ、Windows Securityログ、Windows Applicationログ、カスタムログ
・構成図:
1.IAMロール設定
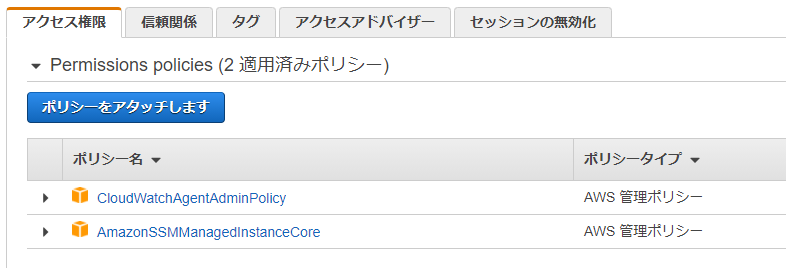
EC2用のIAMロールに、以下のロールを付与します。
・CloudWatchAgentAdminPolicy
・AmazonSSMManagedInstanceCore
※CloudWatch Agent用のIAMロールについてのAWS公式参考サイトを貼ります。
2.CloudWatch Agentをインストールする
※SSM Agentがインストールされているのが前提となります。
「AWS Systems Manager」→「Run Command」を押下します。

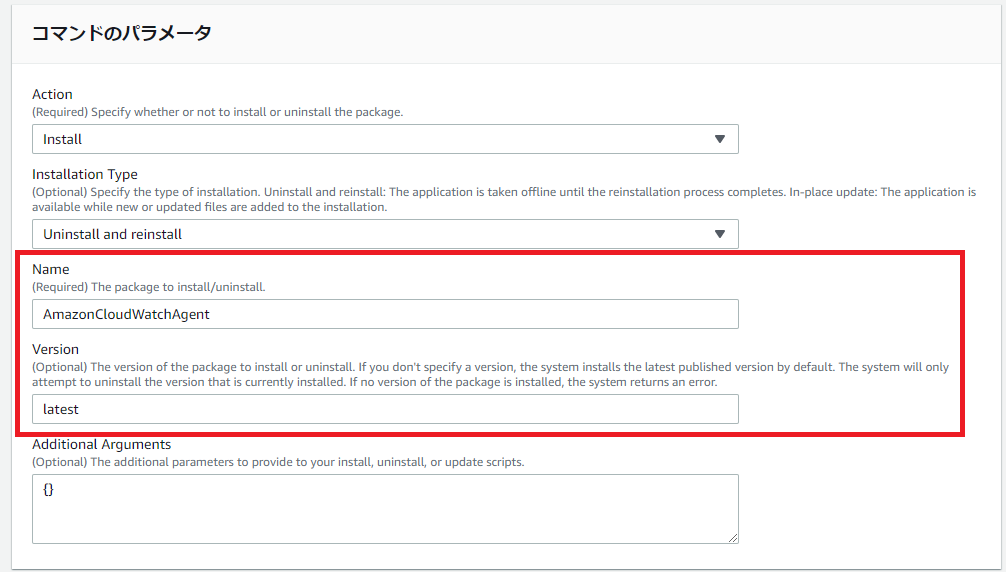
コマンドドキュメント欄に「AWS-ConfigureAWSPackage」を検索し、選択します。

コマンドのパラメータに、
・「Name」欄に「AmazonCloudWatchAgent」を入力します
・「Version」欄に「latest」を入力します
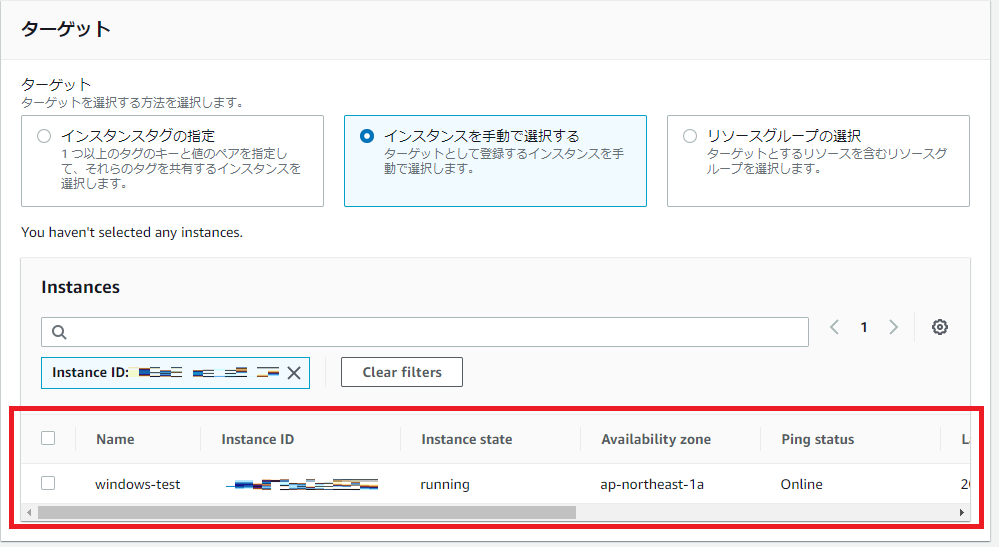
ターゲットに、対象のEC2を選択します。
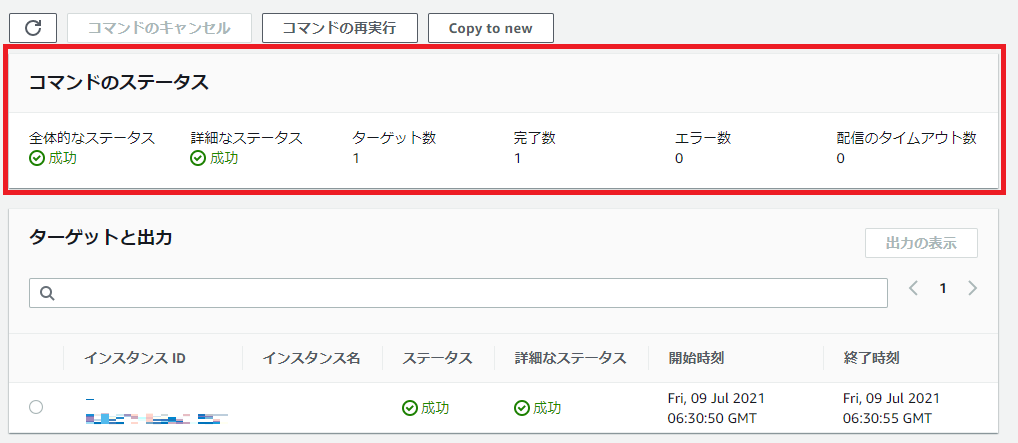
「実行」を押下し、下記のように成功マークが表示されればOKです。
これでEC2に、CloudWatch Agentをインストール完了しました。
3.CloudWatch Agentを定義
手順1にも書かれているように、今回CloudWatch Agentで採取予定のログは下記となります。
・Windows Systemログ
・Windows Securityログ
・Windows Applicationログ
・カスタムログ
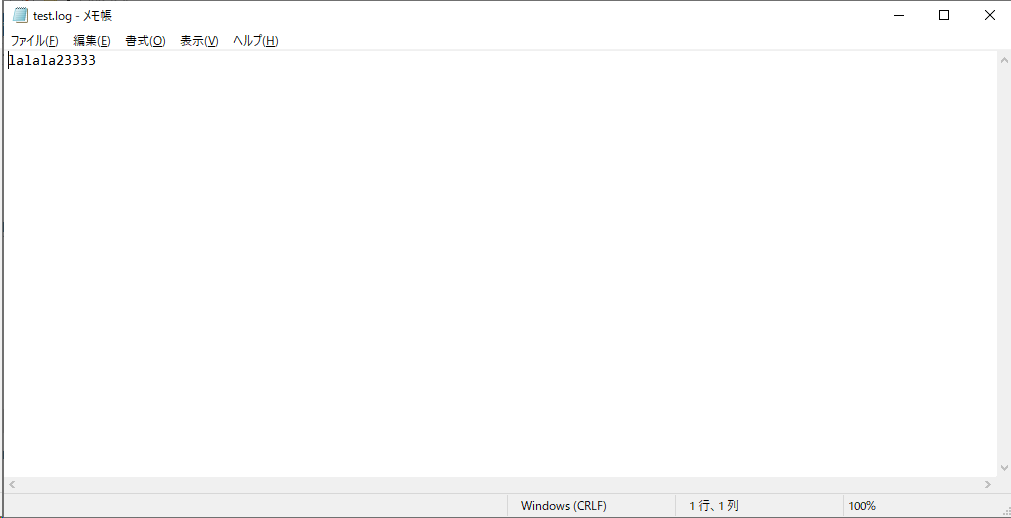
カスタムログは自分でテスト用のログを作成いたしました。
場所:C:\log-test\test.log

ログ内容:
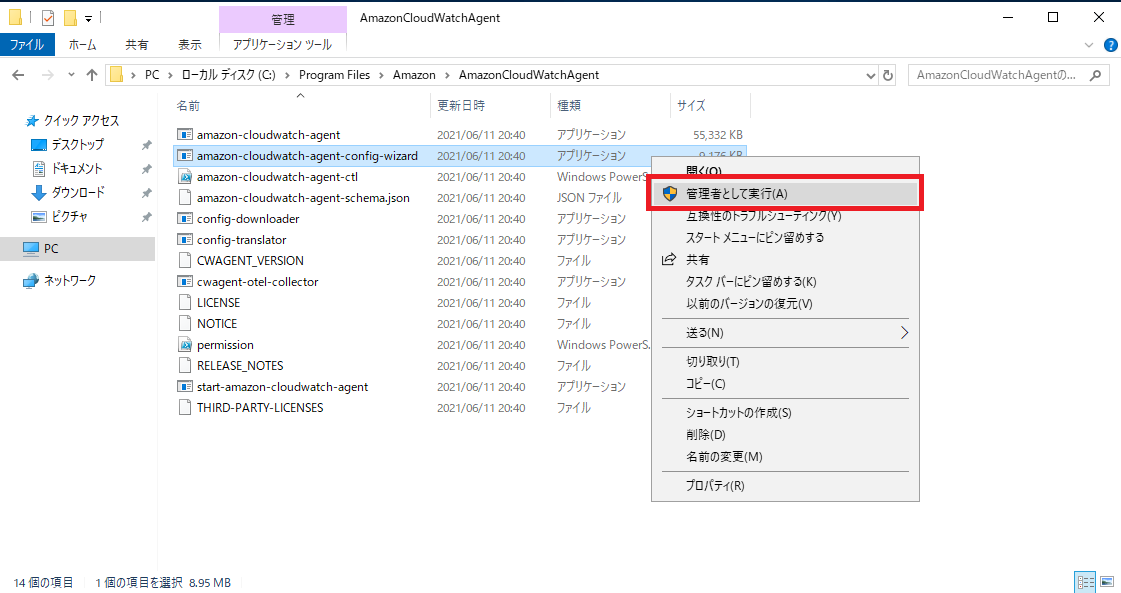
EC2上で、「C:\Program Files\Amazon\AmazonCloudWatchAgent」に移動し、
「amazon-cloudwatch-agent-config-wizard.exe」ファイルを管理者権限にて実行します。
下記はCloudWatch Agentの設定項目となります。
=============================================================
= Welcome to the AWS CloudWatch Agent Configuration Manager =
=============================================================
On which OS are you planning to use the agent?
1. linux
2. windows
3. darwin
default choice: [2]:
2
Trying to fetch the default region based on ec2 metadata...
Are you using EC2 or On-Premises hosts?
1. EC2
2. On-Premises
default choice: [1]:
1
Do you want to turn on StatsD daemon?
1. yes
2. no
default choice: [1]:
1
Which port do you want StatsD daemon to listen to?
default choice: [8125]
8125
What is the collect interval for StatsD daemon?
1. 10s
2. 30s
3. 60s
default choice: [1]:
1
What is the aggregation interval for metrics collected by StatsD daemon?
1. Do not aggregate
2. 10s
3. 30s
4. 60s
default choice: [4]:
4
Do you have any existing CloudWatch Log Agent configuration file to import for migration?
1. yes
2. no
default choice: [2]:
2
Do you want to monitor any host metrics? e.g. CPU, memory, etc.
1. yes
2. no
default choice: [1]:
1
Do you want to monitor cpu metrics per core? Additional CloudWatch charges may apply.
1. yes
2. no
default choice: [1]:
1
Do you want to add ec2 dimensions (ImageId, InstanceId, InstanceType, AutoScalingGroupName) into all of your metrics if the info is available?
1. yes
2. no
default choice: [1]:
1
Would you like to collect your metrics at high resolution (sub-minute resolution)? This enables sub-minute resolution for all metrics, but you can customize for specific metrics in the output json file.
1. 1s
2. 10s
3. 30s
4. 60s
default choice: [4]:
4
Which default metrics config do you want?
1. Basic
2. Standard
3. Advanced
4. None
default choice: [1]:
3
Current config as follows:
{
"metrics": {
"append_dimensions": {
"AutoScalingGroupName": "${aws:AutoScalingGroupName}",
"ImageId": "${aws:ImageId}",
"InstanceId": "${aws:InstanceId}",
"InstanceType": "${aws:InstanceType}"
},
"metrics_collected": {
"LogicalDisk": {
"measurement": [
"% Free Space"
],
"metrics_collection_interval": 60,
"resources": [
"*"
]
},
"Memory": {
"measurement": [
"% Committed Bytes In Use"
],
"metrics_collection_interval": 60
},
"Paging File": {
"measurement": [
"% Usage"
],
"metrics_collection_interval": 60,
"resources": [
"*"
]
},
"PhysicalDisk": {
"measurement": [
"% Disk Time",
"Disk Write Bytes/sec",
"Disk Read Bytes/sec",
"Disk Writes/sec",
"Disk Reads/sec"
],
"metrics_collection_interval": 60,
"resources": [
"*"
]
},
"Processor": {
"measurement": [
"% User Time",
"% Idle Time",
"% Interrupt Time"
],
"metrics_collection_interval": 60,
"resources": [
"*"
]
},
"TCPv4": {
"measurement": [
"Connections Established"
],
"metrics_collection_interval": 60
},
"TCPv6": {
"measurement": [
"Connections Established"
],
"metrics_collection_interval": 60
},
"statsd": {
"metrics_aggregation_interval": 60,
"metrics_collection_interval": 10,
"service_address": ":8125"
}
}
}
}
Are you satisfied with the above config? Note: it can be manually customized after the wizard completes to add additional items.
1. yes
2. no
default choice: [1]:
1
Do you want to monitor any customized log files?
1. yes
2. no
default choice: [1]:
1
Log file path:
C:\log-test\test.log
Log group name:
default choice: [test.log]
Windows-Test-Log
Log stream name:
default choice: [{instance_id}]
test-log-{instance_id}
Do you want to specify any additional log files to monitor?
1. yes
2. no
default choice: [1]:
2
Do you want to monitor any Windows event log?
1. yes
2. no
default choice: [1]:
1
Windows event log name:
default choice: [System]
System
Do you want to monitor VERBOSE level events for Windows event log System ?
1. yes
2. no
default choice: [1]:
1
Do you want to monitor INFORMATION level events for Windows event log System ?
1. yes
2. no
default choice: [1]:
1
Do you want to monitor WARNING level events for Windows event log System ?
1. yes
2. no
default choice: [1]:
1
Do you want to monitor ERROR level events for Windows event log System ?
1. yes
2. no
default choice: [1]:
1
Do you want to monitor CRITICAL level events for Windows event log System ?
1. yes
2. no
default choice: [1]:
1
Log group name:
default choice: [System]
Windows-System-Log
Log stream name:
default choice: [{instance_id}]
System-Log-{instance_id}
In which format do you want to store windows event to CloudWatch Logs?
1. XML: XML format in Windows Event Viewer
2. Plain Text: Legacy CloudWatch Windows Agent (SSM Plugin) Format
default choice: [1]:
1
Do you want to specify any additional Windows event log to monitor?
1. yes
2. no
default choice: [1]:
1
Windows event log name:
default choice: [System]
Security
Do you want to monitor VERBOSE level events for Windows event log Security ?
1. yes
2. no
default choice: [1]:
1
Do you want to monitor INFORMATION level events for Windows event log Security ?
1. yes
2. no
default choice: [1]:
1
Do you want to monitor WARNING level events for Windows event log Security ?
1. yes
2. no
default choice: [1]:
1
Do you want to monitor ERROR level events for Windows event log Security ?
1. yes
2. no
default choice: [1]:
1
Do you want to monitor CRITICAL level events for Windows event log Security ?
1. yes
2. no
default choice: [1]:
1
Log group name:
default choice: [Security]
Windows-Security-Log
Log stream name:
default choice: [{instance_id}]
Security-Log-{instance_id}
In which format do you want to store windows event to CloudWatch Logs?
1. XML: XML format in Windows Event Viewer
2. Plain Text: Legacy CloudWatch Windows Agent (SSM Plugin) Format
default choice: [1]:
1
Do you want to specify any additional Windows event log to monitor?
1. yes
2. no
default choice: [1]:
1
Windows event log name:
default choice: [System]
Application
Do you want to monitor VERBOSE level events for Windows event log Application ?
1. yes
2. no
default choice: [1]:
1
Do you want to monitor INFORMATION level events for Windows event log Application ?
1. yes
2. no
default choice: [1]:
1
Do you want to monitor WARNING level events for Windows event log Application ?
1. yes
2. no
default choice: [1]:
1
Do you want to monitor ERROR level events for Windows event log Application ?
1. yes
2. no
default choice: [1]:
1
Do you want to monitor CRITICAL level events for Windows event log Application ?
1. yes
2. no
default choice: [1]:
1
Log group name:
default choice: [Application]
Windows-Application-Log
Log stream name:
default choice: [{instance_id}]
Application-Log-{instance_id}
In which format do you want to store windows event to CloudWatch Logs?
1. XML: XML format in Windows Event Viewer
2. Plain Text: Legacy CloudWatch Windows Agent (SSM Plugin) Format
default choice: [1]:
1
Do you want to specify any additional Windows event log to monitor?
1. yes
2. no
default choice: [1]:
2
Saved config file to config.json successfully.
Current config as follows:
{
"logs": {
"logs_collected": {
"files": {
"collect_list": [
{
"file_path": "C:\\log-test\\test.log",
"log_group_name": "Windows-Test-Log",
"log_stream_name": "test-log-{instance_id}"
}
]
},
"windows_events": {
"collect_list": [
{
"event_format": "xml",
"event_levels": [
"VERBOSE",
"INFORMATION",
"WARNING",
"ERROR",
"CRITICAL"
],
"event_name": "System",
"log_group_name": "Windows-System-Log",
"log_stream_name": "System-Log-{instance_id}"
},
{
"event_format": "xml",
"event_levels": [
"VERBOSE",
"INFORMATION",
"WARNING",
"ERROR",
"CRITICAL"
],
"event_name": "Security",
"log_group_name": "Windows-Security-Log",
"log_stream_name": "Security-Log-{instance_id}"
},
{
"event_format": "xml",
"event_levels": [
"VERBOSE",
"INFORMATION",
"WARNING",
"ERROR",
"CRITICAL"
],
"event_name": "Application",
"log_group_name": "Windows-Application-Log",
"log_stream_name": "Application-Log-{instance_id}"
}
]
}
}
},
"metrics": {
"append_dimensions": {
"AutoScalingGroupName": "${aws:AutoScalingGroupName}",
"ImageId": "${aws:ImageId}",
"InstanceId": "${aws:InstanceId}",
"InstanceType": "${aws:InstanceType}"
},
"metrics_collected": {
"LogicalDisk": {
"measurement": [
"% Free Space"
],
"metrics_collection_interval": 60,
"resources": [
"*"
]
},
"Memory": {
"measurement": [
"% Committed Bytes In Use"
],
"metrics_collection_interval": 60
},
"Paging File": {
"measurement": [
"% Usage"
],
"metrics_collection_interval": 60,
"resources": [
"*"
]
},
"PhysicalDisk": {
"measurement": [
"% Disk Time",
"Disk Write Bytes/sec",
"Disk Read Bytes/sec",
"Disk Writes/sec",
"Disk Reads/sec"
],
"metrics_collection_interval": 60,
"resources": [
"*"
]
},
"Processor": {
"measurement": [
"% User Time",
"% Idle Time",
"% Interrupt Time"
],
"metrics_collection_interval": 60,
"resources": [
"*"
]
},
"TCPv4": {
"measurement": [
"Connections Established"
],
"metrics_collection_interval": 60
},
"TCPv6": {
"measurement": [
"Connections Established"
],
"metrics_collection_interval": 60
},
"statsd": {
"metrics_aggregation_interval": 60,
"metrics_collection_interval": 10,
"service_address": ":8125"
}
}
}
}
Please check the above content of the config.
The config file is also located at config.json.
Edit it manually if needed.
Do you want to store the config in the SSM parameter store?
1. yes
2. no
default choice: [1]:
1
What parameter store name do you want to use to store your config? (Use 'AmazonCloudWatch-' prefix if you use our managed AWS policy)
default choice: [AmazonCloudWatch-windows]
AmazonCloudWatch-windows-test
Trying to fetch the default region based on ec2 metadata...
Which region do you want to store the config in the parameter store?
default choice: [ap-northeast-1]
ap-northeast-1
Which AWS credential should be used to send json config to parameter store?
1. XXXXXXXXXXXXXXXXXXXX(From SDK)
2. Other
default choice: [1]:
1
Successfully put config to parameter store AmazonCloudWatch-windows-test.
Please press Enter to exit...
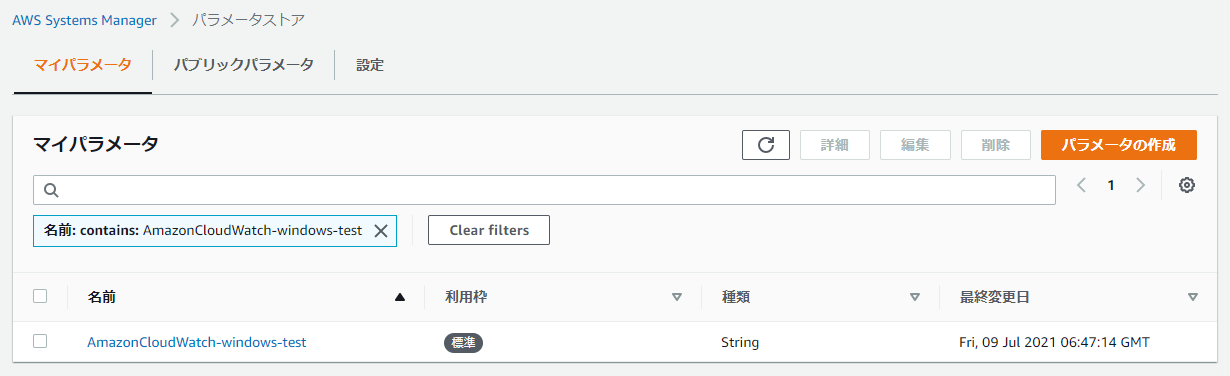
上記の Config ファイルを Systems Manager のパラメータストアで、「AmazonCloudWatch-windows-test」として定義しましたので、パラメータストアで、「AmazonCloudWatch-windows-test」が当パラメータが反映できたかどうかを確認します。
無事に反映できました。
4.Systems Manager から CloudWatch Agentを起動
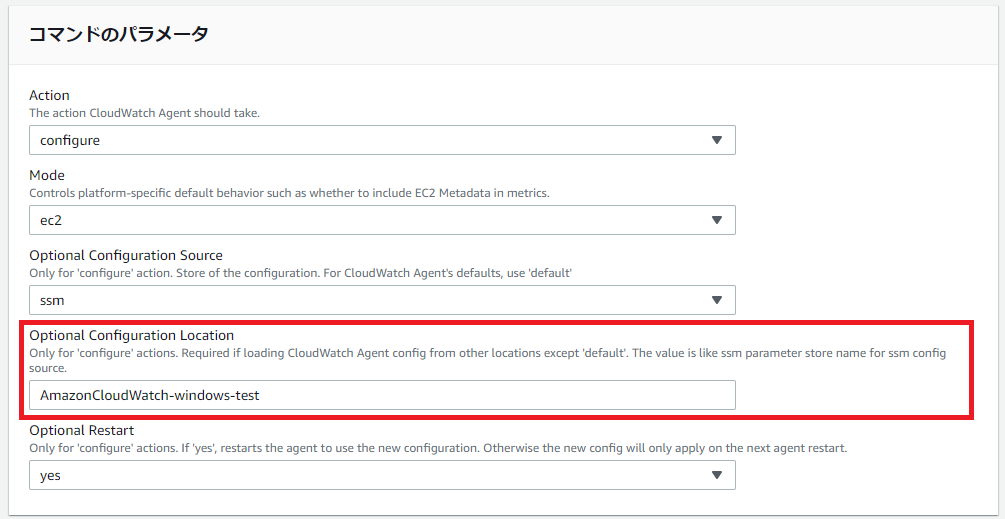
「AWS Systems Manager」→「Run Command」で、「AmazonCloudWatch-ManageAgent」検索し、選択します。
ドキュメントのバージョンは「5」を選択します。

「Optional Configuration Location」に、上記手順3で定義したパラメータ名を入れます。
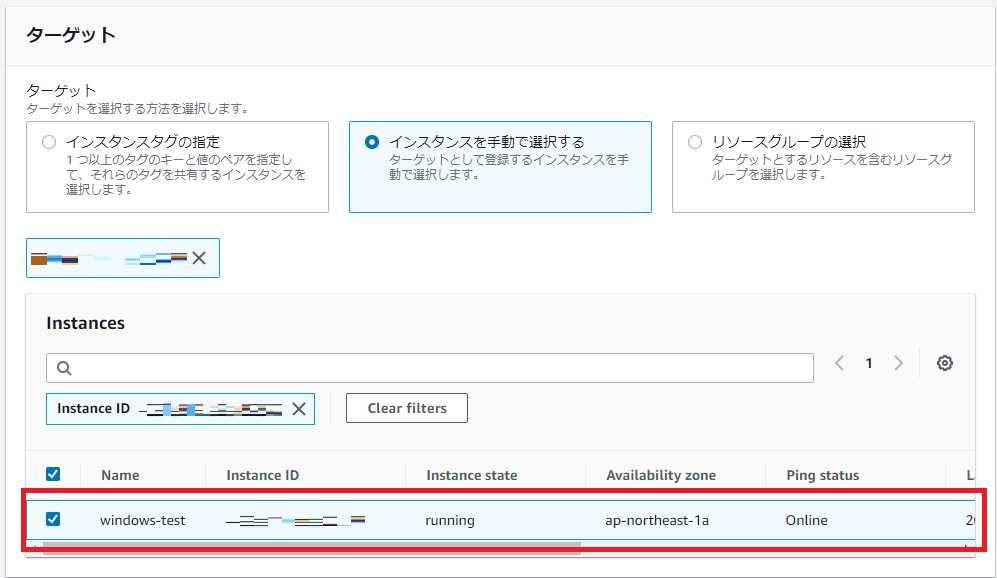
ターゲットに、対象のEC2を選択します。
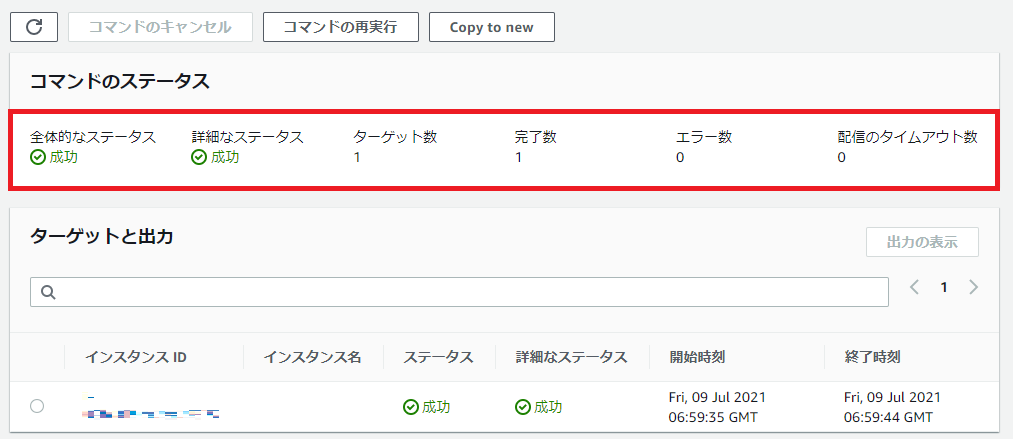
「実行」を押下し、下記のように成功マークが表示されればOKです。
それでCloudWatch Agentを有効化しました。
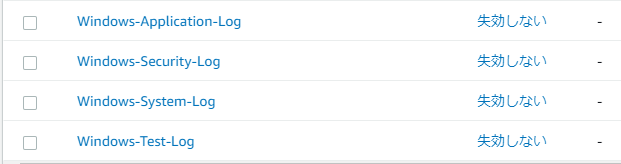
5.確認
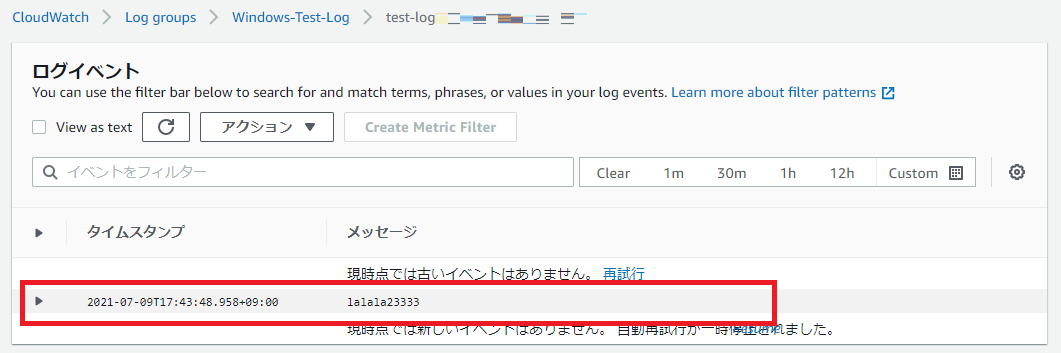
CloudWatch Logsに、上記で定義したログファイルが転送されているかどうかを確認したところ、うまく反映できていることを観測できました。
「Windows-Test-Log」の中身を確認しますと、定義されたカスタムログの内容はうまく反映できていることがわかりました。
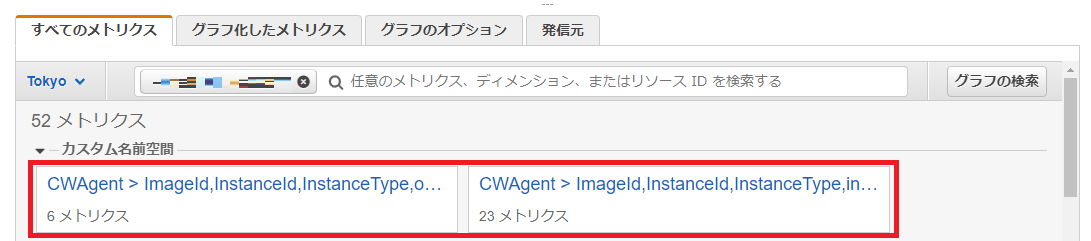
続いてメトリクスを確認したところ、メトリクスも反映できていることがわかりました。
これでCloudWatch Agentの導入&確認が終了しました。