7
8

Delete article

Deleted articles cannot be recovered.

Draft of this article would be also deleted.

Are you sure you want to delete this article?

More than 5 years have passed since last update.

sar用のグラフ化ツール【ksar】を使ってみた

Posted at

メモメモ程度に。
SEならたまに見るであろう sar 。
直接見ても醜いだけのあのログを一発でグラフ化できるツールがあります。

困ったときは是非使ってみましょう。

1. ksarってなんだ?

ksar は、Linux、Mac、Solarisなどのsar用のグラフ作成ツール。
グラフをPDFに出力できる。

2. インストールしてみる

いろんなページにインストールファイルはありますが、今回は下記から。。。
https://osdn.jp/projects/sfnet_ksar/

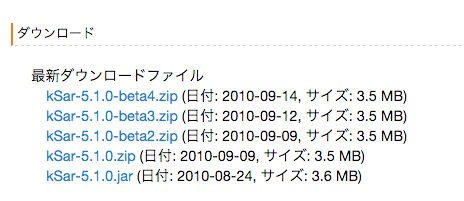
ダウンロードできるのは、 ZIP形式jar形式 の2ファイル。
また、ツール使うために java が必要になるので、使用している環境に java
インストールされていない場合は事前にこちらもインストールする必要あり。

ファイルサイズは、3.5MB程度。

2.1. ファイルをインストール

kobito.1452253351.063307.png

kobito.1452253374.547198.png

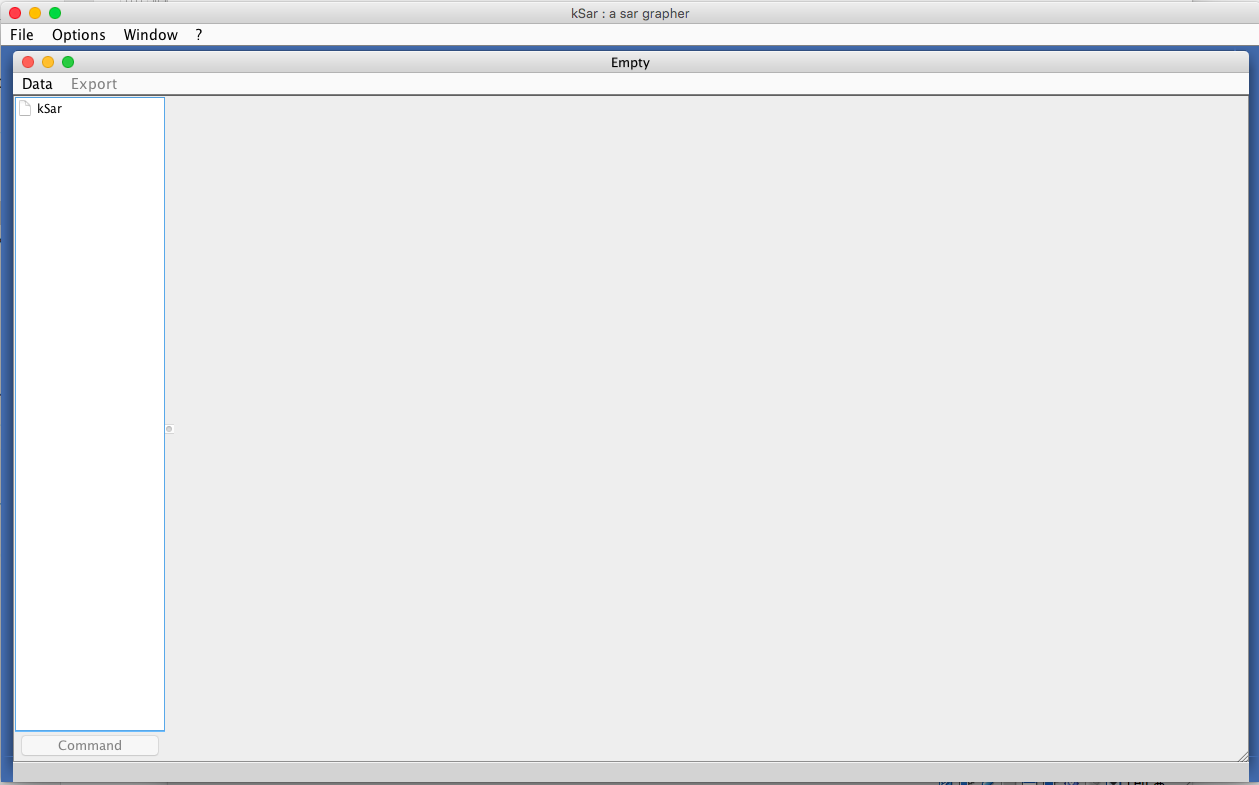
2.2. 起動してみる

kobito.1452253526.570604.png

直ぐにアプリケーション起動します。

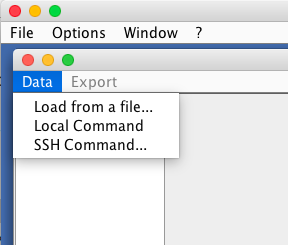
2.3. 使ってみる

スクリーンショット 2016-01-08 20.46.17.png

データは、いろいろとインポートする方法があるみたい。。

手元にsarファイルが無かったので、他のサイトを参照。
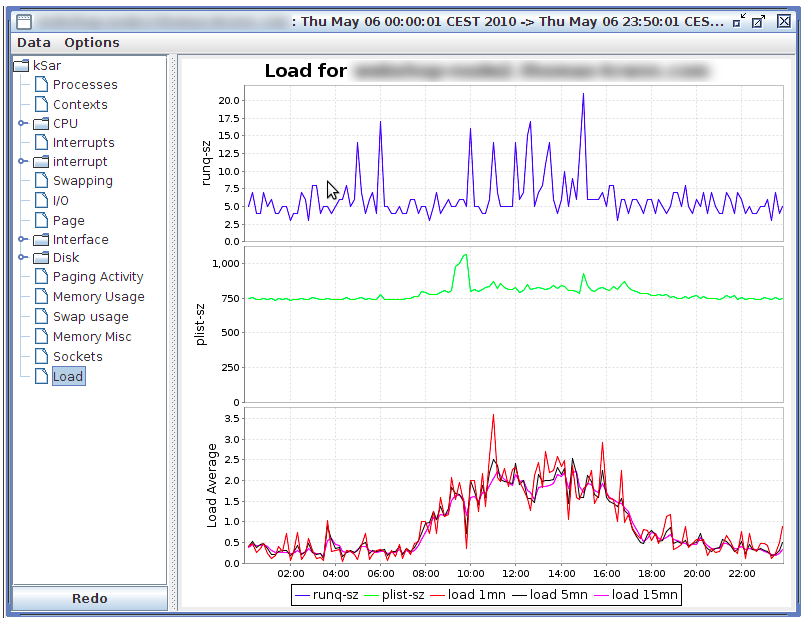
こんな感じにグラフ化できますね。
kobito.1452254318.477471.png

7
8
0

Register as a new user and use Qiita more conveniently

  1. You get articles that match your needs
  2. You can efficiently read back useful information
  3. You can use dark theme
What you can do with signing up
7
8

Delete article

Deleted articles cannot be recovered.

Draft of this article would be also deleted.

Are you sure you want to delete this article?