波形解析(揺動解析・振動解析)で高速フーリエ変換する場合、
しばしば規格化する必要があるので、係数に無関心になりがち。
振動振幅を求めるときに係数が分からないといけないのでまとめておきます。
サンプル波形の作成 (準備)
import numpy as np
import matplotlib.pyplot as plt

# サンプル波形の作成
def sample_wave(dlen,fs,dt,a0,f0,x0):
    #  dat = x0 + a sin( 2pi f t ) + noise(0,1)
    t    = np.arange(dlen) * dt              #時間データ [sec]
    dat  = a0 * np.sin(2.* np.pi * f0 * t)   #sin波形
    dat += x0 + np.random.normal(0.,1.,dlen) #中心値0, 分散1のホワイトノイズ
    return t,dat

# パラメータ入力
dlen  = 2**16  # データのデータ長   [points]
fs    = 500.e3 # サンプリング周波数 [Hz]
dt    = 1./fs  # サンプリング間隔   [sec]
a0    = 1.     #振幅       [V]
f0    = 1000.  #周波数     [Hz]
x0    = 10.0   #オフセット [V]

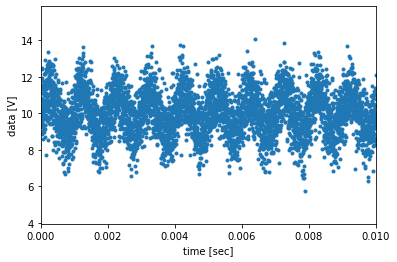
t,dat = sample_wave(dlen,fs,dt,a0,f0,x0)
plt.plot(t,dat,".")
plt.xlim([0,0.01])
1. FFT (scipy.fftpack.fftの利用)
単純に生波形をFFTにかける
from scipy import fftpack
sxx  = fftpack.fft(dat)           #FFTの実行 (窓関数なし)
freq = fftpack.fftfreq(dlen,d=dt) #周波数リストの作成
df   = 1./(dlen*dt)               #周波数分解能
Pxx  = np.abs(sxx)**2 / fs /dlen  #パワースペクトラム [V**2/Hz]

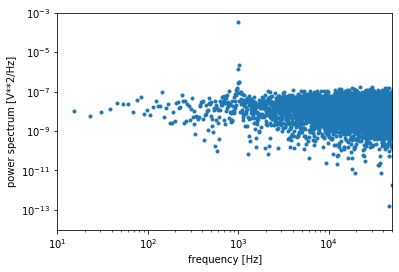
plt.plot(freq,Pxx,".")

plt.xlabel("frequency [Hz]")
plt.ylabel("power spectrum [V**2/Hz]")
plt.xscale("log")
plt.yscale("log")                      #負の周波数は非表示になる
1000Hzのパワーピーク確認。その値を調べて、振幅を見積もる。
def getNearestindex(list, num):
    """
    概要: リストからある値に最も近いインデックスを返す関数
    @param list: データ配列
    @param num: 対象値
    @return 対象値に最も近い値
    """
    # リスト要素と対象値の差分を計算し最小値のインデックスを取得
    idx = np.abs(np.asarray(list) - num).argmin()
    return idx

ind = getNearestindex(freq,f0)     #f0に近いインデックスを取得
print("ind=",ind,"val=",freq[ind])
# >>    ind=  131  val=  999.4

# f0の振幅について
# パワー密度[V**2/Hz]に[Hz]をかけてRMSを求める
rms = np.sqrt( Pxx[ind] * df * 2 ) # 負の周波数のパワーも考慮して2倍
amp = rms * np.sqrt(2)             # 振幅= 実効値* sqrt(2)
print("amplitude =", amp )
# >>    amplitude = 0.9920      # a0 = 1.0と少し離れている

# f0周辺の周波数バンドの振幅について(ind+/-2の領域を取った)
# バンド内のパワー密度の総和でバンド内のRMSを求める
rms = np.sqrt( np.sum(Pxx[ind-2:ind+3]) *df * 2 )  # 負の周波数のパワーも考慮して2倍
amp = rms * np.sqrt(2)                             # 振幅= 実効値* sqrt(2)
print("amplitude =", amp )
# >>    amplitude = 0.9982         << a0 = 1.0に近づいた
生波形を規格化してFFTにかける
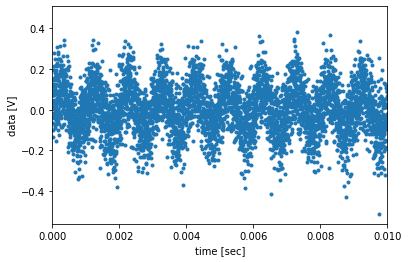
次はオフセットを引き、オフセットの値で規格化した方法
t,datn = sample_wave(dlen,fs,dt,a0,f0,x0) #パラメータは前項と同じ
datn   = (dat-x0) / x0                    #規格化

plt.plot(t,datn,".")
plt.xlim([0,0.01])
plt.xlabel("time [sec]")
plt.ylabel("data [V]")
sxxn  = fftpack.fft(datn)
freq  = fftpack.fftfreq(dlen,d=dt)
df    = 1./(dlen*dt)
Pxx   = np.abs(sxxn)**2 / fs /dlen  #パワースペクトラム
次元が [V] => [(V-x0)/x0] に変わったことに注意して、
1000Hzのパワーピーク確認。その値を調べて、振幅を見積もる。
# f0周辺の周波数バンドの振幅について(ind+/-2の領域を取った)
# バンド内のパワー密度の総和でバンド内のRMSを求める
rms = np.sqrt( np.sum(Pxx[ind-2:ind+3]) *df *2 ) #負の周波数のパワーも考慮して2倍
amp = rms * np.sqrt(2)
print("amplitude =", amp )
# >>    amplitude = 0.0998         << a0/x0 = 1.0/10.0 = 0.1に近い
2.FFT (scipy.signalの利用)
scipy.signalには高級ルーチンがあるので素性を確かめる。
分かりやすさのため、あえて全体のデータ長とwindow長は同じにする
signal.stft と singal.spectrogram の比較
from scipy import signal
t,dat = sample_wave(dlen,fs,dt,a0,f0,x0) #パラメータは前項と同じ

Sxx,frq,Pxx={},{},{}

# fftpack.fft #前項と同じ
frq["fft"],  _t, Sxx["fft"]  = fftpack.fftfreq(dlen,d=dt), _, fftpack.fft( dat )

# signal.stft        (窓関数を矩形, window = "boxcar")
frq["stft"], _t, Sxx["stft"] = \
    signal.stft(      dat,fs       = fs,
                          nperseg  = dlen,
                          window   = "boxcar",
                          boundary = None,
                          detrend  = "constant",
                          return_onesided = False   )

# singal.spectrogram (窓関数を矩形, mode="complex", scaling='spectrum')
frq["spectrogram_spectrum"],_t,Sxx["spectrogram_spectrum"]  = \
    signal.spectrogram(dat,fs      = fs,
                           nperseg = dlen,
                           mode    = "complex",
                           window  = "boxcar",
                           scaling = "spectrum",
                           return_onesided = False   )

# singal.spectrogram (窓関数を矩形,  mode="psd", scaling='density')
frq["spectrogram_density"],_t,Sxx["spectrogram_density"]  = \
    signal.spectrogram(dat,fs      = fs,
                           nperseg = dlen,
                           mode    = "psd",
                           window  = "boxcar",
                           scaling = "density",
                           return_onesided = False   )

#### スペクトラム密度 [ V**2/Hz ] に係数に気を付けて変換
Pxx["fft"]                   = np.abs( Sxx["fft"]                       )**2 / fs / dlen
Pxx["stft"]                  = np.abs( Sxx["stft"][:,0]                 )**2 / df
Pxx["spectrogram_spectrum"]  = np.abs( Sxx["spectrogram_spectrum"][:,0] )**2 / df
Pxx["spectrogram_density" ]  = np.abs( Sxx["spectrogram_density" ][:,0] )

# 前項のscipy.fftpack.fftと似てるかどうか
for key in ["fft","stft","spectrogram_spectrum","spectrogram_density"]:
    print(np.allclose( Pxx["fft"][1:], Pxx[key][1:], atol=1e-4), key )
# >>                    True fft
# >>                    True stft
# >>                    True spectrogram_spectrum
# >>                    True spectrogram_density
freq=0以外一致します。
窓関数の採用について
window = ("tukey",0.25)
frq["spectrogram_spectrum_tukey"] ,t,Sxx["spectrogram_spectrum_tukey" ] = \
    signal.spectrogram(dat,fs      = fs,
                           nperseg = dlen,
                           return_onesided = False,
                           mode    = "complex",
                           window  = window,
                           scaling = 'spectrum'         )

window = ("tukey",0.25)
frq["spectrogram_density_tukey"] ,t,Sxx["spectrogram_density_tukey" ] = \
    signal.spectrogram(dat,fs      = fs,
                           nperseg = dlen,
                           return_onesided = False,
                           mode    = "psd",
                           window  = window,
                           scaling = 'density'         )

Pxx["spectrogram_spectrum_tukey" ]  = np.abs( Sxx["spectrogram_spectrum_tukey"][:,0] )**2 / df
Pxx["spectrogram_density_tukey" ]   = np.abs( Sxx["spectrogram_density_tukey" ][:,0] )

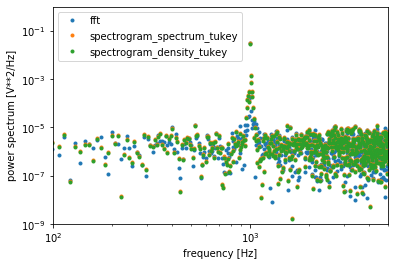
# グラフで比較する
for key in ["fft","spectrogram_spectrum_tukey","spectrogram_density_tukey"]:
    plt.plot(frq[key],np.abs(Pxx[key]),".",label=key)
plt.xlabel("frequency [Hz]")
plt.ylabel("power spectrum [V**2/Hz]")
plt.yscale("log")
plt.xscale("log")
plt.xlim([100,5000])
plt.ylim([1e-9,1e0])
plt.legend()

窓関数のサイドローブがあるので厳密には一致しないが、窓関数補正もかかっている。
return_oneside =True/Falseについて
window = ("tukey",0.25)
key = "spectrogram_psd_tukey_oneside"
frq[key] ,t,Sxx[key] = \
    signal.spectrogram(dat,fs      = fs,
                           nperseg = dlen,
                           return_onesided = True,
                           mode    = "psd",
                           window  = window,
                           scaling = 'density'         )
Pxx[key] = np.abs( Sxx[key][:,0] )

# 振幅で確認
key = "spectrogram_density"
print( np.sqrt( np.sum(Pxx[key][ind-3:ind+4]) * 2 * df)*np.sqrt(2), key) #負の周波数を考慮して2倍
# >> 0.987 spectrogram_density
key = "spectrogram_psd_tukey_oneside"
print( np.sqrt( np.sum(Pxx[key][ind-3:ind+4]) *     df)*np.sqrt(2), key) #すでに折込み済み
# >> 0.987 spectrogram_psd_tukey_oneside
一致しています。
まとめ
| function | mode | scaling | onside | how to cal. Power |
|---|---|---|---|---|
| fftpack.fft() | (complex) | (spectrum) | (False) | S^2/ fs/ dlen * 2 |
| stft() | (complex) | (spectrum) | False | S^2/ df * 2 |
| stft() | (complex) | (spectrum) | True | S^2/ df * 2 |
| spectrogram() | complex | spectrum | False | S^2/ df * 2 |
| spectrogram() | psd | density | False | S *2 |
| spectrogram() | psd | density | True | S |
| *Sは関数の戻り値 | ||||
| *窓関数は補正してくれる |
rms = sqrt(Power * df )
振幅 = rms * sqrt(2)
| 説明 | 本稿の記号 |
|---|---|
| データ長 | dlen |
| サンプリングレート | fs |
| 時間分解能 | dt = 1./fs |
| 周波数分解能 | df = 1./(dlen*dt) = 1./ T |
よくみたソースコード
scipy.fftpack.fft
scipy.signal.stft
scipy.signal.spectrogram
_spectral_helperと_fft_helper
あとがき
stft()とfftpack.fft()の出力が違うことでハマった。
毎回係数で不安になるので備忘録代わりに一度まとめておきました。


