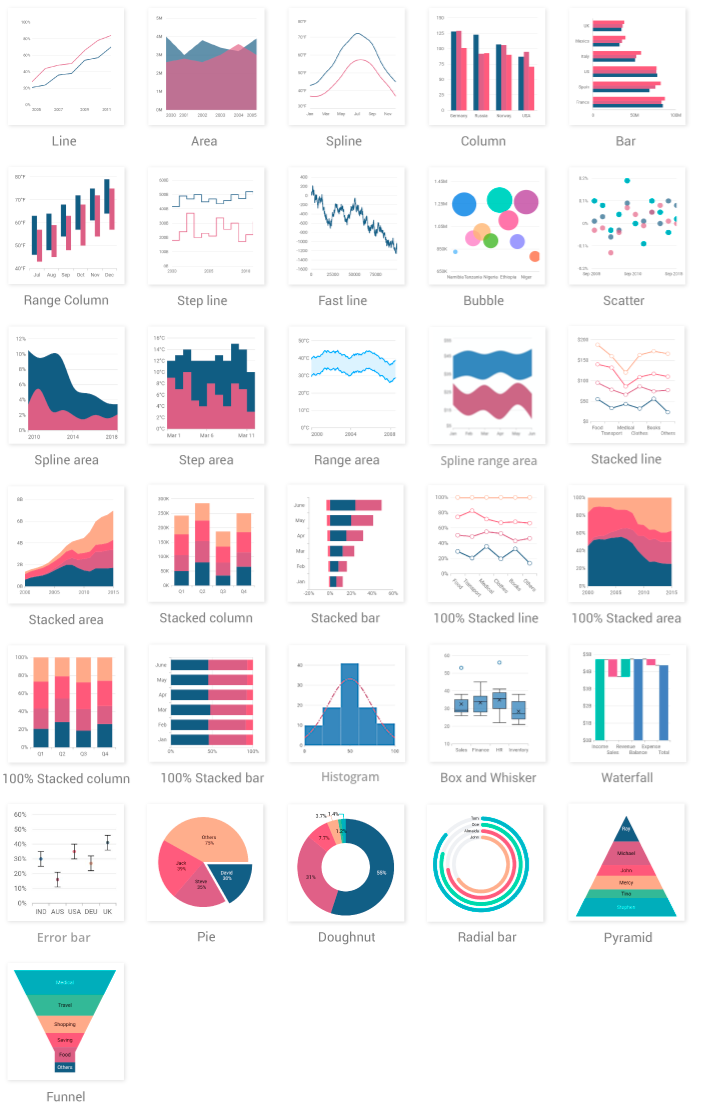
ライセンスによっては有料ですが、高機能なチャートライブラリsyncfusion_flutter_chartsを試してみたので紹介します。

料金
年間総収入が100万米ドル未満で、開発者が5人以下の企業および個人はCOMMUNITY LICENSEで無料で使うことができます。
それ以外のライセンスTEAM LICENSE,UNLIMITED LICENSEの料金は、こちらに記載されています。
https://www.syncfusion.com/sales/communitylicense
Line Chartを試してみる
まずは表示してみる
これだけの実装で十分立派なチャートが表示されます。
class ChartData {
  ChartData(this.date, this.y);
  final DateTime date;
  final num? y;
}

class _ChartState extends State<Chart> {
  List<ChartData> chartData = <ChartData>[];

  Widget build(BuildContext context) {
    return SfCartesianChart(
      primaryXAxis: DateTimeAxis(),
      primaryYAxis: NumericAxis(),
      series: [
        LineSeries<ChartData, DateTime>(
          dataSource: chartData,
          color: Colors.blue,
          xValueMapper: (ChartData data, _) => data.date,
          yValueMapper: (ChartData data, _) => data.y,
        )
      ],
    );
  }
}

Y軸のラベルを調整する
例えば1万単位でラベルを表示したい、ラベルの末尾を 万にしたいのようなことも、NumericAxisのプロパティを使うことでできます。
    return SfCartesianChart(
      primaryYAxis: NumericAxis(
        minimum: 90000,
        maximum: 110000,
        interval: 10000,
        axisLabelFormatter: (AxisLabelRenderDetails axisLabelRenderArgs) {
          if (axisLabelRenderArgs.value > 0) {
            return ChartAxisLabel("${axisLabelRenderArgs.value ~/ 10000}万", null);
          } else {
            return ChartAxisLabel("0", null);
          }
        },
      ),

同様にX軸もDateTimeAxisを設定することで自由にラベルを設定できます。
Tooltipを表示する
TooltipBehaviorを設定することで表示できます。
    return SfCartesianChart(
      tooltipBehavior: TooltipBehavior(enable: true),

Tooltipをカスタマイズする
TooltipをカスタマイズするにはTooltipBehavior.builderを使うことで、実現できます。
    return SfCartesianChart(
      tooltipBehavior: TooltipBehavior(
        enable: true,
        builder: (dynamic data, dynamic point, dynamic series, int pointIndex, int seriesIndex) {
          if (chartData.length < pointIndex) {
            return const SizedBox.shrink();
          }

          final data = chartData[pointIndex];
          final dateFormat = DateFormat('yyyy/MM/dd');
          final numberFormat = NumberFormat('#,###');
          return Container(
            height: 55,
            padding: const EdgeInsets.all(10),
            decoration: const BoxDecoration(
              borderRadius: BorderRadius.all(Radius.circular(5)),
              color: Color(0xFFF7F7F7),
            ),
            child: Column(
              crossAxisAlignment: CrossAxisAlignment.start,
              children: [
                Text(
                  dateFormat.format(data.date),
                  style: const TextStyle(color: Colors.black, fontSize: 12),
                ),
                Text(
                  "¥${numberFormat.format(data.y)}",
                  style: const TextStyle(color: Colors.black, fontSize: 16, fontWeight: FontWeight.w700),
                ),
              ],
            ),
          );
        },
      ),

最後に
Line Chartを例に簡単な実装を紹介しましたが、これ以外にも多様なカスタマイズを実現するための仕組みが提供されています。
数百件以上のデータを表示しても問題ないし、大量データの一部だけを表示しそのレンジを自由に操作できるようなチャートも設定できたりと十分に実践レベルの出来であると感じました。
値段が問題ないようであれば、実際のプロダクトでもぜひ利用してみたいと思います!