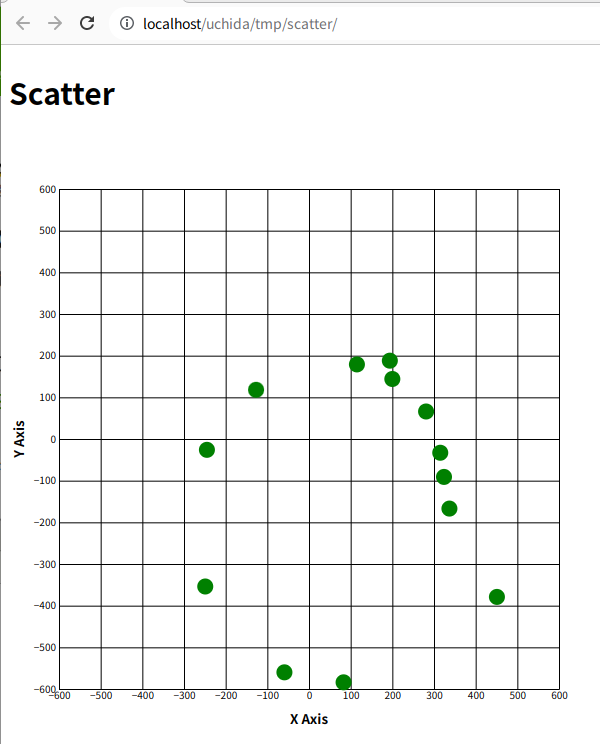
描画した結果
プログラム
index.html
<!DOCTYPE html>
<html lang="ja">
<head>
<meta charset="utf-8">
<title>Scatter</title>
<script src="https://d3js.org/d3.v7.min.js"></script>
</head>
<body>
<script src="scatter.js"></script>
<h2>Scatter</h2>
<p class="contents"></p>
<hr />
<div id="outarea_aa">outarea_aa</div>
<div id="outarea_bb">outarea_bb</div>
<div id="outarea_cc">outarea_cc</div>
<div id="outarea_dd">outarea_dd</div>
<div id="outarea_ee">outarea_ee</div>
<div id="outarea_ff">outarea_ff</div>
<div id="outarea_gg">outarea_gg</div>
<div id="outarea_hh">outarea_hh</div>
<p>Feb/3/2023 AM 11:36</p>
</body>
</html>
scatter.js
// -----------------------------------------------------------------------
//	scatter.js
//
//						Feb/03/2022
// -----------------------------------------------------------------------
'use strict'
// -----------------------------------------------------------------------
function draw_graph_proc(dataset)
{
	const width = 600; // グラフの幅
	const height = 600; // グラフの高さ
	const margin = { "top": 50, "bottom": 50, "right": 50, "left": 50 };

	// 2. SVG領域の設定
	var svg = d3.select(".contents").append("svg").attr("width", width).attr("height", height);

	// 3. 軸スケールの設定
	var xScale = d3.scaleLinear()
		.domain([-600, 600])
		.range([margin.left, width - margin.right]);

	var yScale = d3.scaleLinear()
		.domain([-600, 600])
		.range([height - margin.bottom, margin.top]);

	// 4. 軸の表示
	var axisx = d3.axisBottom(xScale).ticks(10).tickSize(-500);
	var axisy = d3.axisLeft(yScale).ticks(10).tickSize(-500);

	svg.append("g")
		.attr("transform", "translate(" + 0 + "," + (height - margin.bottom) + ")")
		.call(axisx)
		.append("text")
		.attr("fill", "black")
		.attr("x", (width - margin.left - margin.right) / 2 + margin.left)
		.attr("y", 35)
		.attr("text-anchor", "middle")
		.attr("font-size", "10pt")
		.attr("font-weight", "bold")
		.text("X Axis");

	svg.append("g")
		.attr("transform", "translate(" + margin.left + "," + 0 + ")")
		.call(axisy)
		.append("text")
		.attr("fill", "black")
		.attr("x", -(height - margin.top - margin.bottom) / 2 - margin.top)
		.attr("y", -35)
		.attr("transform", "rotate(-90)")
		.attr("text-anchor", "middle")
		.attr("font-weight", "bold")
		.attr("font-size", "10pt")
		.text("Y Axis");

	// 5. プロットの表示
	svg.append("g")
		.selectAll("circle")
		.data(dataset)
		.enter()
		.append("circle")
		.attr("cx", function(d) { return xScale(d[0]); })
		.attr("cy", function(d) { return yScale(d[1]); })
		.attr("fill", "green")
		.attr("r", 8);

}

// -----------------------------------------------------------------------
window.onload = ()=>
{
	document.querySelector("#outarea_aa").innerHTML = "*** scatter.js *** start ***"
	document.querySelector("#outarea_bb").innerText = "*** scatter.js *** start bb ***"

	const file_json = "./in01.json"
	d3.json(file_json).then(function(dataset){
		draw_graph_proc(dataset)
		})

	document.querySelector("#outarea_gg").innerHTML = "*** scatter.js *** end ***"
	document.querySelector("#outarea_hh").innerText = "*** scatter.js *** end bb ***"

}

// -----------------------------------------------------------------------
in01.json
[
[194, 188],
[-127, 118],
[-245, -26],
[-249, -354],
[-59, -560],
[83, -584],
[451, -379],
[337, -167],
[324, -91],
[315, -33],
[281, 66],
[115, 179],
[200, 144]
]
