この記事はNTTドコモソリューションズ Advent Calendar 2025 11日目の記事です。
NTTドコモソリューションズの東です。
社内では技術支援・ナレッジ蓄積を行う後方部隊的な部署で特にKubernetesやコンテナ界隈を担当し、オープンソースを活用したクラウドネイティブ系技術の普及展開を目論んでいます。
Kubernetes(以降k8s)は、クラウドネイティブなアプリケーション運用の基盤として広く利用されています。その中でも「スケジューリング」は、クラスタ内のリソースを効率的に活用し、アプリケーションのパフォーマンスを最大化するための重要なコンポーネントです。
しかし、スケジューラの挙動を深く理解したり、カスタムスケジューラやプラグインを開発・検証するには、本番環境でのテストはリスクが高く、再現性の確保も難しいという課題があります。
そこで登場するのが「kube-scheduler-simulator」です。このOSSは、Kubernetesのスケジューリングを安全かつ効率的にシミュレーションできる環境を提供し、スケジューラの動作を深堀りするための強力なツールとなります。
というわけで本稿では「kube-scheduler-simulator」を活用する手順をなるべく具体的に実例を挙げながら紹介していきます。
あ、タイトルの"完全に理解する"はお決まりのネタですw
kube-scheduler-simulatorを活用し勉強を進めればその域に到達できるとは思いますが、私はまだ道半ばです。。
kube-scheduler-simulatorを活用する動機とメリット
k8sのスケジューリングは、単なるPod配置の問題ではありません。ノードのリソース状況、AffinityやTaint/Toleration、さらにはカスタムポリシーなど、複雑な要素が絡み合っています。本番クラスタでこれらを検証する場合、次のような課題が発生します。
- リスクの高さ:誤った設定や実験的なプラグインが本番環境に影響を与える可能性
- 再現性の難しさ:クラスタの状態や負荷を完全に再現するのは困難
- 時間とコスト:クラスタ構築やPodデプロイに時間がかかり、検証サイクルが遅くなる
こうした課題を解決するために、シミュレーション環境でスケジューリングを試せる仕組みが求められます。「kube-scheduler-simulator」は、まさにこのニーズに応えるOSSです。kube-scheduler-simulatorを活用するメリットとしては以下のような点が挙げられます。
- 安全な検証環境
- 実際のクラスタを汚さずに、スケジューリングの挙動を試せるため、リスクを最小化できます
- 開発・検証サイクルの短縮
- ラップトップレベルのマシンとdockerがあれば動作するため、容易に開発者個人ごとのシミュレーション環境を持つことができます
- 実際のクラスタ構築やPodデプロイを待つことなく、スケジューリング結果を即座に確認できるため、開発・検証サイクルが大幅に短縮されます
- カスタムスケジューラやプラグインのテストに最適
- Kubernetes Scheduler Frameworkに基づくプラグインの挙動を簡単に再現・比較でき、アルゴリズムの改善や最適化に役立ちます
- 教育・トレーニング用途にも有効
- スケジューリングの仕組みを学ぶ教材として活用でき、k8sの理解を深める場面で重宝します
アーキテクチャと仕組み
kube-scheduler-simulatorは、k8sのスケジューラを模倣するシミュレーション環境を提供します。主な構成要素は以下の通りです。
- Simulator Core
- Kubernetesのスケジューリングロジックを再現し、Podとノードの情報をもとにスケジューリング結果を計算します
- コンポーネント名:simulator-scheduler
- Web UI
- ユーザーがPodやノードの状態を操作し、スケジューリング結果を視覚的に確認できるインターフェース
- コンポーネント名:simulator-frontend、simulator-server
- API Server (Mock)
- シミュレータはdebuggable-scheduler、etcd、controller-manager、kube-apiserverを外部で起動する必要があります
- デフォルトでは KWOK (Kubernetes WithOut Kubelet)と呼ばれるk8sシミュレーターが稼働します
- コンポーネント名:simulator-cluster
この仕組みにより、実際のクラスタを構築することなく、スケジューリングのアルゴリズムやポリシーを試すことができます。
ハンズオン
お勉強はこのくらいにして早速実機で動かしてみます。
筆者の環境はこんな感じです。
ポイントとしては、筆者は赤い帽子が好きなのでOSはRocky Linuxとしており、コンテナはDockerではなくPodmanで稼働しています。
-
ハード
- AWS EC2インスタンス:m6a.large
-
OS
- Rocky Linux 9.6
-
コンテナ
- podman使用。
- 筆者はdockerも好きなのでdockerコマンドも叩けるようpodman-dockerも導入。
- kube-scheduler-simulatorはdocker compose用資材が含まれるためpodman-composeも導入。
- kube-scheduler-simulatorはdocker.sockを使用するためpodman-remoteも導入。
- まとめると、導入パッケージは以下のとおり。
- podman-5.4.0-13.el9_6.x86_64
- podman-plugins-5.4.0-13.el9_6.x86_64
- podman-docker-5.4.0-13.el9_6.noarch
- podman-compose-1.5.0-2.el9.noarch
- podman-remote-5.4.0-13.el9_6.x86_64
Podmanインストール
以下コマンドで、Podman関連のパッケージをインストールします。
$ sudo dnf install podman podman-plugins podman-docker podman-compose podman-remote
kube-scheduler-simulatorはdocker.sockを使用するため、それに相当するpodman.sockを有効化します。
$ systemctl --user enable --now podman.socket

## 以下のようにpodman.sockが作成され、docker.sockからのシンボリックリンクが張られる。
$ ls -l /run/user/$(id -u)/docker.sock
lrwxrwxrwx. 1 rocky rocky 33 11月  5 11:20 /run/user/1000/docker.sock -> /run/user/1000/podman/podman.sock
kube-scheduler-simulatorダウンロード
以下コマンドでkube-scheduler-simulatorをダウンロードします。
$ git clone https://github.com/kubernetes-sigs/kube-scheduler-simulator.git
$ cd kube-scheduler-simulator
筆者は2025/11時点での最新リリースである v0.4.0 を使用しました。
ただし、compose.ymlだけはコミットbc586b66にて修正されたものに置き換えました。
$ git switch --detach simulator/v0.4.0
$ git restore --source bc586b66 compose.yml
ここで、kube-scheduler-simulatorに含まれるcompose.ymlに以下の修正を行います。
- 各コンテナのvolumes:の定義に":z"を追記
- SELinux対応のため
- init-containerのcommandに"sleep inf"を追記
- podman-composeはdepends_onで指定されているコンテナが終了してしまうと待ってしまうため。
- simulator-clusterのimageを最新のものに書き換え
- 2025/11時点で最新は registry.k8s.io/kwok/cluster:v0.7.0-k8s.v1.33.0
- 「/var/run/docker.sock」はpodman-remoteが作成する「/run/user/<UID>/docker.sock」に書き換え
- simulator-clusterのenvironment:をKWOK_KUBE_APISERVER_INSECURE_PORTに書き換える
- 最新のKWOKでの設定値に合わせ書き換える
以下に書き換え前後のdiffを掲載します。
--- compose.yml.org     2025-11-05 11:38:29.876437022 +0900
+++ compose.yml 2025-11-05 14:34:51.210813916 +0900
@@ -4,16 +4,16 @@
   init-container:
       image: busybox
       volumes:
-        - conf:/config
-        - ${PWD}/simulator/cmd/scheduler:/host-config:ro
-      command: sh -c "cp -rf /host-config/* /config/"
+        - conf:/config:z
+        - ${PWD}/simulator/cmd/scheduler:/host-config:ro,z
+      command: sh -c "cp -rf /host-config/* /config/; sleep inf"
   simulator-scheduler:
     image: registry.k8s.io/scheduler-simulator/debuggable-scheduler:v0.4.0
     container_name: simulator-scheduler
     environment:
       - KUBECONFIG=/config/kubeconfig.yaml
     volumes:
-      - conf:/config
+      - conf:/config:z
     depends_on:
       - init-container
       - simulator-cluster
@@ -25,9 +25,9 @@
     image: registry.k8s.io/scheduler-simulator/simulator-backend:v0.4.0
     container_name: simulator-server
     volumes:
-      - ./simulator/config.yaml:/config.yaml
-      - ./simulator/kubeconfig.yaml:/kubeconfig.yaml
-      - /var/run/docker.sock:/var/run/docker.sock
+      - ./simulator/config.yaml:/config.yaml:z
+      - ./simulator/kubeconfig.yaml:/kubeconfig.yaml:z
+      - /run/user/1000/docker.sock:/var/run/docker.sock:z
       - conf:/config
     environment:
       - PORT=1212
@@ -51,16 +51,16 @@
     - "3000:3000"
     tty: true
   simulator-cluster:
-    image: registry.k8s.io/kwok/cluster:v0.6.0-k8s.v1.30.2
+    image: registry.k8s.io/kwok/cluster:v0.7.0-k8s.v1.33.0
     container_name: simulator-cluster
     restart: always
     ports:
       - "3131:3131"
     volumes:
-      - simulator-etcd-data:/var/lib/etcd
-      - ./kwok.yaml:/root/.kwok/kwok.yaml
+      - simulator-etcd-data:/var/lib/etcd:z
+      - ./kwok.yaml:/root/.kwok/kwok.yaml:z
     environment:
-      - KWOK_KUBE_APISERVER_PORT=3131
+      - KWOK_KUBE_APISERVER_INSECURE_PORT=3131
     networks:
       - simulator-internal-network
 networks:
修正後のcompose.yml全文も掲載しておきます。docker.sockのパスに筆者環境のUID(1000)がハードコードされている点に留意してください。
修正後のcompose.yml全文
services:
  # This container copies the data,
  # so any changes made to the configuration files within the Pod will not affect the original files.
  init-container:
      image: busybox
      volumes:
        - conf:/config:z
        - ${PWD}/simulator/cmd/scheduler:/host-config:ro,z
      command: sh -c "cp -rf /host-config/* /config/; sleep inf"
  simulator-scheduler:
    image: registry.k8s.io/scheduler-simulator/debuggable-scheduler:v0.4.0
    container_name: simulator-scheduler
    environment:
      - KUBECONFIG=/config/kubeconfig.yaml
    volumes:
      - conf:/config:z
    depends_on:
      - init-container
      - simulator-cluster
    restart: always
    tty: true
    networks:
      - simulator-internal-network
  simulator-server:
    image: registry.k8s.io/scheduler-simulator/simulator-backend:v0.4.0
    container_name: simulator-server
    volumes:
      - ./simulator/config.yaml:/config.yaml:z
      - ./simulator/kubeconfig.yaml:/kubeconfig.yaml:z
      - /run/user/1000/docker.sock:/var/run/docker.sock:z
      - conf:/config
    environment:
      - PORT=1212
      - KUBE_SCHEDULER_SIMULATOR_ETCD_URL=http://simulator-cluster:2379
      - KUBE_APISERVER_URL=http://simulator-cluster:3131
    ports:
      - "1212:1212"
    restart: always
    tty: true
    networks:
      - simulator-internal-network
  simulator-frontend:
    image: registry.k8s.io/scheduler-simulator/simulator-frontend:v0.4.0
    restart: always
    container_name: simulator-frontend
    environment:
      - HOST=0.0.0.0
      - BASE_URL=http://${SIMULATOR_EXTERNAL_IP:-localhost}:1212
      - KUBE_API_SERVER_URL=http://${SIMULATOR_EXTERNAL_IP:-localhost}:3131
    ports:
    - "3000:3000"
    tty: true
  simulator-cluster:
    image: registry.k8s.io/kwok/cluster:v0.7.0-k8s.v1.33.0
    container_name: simulator-cluster
    restart: always
    ports:
      - "3131:3131"
    volumes:
      - simulator-etcd-data:/var/lib/etcd:z
      - ./kwok.yaml:/root/.kwok/kwok.yaml:z
    environment:
      - KWOK_KUBE_APISERVER_INSECURE_PORT=3131
    networks:
      - simulator-internal-network
networks:
  simulator-internal-network:
    driver: bridge
volumes:
  simulator-etcd-data:
  conf:
compose.ymlを編集したら、podman-composeでkube-scheduler-simulatorのコンテナを起動します。
$ podman-compose up -d
以下の名前のコンテナがそれぞれ起動します。
それぞれの役割は以下の通りです。
- kube-scheduler-simulator_init-container_1
- 設定ファイルをvolumeにコピーするだけの初期化用コンテナ
- simulator-server
- simulator-frontendと共にWeb UIを提供する
- simulator-frontend
- simulator-serverと共にWeb UIを提供する
- simulator-cluster
- KWOK(Kubernetes WithOut Kubelet)と呼ばれるk8sシミュレーター
- simulator-scheduler
- k8sのスケジューリングロジックを再現するコンポーネント(kube-scheduler-simulatorのコア機能)
$ podman ps
CONTAINER ID  IMAGE                                                            COMMAND               CREATED         STATUS         PORTS                             NAMES
0f42fa51be9f  docker.io/library/busybox:latest                                 sh -c cp -rf /hos...  28 minutes ago  Up 28 minutes                                    kube-scheduler-simulator_init-container_1
c0acba14fc43  registry.k8s.io/scheduler-simulator/simulator-backend:v0.4.0     /simulator            28 minutes ago  Up 28 minutes  0.0.0.0:1212->1212/tcp            simulator-server
19e5e7841d27  registry.k8s.io/scheduler-simulator/simulator-frontend:v0.4.0    yarn start            28 minutes ago  Up 28 minutes  0.0.0.0:3000->3000/tcp            simulator-frontend
644911c6ed82  registry.k8s.io/kwok/cluster:v0.7.0-k8s.v1.33.0                                        28 minutes ago  Up 28 minutes  0.0.0.0:3131->3131/tcp, 8080/tcp  simulator-cluster
7cca37a11aca  registry.k8s.io/scheduler-simulator/debuggable-scheduler:v0.4.0  /scheduler --conf...  28 minutes ago  Up 28 minutes                                    simulator-scheduler
simulator-clusterコンテナの3131ポートがこのシミュレーターのAPI Serverになります。
以下コマンドで、kubectlのコンテキストを追加することで、kubectlコマンドにより操作することができるようになります。
## "kwok"という名前でクラスタを定義(名前は任意)
$ kubectl config set-cluster kwok --server=http://127.0.0.1:3131

## "kwok"という名前でコンテキストを定義(名前は任意)
$ kubectl config set-context kwok --cluster kwok

## 作成したコンテキスト"kwok"を使用する
$ kubectl config use-context kwok

## kubectlを叩いてみる(以下はネームスペースを一覧)
$ kubectl get ns
NAME              STATUS   AGE
default           Active   21s
kube-node-lease   Active   21s
kube-public       Active   21s
kube-system       Active   21s
なお、初期起動時点ではネームスペースはある程度存在しますが、NodeやPodは全くありません。
$ kubectl get node
No resources found

$ kubectl get pod -A
No resources found
というわけで、まずはNodeを定義する必要があります。
例えば以下のような形式のマニフェストで定義します。
ポイントは各Nodeにスケジューリングの判断材料となるリソース量(capacity:)や配置先(labels:のregionやzone)、状態(conditions:)などをシミュレーションしたい環境に合わせ正確に再現することです。
labels:に関してはよく知られたもの(Well-Known)がこちらに一覧されているのでご参考ください(以下例のものも掲載されています)。
conditions:に関しては各値の意味がこちらに一覧されています。
---
apiVersion: v1
kind: Node
metadata:
  labels:
    node.kubernetes.io/instance-type: c6i.4xlarge
    beta.kubernetes.io/instance-type: c6i.4xlarge
    beta.kubernetes.io/arch: amd64
    beta.kubernetes.io/os: linux
    kubernetes.io/arch: amd64
    kubernetes.io/os: linux
    kubernetes.io/hostname: node-a-001
    failure-domain.beta.kubernetes.io/region: ap-northeast-1
    failure-domain.beta.kubernetes.io/zone: ap-northeast-1a
    topology.ebs.csi.aws.com/zone: ap-northeast-1a
    topology.kubernetes.io/zone: ap-northeast-1a
    topology.kubernetes.io/region: ap-northeast-1
  name: node-a-001
spec: {}
status:
  capacity:
    cpu: "16"
    memory: 32768Mi
    ephemeral-storage: 83808236Ki
    hugepages-1Gi: "0"
    hugepages-2Mi: "0"
    pods: "110"
  conditions:
  - type: KernelReady
    status: "True"
  - type: ContainerRuntimeReady
    status: "True"
  - type: StorageReady
    status: "True"
  - type: NetworkingReady
    status: "True"
  - type: Ready
    status: "True"
  - type: MemoryPressure
    status: "False"
  - type: DiskPressure
    status: "False"
  - type: PIDPressure
    status: "False"
筆者は以下のようなNodeマニフェストを生成するスクリプトを作成し、合計300台のNodeをシミュレーションしました。(本物なら予算的に難しい巨大構成も、シミュレーションなので気軽に試せます!)
これを流用してもかまいませんし、実際にシミュレーションしたい環境のkubectl get node -o yamlを使用しても良いでしょう。
Node生成スクリプト
#!/bin/bash

## 各ノード名に付与する接頭語
HEADER="node"

## 各ゾーンに生成するノード数(ここに指定の数 × ゾーン数 のノードが生成される)
NODES=100

## リージョン
REGION=ap-northeast-1

## アベイラビリティゾーンの指定
### リージョンの末尾に付与する文字で指定する
### ap-northeast-1の場合、a, b, cではなく、a, c, dであることに留意すること
ZONES="a c d"

## 各ノードのタイプおよびリソース量
### 以下はc6i.4xlargeの場合の値を定義済み
TYPE=c6i.4xlarge
CPU=16
MEM=32768
STORAGE=83808236
PODS=110

OUT=dummy-${HEADER}-${NODES}.yaml

echo -n > ${OUT}

for z in $ZONES
do
        for n in $( seq 1 $NODES )
        do
                echo "gen node $n in ${REGION}${z} ..."
                cat << EOF >> ${OUT}
---
apiVersion: v1
kind: Node
metadata:
  labels:
    node.kubernetes.io/instance-type: ${TYPE}
    beta.kubernetes.io/instance-type: ${TYPE}
    beta.kubernetes.io/arch: amd64
    beta.kubernetes.io/os: linux
    kubernetes.io/arch: amd64
    kubernetes.io/os: linux
    kubernetes.io/hostname: ${HEADER}-${z}-$( printf %03d ${n} )
    failure-domain.beta.kubernetes.io/region: ${REGION}
    failure-domain.beta.kubernetes.io/zone: ${REGION}${z}
    topology.ebs.csi.aws.com/zone: ${REGION}${z}
    topology.kubernetes.io/zone: ${REGION}${z}
    topology.kubernetes.io/region: ${REGION}
  name: ${HEADER}-${z}-$( printf %03d ${n} )
spec: {}
status:
  capacity:
    cpu: "${CPU}"
    memory: ${MEM}Mi
    ephemeral-storage: ${STORAGE}Ki
    hugepages-1Gi: "0"
    hugepages-2Mi: "0"
    pods: "${PODS}"
  conditions:
  - type: KernelReady
    status: "True"
  - type: ContainerRuntimeReady
    status: "True"
  - type: StorageReady
    status: "True"
  - type: NetworkingReady
    status: "True"
  - type: Ready
    status: "True"
  - type: MemoryPressure
    status: "False"
  - type: DiskPressure
    status: "False"
  - type: PIDPressure
    status: "False"
EOF
        done
done
上記スクリプトや、実際の環境等からのNodeマニフェストをapplyし、Nodeが"Ready"になることを確認します。
$ kubectl apply -f dummy-node-100.yaml

$ kubectl get node
NAME         STATUS   ROLES    AGE   VERSION
node-a-001   Ready    <none>   12s
node-a-002   Ready    <none>   12s
node-a-003   Ready    <none>   12s
node-a-004   Ready    <none>   12s
node-a-005   Ready    <none>   12s
・・・略・・・
node-d-095   Ready    <none>   7s
node-d-096   Ready    <none>   7s
node-d-097   Ready    <none>   7s
node-d-098   Ready    <none>   7s
node-d-099   Ready    <none>   7s
node-d-100   Ready    <none>   7s
ここで、http://<コンテナ起動のホスト>:3000/にブラウザでアクセスするとこのk8sの状態をGUIで確認できます。
Nodeをデプロイした段階では以下のように表示されます。
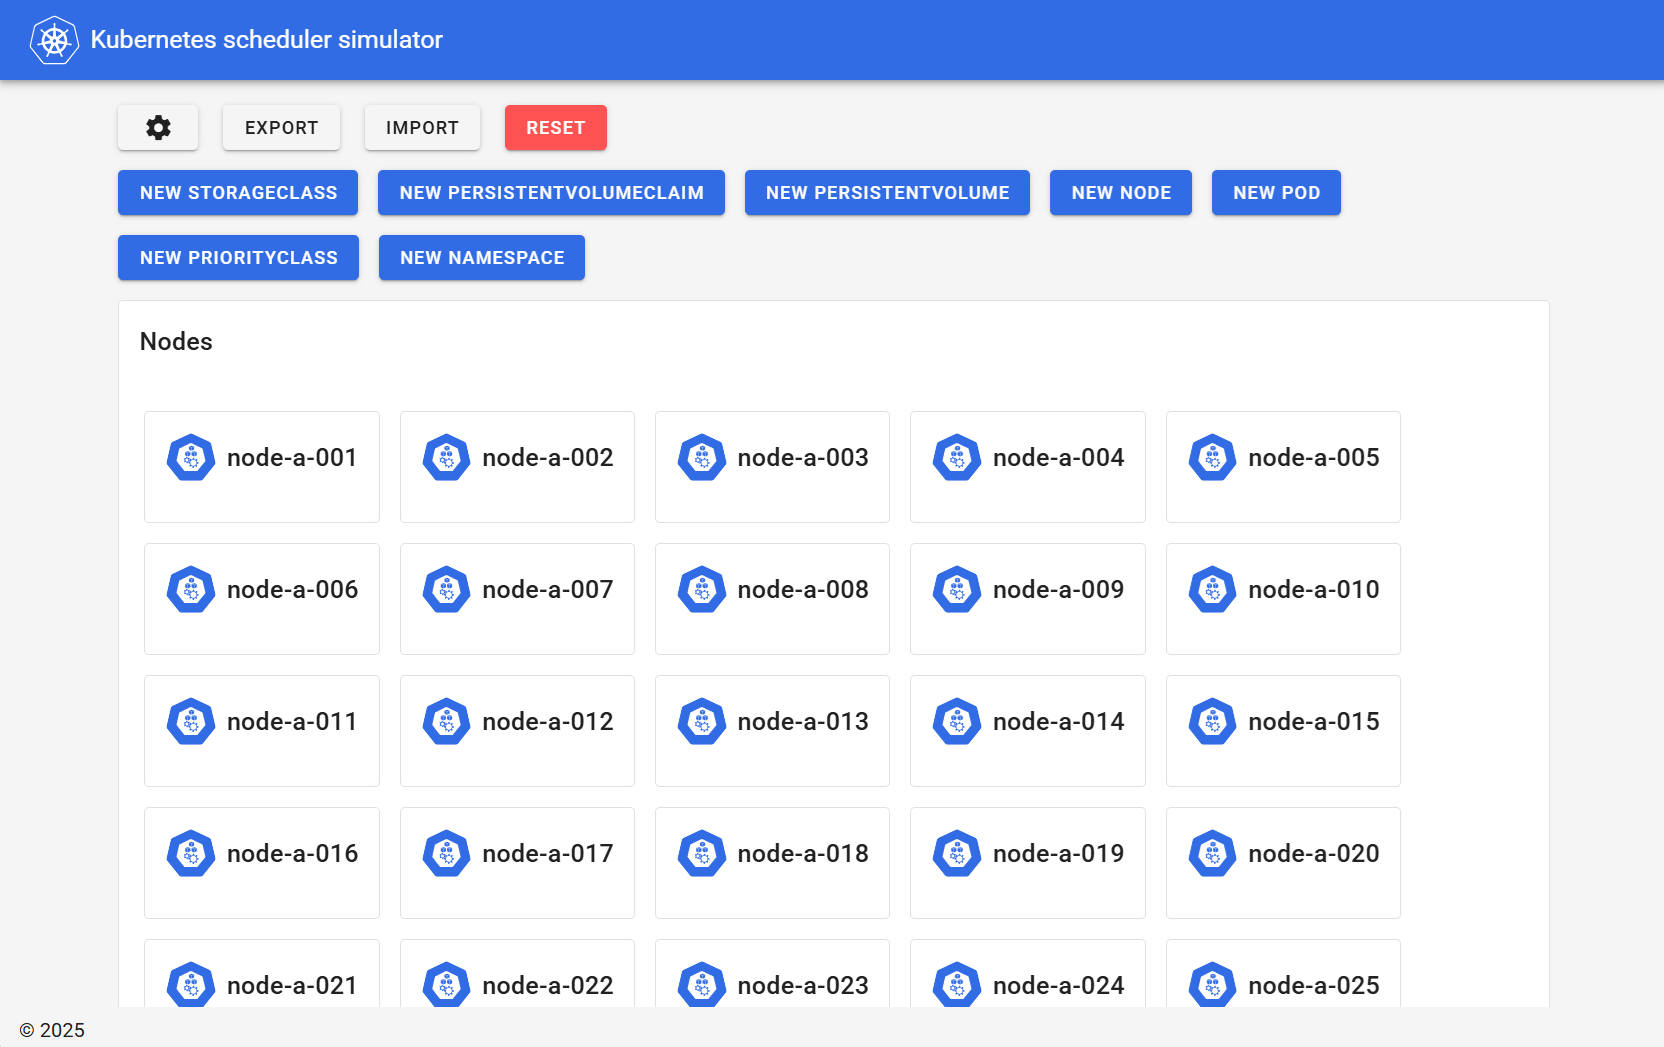
出典:Kubernetes SIGs, kube-scheduler-simulator Web UI(筆者ローカル環境/スクリーンショット取得日:2025年11月26日)
ここで、kube-scheduler-simulatorを停止する方法を紹介しておきます。
以下コマンドを実行すると停止します。podman-compose downに"--volumes"を付与することで、Volumeも削除され、まっさらの状態に戻すことができます。
もし、後で同じ構成でシミュレーションを再開したい場合は"--volumes"を付与しないようにしてください。
## compose.ymlがあるディレクトリに移動
$ cd kube-scheduler-simulator

## コンテナ停止
$ podman-compose down --volumes
シミュレーションの実行
ここからは、実際にPodマニフェストを作成・デプロイし、代表的なスケジューリング機能の挙動を確認していきます。
nodeSelector
以下マニフェストでnodeSelectorを指定したDeploymentをデプロイしてみます。
「kubernetes.io/hostname」ラベル(=ノード名)が"node-c-100"であるNodeでの起動を指定しています。
---
apiVersion: apps/v1
kind: Deployment
metadata:
  labels:
    app: nodeselector
  name: nodeselector
spec:
  replicas: 10
  selector:
    matchLabels:
      app: nodeselector
  template:
    metadata:
      labels:
        app: nodeselector
    spec:
      nodeSelector:
        kubernetes.io/hostname: node-c-100
      containers:
      - name: test
        image: debian:12-slim
$ kubectl apply -f nodeSelector.yaml
deployment.apps/nodeselector created

$ kubectl get pod -o wide
NAME                           READY   STATUS    RESTARTS   AGE     IP          NODE         NOMINATED NODE   READINESS GATES
nodeselector-7f795f9fc-2d5h7   1/1     Running   0          3s      10.0.0.11   node-c-100   <none>           <none>
nodeselector-7f795f9fc-679ht   1/1     Running   0          3s      10.0.0.9    node-c-100   <none>           <none>
nodeselector-7f795f9fc-6jljz   1/1     Running   0          4s      10.0.0.5    node-c-100   <none>           <none>
nodeselector-7f795f9fc-78kl6   1/1     Running   0          4s      10.0.0.3    node-c-100   <none>           <none>
nodeselector-7f795f9fc-8km49   1/1     Running   0          3s      10.0.0.6    node-c-100   <none>           <none>
nodeselector-7f795f9fc-8t2sk   1/1     Running   0          4s      10.0.0.4    node-c-100   <none>           <none>
nodeselector-7f795f9fc-dsbdj   1/1     Running   0          3s      10.0.0.7    node-c-100   <none>           <none>
nodeselector-7f795f9fc-hcm2q   1/1     Running   0          3s      10.0.0.10   node-c-100   <none>           <none>
nodeselector-7f795f9fc-hf2lk   1/1     Running   0          3s      10.0.0.8    node-c-100   <none>           <none>
nodeselector-7f795f9fc-m6clw   1/1     Running   0          3s      10.0.0.2    node-c-100   <none>           <none>
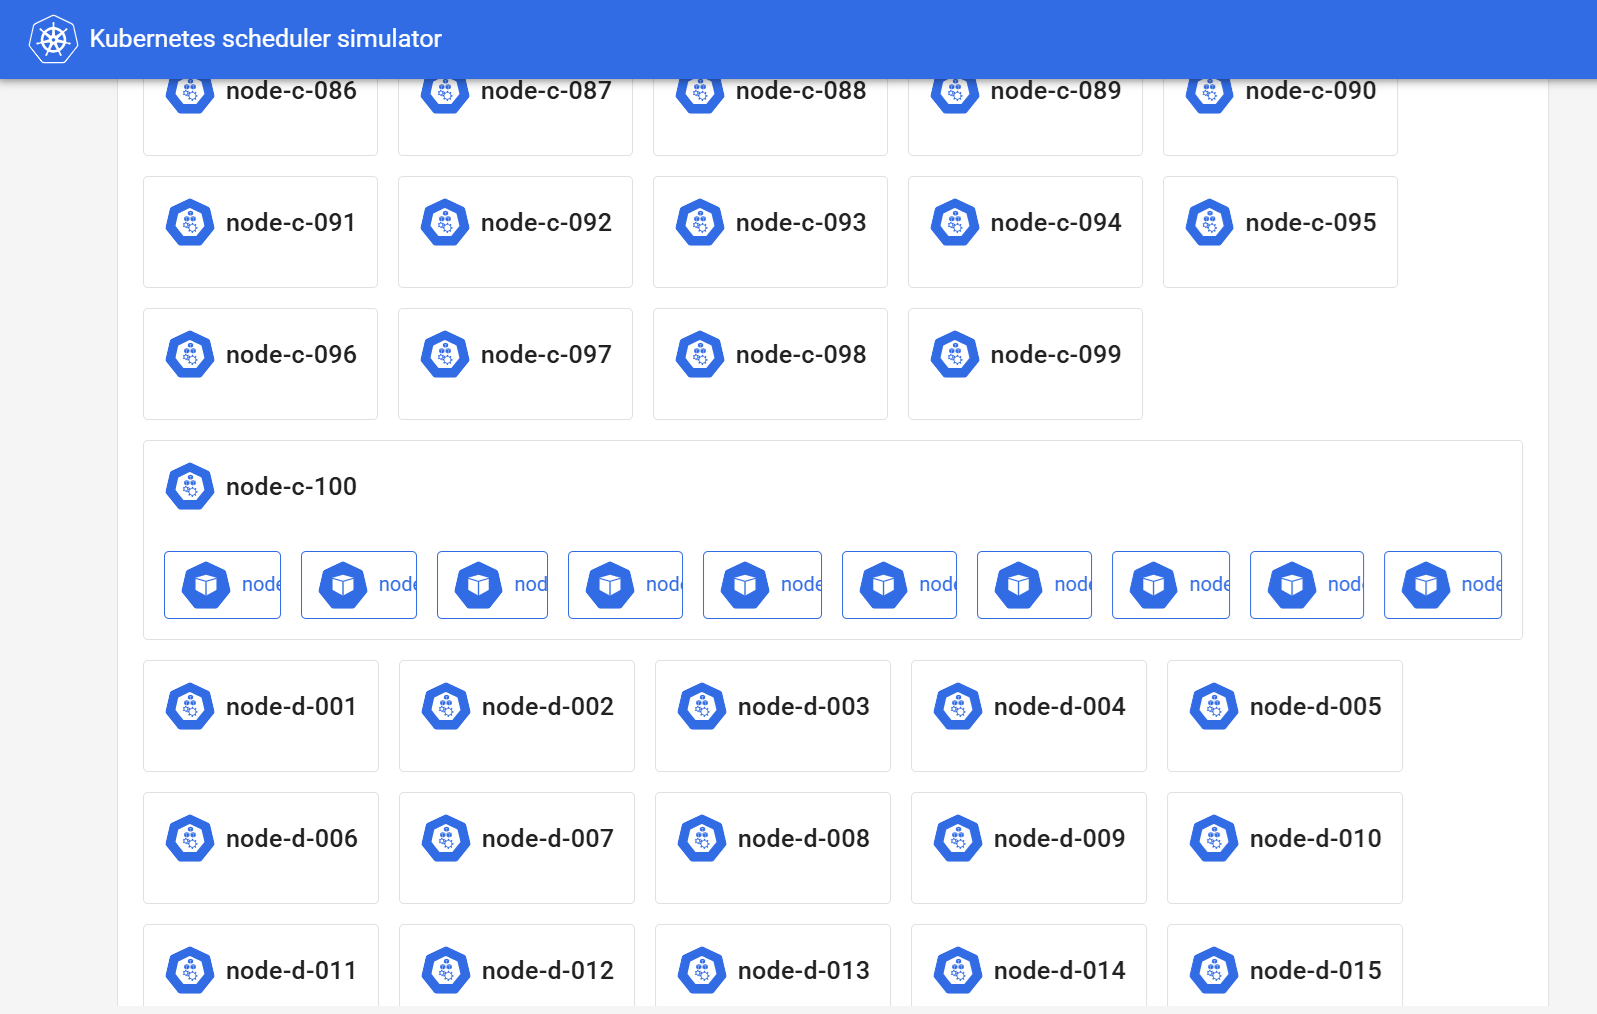
(Nodeが300台あるにも関わらず)10個のPod全てがnode-c-100で起動しました。
GUIでは以下のように見えます。
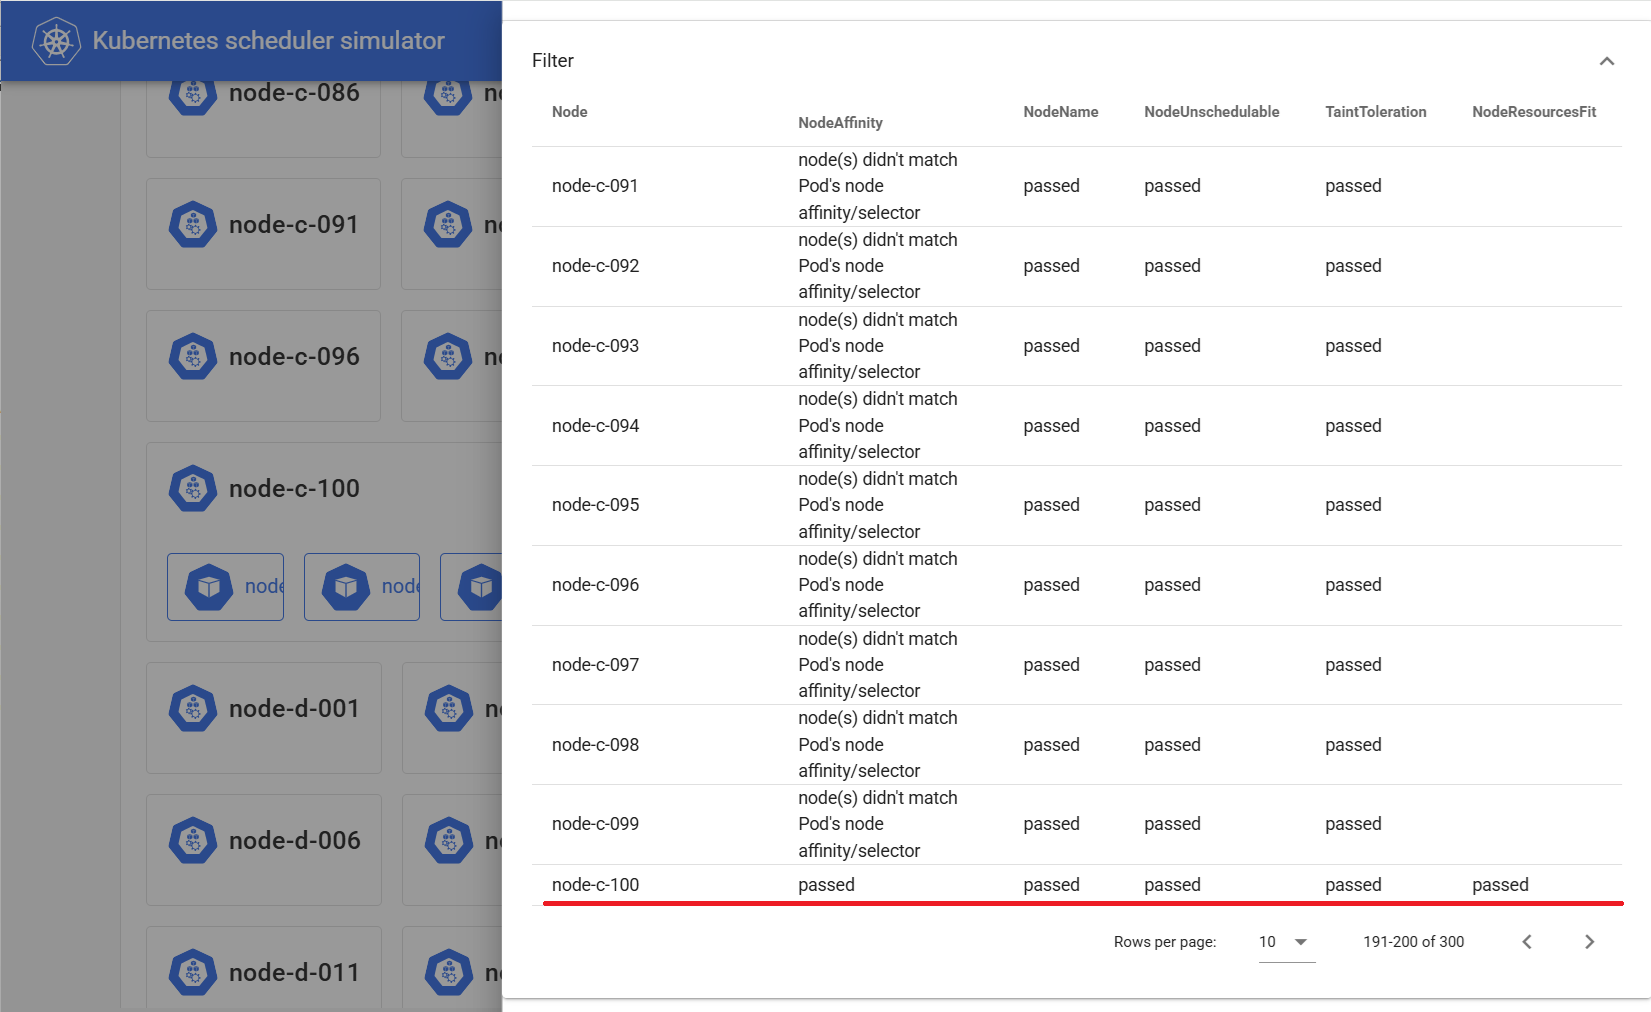
GUIでPodアイコンをクリックするとその詳細が表示され、ここにスケジューラの挙動も反映されます。
nodeSelectorの場合、"Filter"というセクションにある"NodeAffinity"欄に、"node-c-100"以外には"node(s) didn't match Pod's node affinity/selector"と表示され、"node-c-100"以外へのスケジューリングは許可されなかった様子がわかります。
スケジューラの挙動は実は各Podのannotationに反映されています(上記GUIはそれを読み取っている)。
以下コマンドでPodのannotationの"kube-scheduler-simulator.sigs.k8s.io/filter-result"を表示すると先ほどと同様の内容が格納されています。
$ kubectl get pod nodeselector-7f795f9fc-8km49 -o json |jq -r '.metadata.annotations."kube-scheduler-simulator.sigs.k8s.io/filter-result" | fromjson'
・・・略・・・
  "node-c-097": {
    "NodeAffinity": "node(s) didn't match Pod's node affinity/selector",
    "NodeName": "passed",
    "NodeUnschedulable": "passed",
    "TaintToleration": "passed"
  },
  "node-c-098": {
    "NodeAffinity": "node(s) didn't match Pod's node affinity/selector",
    "NodeName": "passed",
    "NodeUnschedulable": "passed",
    "TaintToleration": "passed"
  },
  "node-c-099": {
    "NodeAffinity": "node(s) didn't match Pod's node affinity/selector",
    "NodeName": "passed",
    "NodeUnschedulable": "passed",
    "TaintToleration": "passed"
  },
  "node-c-100": {
    "NodeAffinity": "passed",  ##★このノードだけ"passed"
    "NodeName": "passed",
    "NodeResourcesFit": "passed",
    "NodeUnschedulable": "passed",
    "TaintToleration": "passed"
  },
・・・略・・・
なお、kube-scheduler-simulatorによって付与されるannotationは以下のようにたくさんあります。これらは概ねk8sスケジューラの動作サイクルの各箇所の動作結果に該当します。
これらを順に確認していくと、スケジューラが各箇所でどのような判断を下したのかを追うことができます。
$ kubectl get pod nodeselector-7f795f9fc-8km49 -o json |jq -r '.metadata.annotations | keys[]'
kube-scheduler-simulator.sigs.k8s.io/prefilter-result
kube-scheduler-simulator.sigs.k8s.io/prefilter-result-status
kube-scheduler-simulator.sigs.k8s.io/filter-result
kube-scheduler-simulator.sigs.k8s.io/postfilter-result
kube-scheduler-simulator.sigs.k8s.io/prescore-result
kube-scheduler-simulator.sigs.k8s.io/score-result
kube-scheduler-simulator.sigs.k8s.io/finalscore-result
kube-scheduler-simulator.sigs.k8s.io/reserve-result
kube-scheduler-simulator.sigs.k8s.io/permit-result
kube-scheduler-simulator.sigs.k8s.io/permit-result-timeout
kube-scheduler-simulator.sigs.k8s.io/prebind-result
kube-scheduler-simulator.sigs.k8s.io/bind-result
kube-scheduler-simulator.sigs.k8s.io/selected-node
kube-scheduler-simulator.sigs.k8s.io/result-history
## 上記の表示順はk8sスケジューラの動作サイクルの順番に合わせ並べ替えています。##
topologySpreadConstraints
次に以下マニフェストでtopologySpreadConstraintsを指定したDeploymentをデプロイしてみます。
"zone"と"host"の両者をtopologyKeyとし、maxSkewは1としているため、150個のPodが全て異なるNodeでかつ各AZに均等に分散して配置されるはずです。
---
apiVersion: apps/v1
kind: Deployment
metadata:
  labels:
    app: app1
  name: app1
spec:
  replicas: 150
  selector:
    matchLabels:
      app: app1
  template:
    metadata:
      labels:
        app: app1
    spec:
      topologySpreadConstraints:
      - maxSkew: 1
        topologyKey: topology.kubernetes.io/zone
        whenUnsatisfiable: DoNotSchedule
        labelSelector:
          matchLabels:
            app: app1
      - maxSkew: 1
        topologyKey: kubernetes.io/hostname
        whenUnsatisfiable: DoNotSchedule
        labelSelector:
          matchLabels:
            app: app1
      containers:
      - name: test
        image: debian:12-slim
デプロイし、各Podの起動ノードを一覧し数をカウントすると全Podが分散配置されたことが確認できます。
## お掃除(これまでの全Deployment削除)
$ kubectl delete deployment -A --all

## デプロイ
$ kubectl apply -f app1.yaml

## 起動したPod数を確認
$ kubectl get pod -o json | jq -r '.items[] | select( .status.phase == "Running" ) | .metadata.name' | wc -l
150

## 各Podの起動ノードを一覧し数をカウント
$ kubectl get pod -o json | jq -r '.items[] | select( .status.phase == "Running" ) | .spec.nodeName' | sort| uniq -c
      1 node-a-001
      1 node-a-002
      1 node-a-006
      1 node-a-008
      1 node-a-009
・・・略・・・
      1 node-d-089
      1 node-d-091
      1 node-d-092
      1 node-d-095
      1 node-d-096
      1 node-d-098
→全て"1"となり、全Podが分散配置されたことが確認できる

## 各Podの起動ノードのAZ(a, c, d)をカウント
$ kubectl get pod -o json | jq -r '.items[] | select( .status.phase == "Running" ) | .spec.nodeName' | cut -d "-" -f 2| sort| uniq -c
     50 a
     50 c
     50 d
→各AZに50個ずつ均等に配置されている
この場合もアノテーション"filter-result"に、ポイントとなる判断が記載されています。
以下のように"PodTopologySpread"欄が"node(s) didn't match pod topology spread constraints"となっているノードがあったことがわかります。
これらノードはすでに他Podが起動しているためこのPodの配置先としては除外されます。
この動作を全Podで繰り返すことで、全Podを分散配置することができました。
$ kubectl get pod app1-9d59c89f8-v6cfh -o wide
NAME                   READY   STATUS    RESTARTS   AGE   IP          NODE         NOMINATED NODE   READINESS GATES
app1-9d59c89f8-v6cfh   1/1     Running   0          67s   10.0.0.77   node-d-051   <none>           <none>

$ kubectl get pod app1-9d59c89f8-v6cfh -o json |jq -r '.metadata.annotations."kube-scheduler-simulator.sigs.k8s.io/filter-result" | fromjson'|grep -e node- -e PodTopologySpread
・・・略・・・
  "node-d-044": {
    "PodTopologySpread": "node(s) didn't match pod topology spread constraints",
  "node-d-045": {
    "PodTopologySpread": "passed",
  "node-d-046": {
    "PodTopologySpread": "passed",
  "node-d-047": {
    "PodTopologySpread": "passed",
  "node-d-048": {
    "PodTopologySpread": "node(s) didn't match pod topology spread constraints",
  "node-d-049": {
    "PodTopologySpread": "passed",
  "node-d-050": {
    "PodTopologySpread": "passed",
  "node-d-051": {
    "PodTopologySpread": "passed",
  "node-d-052": {
    "PodTopologySpread": "passed",
  "node-d-053": {
    "PodTopologySpread": "passed",
  "node-d-054": {
    "PodTopologySpread": "passed",
  "node-d-055": {
    "PodTopologySpread": "passed",
  "node-d-056": {
    "PodTopologySpread": "passed",
・・・略・・・
Affinity
続いて、以下マニフェストでAffinityを指定したDeploymentをデプロイしてみます。
ここではPod Affinity/Anti-affinityを使用し、先ほどデプロイしたapp1 Podと同じNodeにデプロイするPod「with」と、異なるNodeにデプロイするPod「without」をデプロイします。
topologySpreadConstraintsも併せて設定しているため、各Podは分散配置されるはずです。
---
apiVersion: apps/v1
kind: Deployment
metadata:
  labels:
    app: with
  name: with
  namespace: with
spec:
  replicas: 150
  selector:
    matchLabels:
      app: with
  template:
    metadata:
      labels:
        app: with
    spec:
      topologySpreadConstraints:
      - maxSkew: 1
        topologyKey: topology.kubernetes.io/zone
        whenUnsatisfiable: DoNotSchedule
        labelSelector:
          matchLabels:
            app: with
      - maxSkew: 1
        topologyKey: kubernetes.io/hostname
        whenUnsatisfiable: DoNotSchedule
        labelSelector:
          matchLabels:
            app: with
      affinity:
        podAffinity:
          requiredDuringSchedulingIgnoredDuringExecution:
          - labelSelector:
              matchExpressions:
              - key: app
                operator: In
                values:
                - app1
            topologyKey: kubernetes.io/hostname
            namespaces:
            - default
      containers:
      - name: with
        image: debian:12-slim
---
apiVersion: apps/v1
kind: Deployment
metadata:
  labels:
    app: without
  name: without
  namespace: without
spec:
  replicas: 150
  selector:
    matchLabels:
      app: without
  template:
    metadata:
      labels:
        app: without
    spec:
      topologySpreadConstraints:
      - maxSkew: 1
        topologyKey: topology.kubernetes.io/zone
        whenUnsatisfiable: DoNotSchedule
        labelSelector:
          matchLabels:
            app: without
      - maxSkew: 1
        topologyKey: kubernetes.io/hostname
        whenUnsatisfiable: DoNotSchedule
        labelSelector:
          matchLabels:
            app: without
      affinity:
        podAntiAffinity:
          requiredDuringSchedulingIgnoredDuringExecution:
          - labelSelector:
              matchExpressions:
              - key: app
                operator: In
                values:
                - app1
            topologyKey: kubernetes.io/hostname
            namespaces:
            - default
      containers:
      - name: without
        image: debian:12-slim
$ kubectl create namespace with
namespace/with created

$ kubectl create namespace without
namespace/without created

$ kubectl apply -f affinity.yaml
deployment.apps/with created
deployment.apps/without created
以下のように、app1とwithは同じNodeに、withoutは異なるNodeに配置され、かつ分散配置されています。
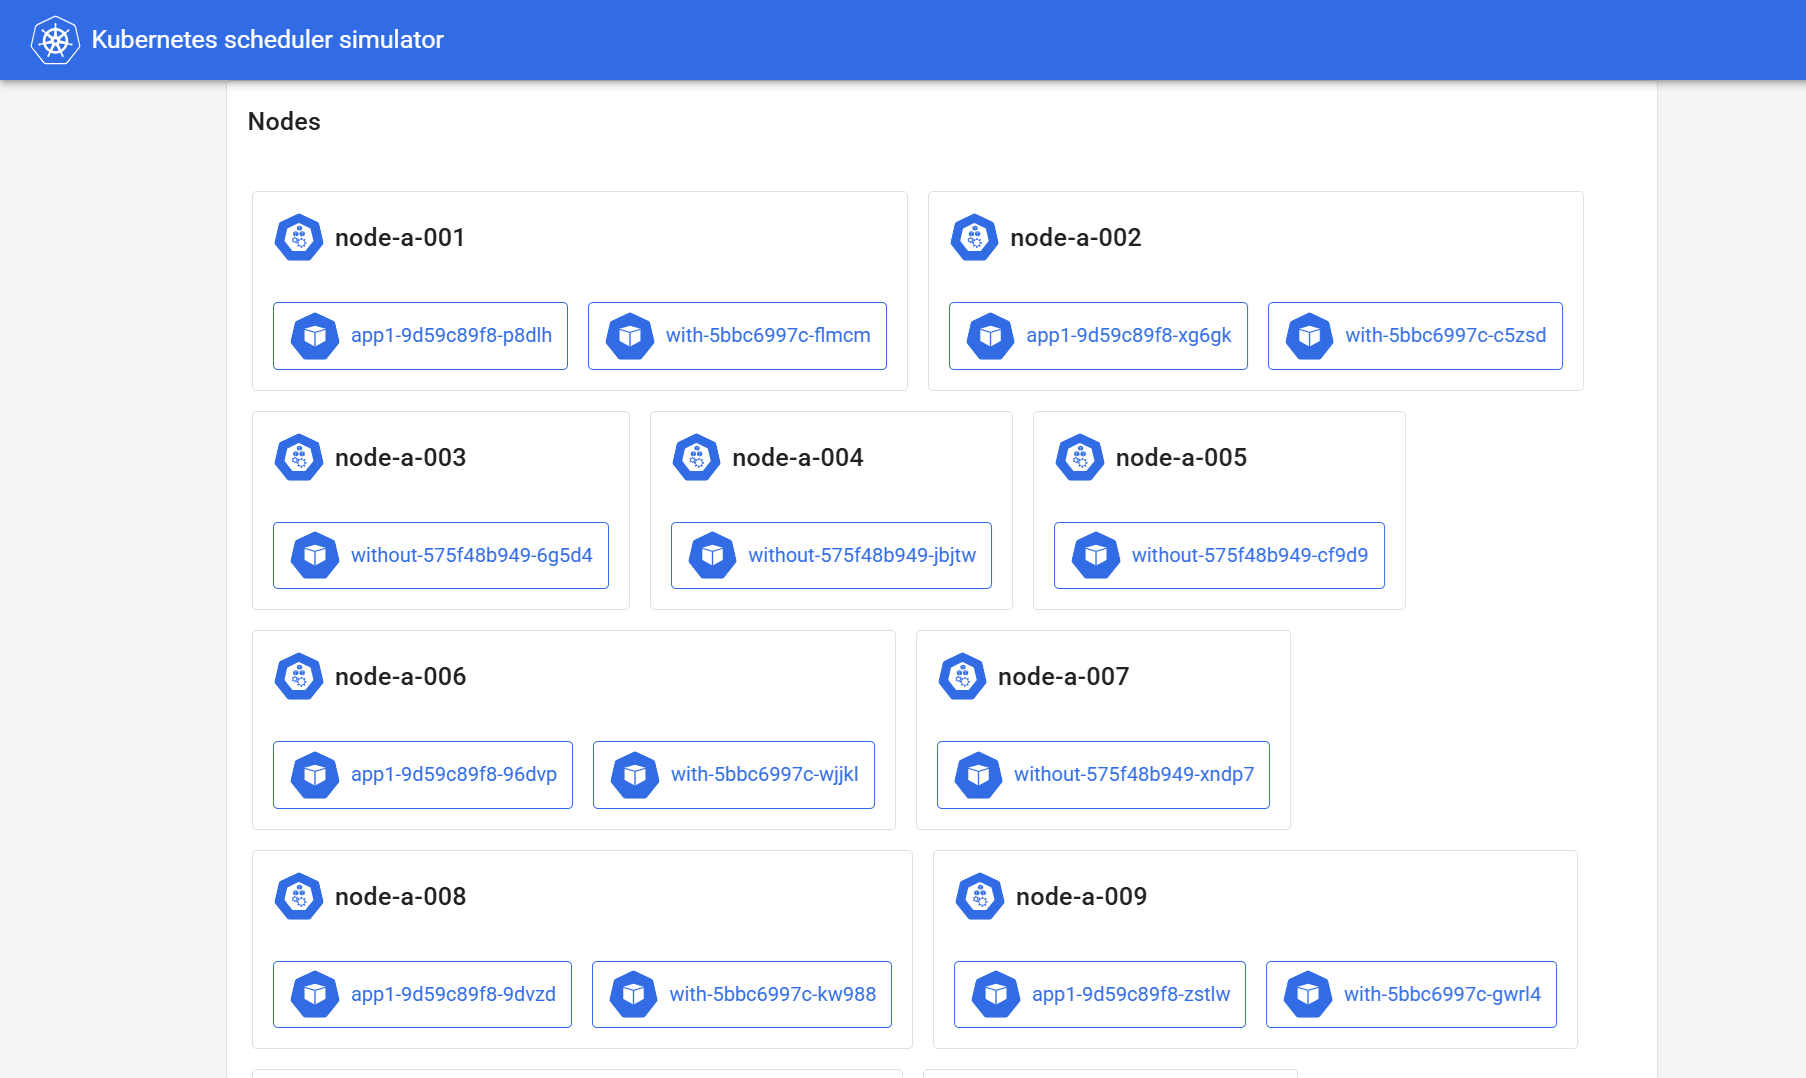
以下コマンドで、各ノードに配置されているPod名を列挙してみても、app1とwithが一緒に、withoutは独立して配置されていることを確認できます。
$ kubectl get pod -o json -A | jq -r '.items[] | select( .status.phase == "Running" ) | { name:.metadata.name, nodename:.spec.nodeName }' > /tmp/allpods.json
$ cat /tmp/allpods.json | jq -r '.nodename' | sort | uniq | while read node
  do
  	echo "## ${node}"
  	cat /tmp/allpods.json | jq -r "select( .nodename == \"${node}\" ) | .name"
  	echo
  done

## node-a-001
app1-9d59c89f8-p8dlh
with-5bbc6997c-flmcm

## node-a-002
app1-9d59c89f8-xg6gk
with-5bbc6997c-c5zsd

## node-a-003
without-575f48b949-6g5d4

## node-a-004
without-575f48b949-jbjtw

## node-a-005
without-575f48b949-cf9d9

## node-a-006
app1-9d59c89f8-96dvp
with-5bbc6997c-wjjkl

## node-a-007
without-575f48b949-xndp7

・・・略・・・

## node-d-095
app1-9d59c89f8-2dgrm
with-5bbc6997c-gm9j7

## node-d-096
app1-9d59c89f8-zgf8b
with-5bbc6997c-b486q

## node-d-097
without-575f48b949-9f7tr

## node-d-098
app1-9d59c89f8-tnrr6
with-5bbc6997c-fcqvt

## node-d-099
without-575f48b949-hfmj9

## node-d-100
without-575f48b949-pgbr7
AZ分散も均等に行われています。
$ kubectl get pod -n with -o json | jq -r '.items[] | select( .status.phase == "Running" ) | .spec.nodeName' | cut -d "-" -f 2| sort| uniq -c
     50 a
     50 c
     50 d

$ kubectl get pod -n without -o json | jq -r '.items[] | select( .status.phase == "Running" ) | .spec.nodeName' | cut -d "-" -f 2| sort| uniq -c
     50 a
     50 c
     50 d
この場合もアノテーション"filter-result"に、ポイントとなる判断が記載されています。
以下のように"PodTopologySpread"欄に加え、"InterPodAffinity"欄にも"node(s) didn't match pod affinity rules"となっているノードがあったことがわかります。
これらノードがこのPodの配置先としては除外されることでAffinityを満たすNodeを選択しています。
$ kubectl get pod with-5bbc6997c-fcqvt -n with -o json |jq -r '.metadata.annotations."kube-scheduler-simulator.sigs.k8s.io/filter-result" | fromjson'|grep -e node- -e PodTopologySpread -e Affinity
・・・略・・・
  "node-c-081": {
    "InterPodAffinity": "node(s) didn't match pod affinity rules",
    "PodTopologySpread": "passed",
  "node-c-082": {
    "PodTopologySpread": "node(s) didn't match pod topology spread constraints",
  "node-c-083": {
    "PodTopologySpread": "node(s) didn't match pod topology spread constraints",
  "node-c-084": {
    "InterPodAffinity": "node(s) didn't match pod affinity rules",
    "PodTopologySpread": "passed",
  "node-c-085": {
    "InterPodAffinity": "passed",
    "PodTopologySpread": "passed",
  "node-c-086": {
    "InterPodAffinity": "node(s) didn't match pod affinity rules",
    "PodTopologySpread": "passed",
  "node-c-087": {
    "InterPodAffinity": "node(s) didn't match pod affinity rules",
    "PodTopologySpread": "passed",
  "node-c-088": {
    "InterPodAffinity": "passed",
    "PodTopologySpread": "passed",
  "node-c-089": {
    "InterPodAffinity": "node(s) didn't match pod affinity rules",
    "PodTopologySpread": "passed",
  "node-c-090": {
    "InterPodAffinity": "node(s) didn't match pod affinity rules",
    "PodTopologySpread": "passed",
・・・略・・・
TaintとToleration
続いて、TaintとTolerationによるスケジューリングを試します。
まず、Nodeのうち051~100のものについてTaintを付与します。
## 051~100のものにTaint付与
$ for az in a c d
  do
  	for n in $( seq 51 100 )
  	do
  		kubectl taint nodes node-${az}-$( printf %03d ${n} ) taintkey=taintvalue:NoSchedule
  	done
  done

## Taintを確認
$ kubectl get node -o json | jq -r '.items[] | select( .spec.taints != null ) | [ .metadata.name, .spec.taints[].key ] | @sh'
'node-a-051' 'taintkey'
'node-a-052' 'taintkey'
'node-a-053' 'taintkey'
'node-a-054' 'taintkey'
'node-a-055' 'taintkey'
'node-a-056' 'taintkey'
'node-a-057' 'taintkey'
'node-a-058' 'taintkey'
'node-a-059' 'taintkey'
'node-a-060' 'taintkey'
・・・略・・・
'node-d-095' 'taintkey'
'node-d-096' 'taintkey'
'node-d-097' 'taintkey'
'node-d-098' 'taintkey'
'node-d-099' 'taintkey'
'node-d-100' 'taintkey'
一旦これまでのDeploymentをすべて削除したうえで、再度app1をデプロイします。
## お掃除(これまでの全Deployment削除)
$ kubectl delete deployment -A --all

## app1デプロイ
$ kubectl apply -f app1.yaml
以下コマンドで051~100のNodeは使用されていないことが確認できます。
$ kubectl get pod -o json | jq -r '.items[] | select( .status.phase == "Running" ) | .spec.nodeName' | cut -d "-" -f 3 | sort | uniq
001
002
003
004
005
・・・略・・・
045
046
047
048
049
050
app1と似ていますがtolerations:を追加した以下マニフェストをデプロイします。
---
apiVersion: apps/v1
kind: Deployment
metadata:
  labels:
    app: toleration
  name: toleration
  namespace: toleration
spec:
  replicas: 150
  selector:
    matchLabels:
      app: toleration
  template:
    metadata:
      labels:
        app: toleration
    spec:
      topologySpreadConstraints:
      - maxSkew: 1
        topologyKey: topology.kubernetes.io/zone
        whenUnsatisfiable: DoNotSchedule
        labelSelector:
          matchLabels:
            app: toleration
      - maxSkew: 1
        topologyKey: kubernetes.io/hostname
        whenUnsatisfiable: DoNotSchedule
        labelSelector:
          matchLabels:
            app: toleration
      tolerations:
      - key: "taintkey"
        operator: "Equal"
        value: "taintvalue"
        effect: "NoSchedule"
      containers:
      - name: test
        image: debian:12-slim
$ kubectl create namespace toleration
namespace/toleration created

$ kubectl apply -f toleration.yaml
deployment.apps/toleration created

$ kubectl get pod -n toleration -o json | jq -r '.items[] | select( .status.phase == "Running" ) | .spec.nodeName' | cut -d "-" -f 3 | sort | uniq
051
052
053
054
055
・・・略・・・
095
096
097
098
099
100
tolerations:を付与したPodは051~100のNode(taintあり)で起動しています。
この場合もアノテーション"filter-result"に、ポイントとなる判断が記載されています。
app1(toleration無し)の場合、051~100のNodeで"TaintToleration"欄が"node(s) had untolerated taint {taintkey: taintvalue}"となり除外されています。
$ kubectl get pod app1-9d59c89f8-vm248 -o json |jq -r '.metadata.annotations."kube-scheduler-simulator.sigs.k8s.io/filter-result" | fromjson'|grep -e node- -e TaintToleration

・・・略・・・
  "node-c-045": {
    "TaintToleration": "passed"
  "node-c-046": {
    "TaintToleration": "passed"
  "node-c-047": {
    "TaintToleration": "passed"
  "node-c-048": {
    "TaintToleration": "passed"
  "node-c-049": {
    "TaintToleration": "passed"
  "node-c-050": {
    "TaintToleration": "passed"
  "node-c-051": {
    "TaintToleration": "node(s) had untolerated taint {taintkey: taintvalue}"
  "node-c-052": {
    "TaintToleration": "node(s) had untolerated taint {taintkey: taintvalue}"
  "node-c-053": {
    "TaintToleration": "node(s) had untolerated taint {taintkey: taintvalue}"
  "node-c-054": {
    "TaintToleration": "node(s) had untolerated taint {taintkey: taintvalue}"
  "node-c-055": {
    "TaintToleration": "node(s) had untolerated taint {taintkey: taintvalue}"
・・・略・・・
一方、toleration有りのPodでは、全Nodeの"TaintToleration"欄が"passed"となっています。
$ kubectl get pod toleration-56b4677756-wtnm8 -n toleration -o json |jq -r '.metadata.annotations."kube-scheduler-simulator.sigs.k8s.io/filter-result" | fromjson'|grep -e node- -e TaintToleration

・・・略・・・
  "node-a-045": {
    "TaintToleration": "passed"
  "node-a-046": {
    "TaintToleration": "passed"
  "node-a-047": {
    "TaintToleration": "passed"
  "node-a-048": {
    "TaintToleration": "passed"
  "node-a-049": {
    "TaintToleration": "passed"
  "node-a-050": {
    "TaintToleration": "passed"
  "node-a-051": {
    "TaintToleration": "passed"
  "node-a-052": {
    "TaintToleration": "passed"
  "node-a-053": {
    "TaintToleration": "passed"
  "node-a-054": {
    "TaintToleration": "passed"
  "node-a-055": {
    "TaintToleration": "passed"
・・・略・・・
お掃除のため以下コマンドで本節冒頭で追加したtaintを削除します。
$ for az in a c d
  do
  	for n in $( seq 51 100 )
  	do
  		kubectl taint nodes node-${az}-$( printf %03d ${n} ) taintkey=taintvalue:NoSchedule-
  	done
  done
PriorityとPreemption
続いてPriorityとPreemptionをシミュレーションします。
先ほどまでも使用していたapp1のreplicas:を300(=Node数)とし、resources:のrequests:, limits:ともにCPUを16個(=Node搭載量)としたものをデプロイします。
---
apiVersion: apps/v1
kind: Deployment
metadata:
  labels:
    app: app1
  name: app1
spec:
  replicas: 300
  selector:
    matchLabels:
      app: app1
  template:
    metadata:
      labels:
        app: app1
    spec:
      topologySpreadConstraints:
      - maxSkew: 1
        topologyKey: topology.kubernetes.io/zone
        whenUnsatisfiable: DoNotSchedule
        labelSelector:
          matchLabels:
            app: app1
      - maxSkew: 1
        topologyKey: kubernetes.io/hostname
        whenUnsatisfiable: DoNotSchedule
        labelSelector:
          matchLabels:
            app: app1
      containers:
      - name: test
        image: debian:12-slim
        resources:
          requests:
            cpu: 16
            memory: 128Mi
          limits:
            cpu: 16
            memory: 128Mi
## お掃除(これまでの全Deployment削除)
$ kubectl delete deployment -A --all

## app1デプロイ
$ kubectl apply -f app1.yaml

$ kubectl get pod -o json | jq -r '.items[] | select( .status.phase == "Running" ) | .metadata.name' | wc -l
300
→300個Podが起動
全Nodeの全CPUをrequestsしているため、もうNodeに空は無く他のPodは起動できません。
試しに以下、CPUを1つ使用するPodを30個起動するDeploymentをデプロイしてみても、すべてPendingとなります。
---
apiVersion: apps/v1
kind: Deployment
metadata:
  labels:
    app: normal
  name: normal
  namespace: priority
spec:
  replicas: 30
  selector:
    matchLabels:
      app: normal
  template:
    metadata:
      labels:
        app: normal
    spec:
      topologySpreadConstraints:
      - maxSkew: 1
        topologyKey: topology.kubernetes.io/zone
        whenUnsatisfiable: DoNotSchedule
        labelSelector:
          matchLabels:
            app: normal
      - maxSkew: 1
        topologyKey: kubernetes.io/hostname
        whenUnsatisfiable: DoNotSchedule
        labelSelector:
          matchLabels:
            app: normal
      containers:
      - name: normal
        image: debian:12-slim
        resources:
          requests:
            cpu: 1
            memory: 128Mi
          limits:
            cpu: 1
            memory: 128Mi
$ kubectl create namespace priority

$ kubectl apply -f normal.yaml

$ kubectl get pod -n priority -o json | jq -r '.items[] | select( .status.phase == "Running" ) | .metadata.name' | wc -l
0

$ kubectl get pod -n priority -o json | jq -r '.items[] | select( .status.phase == "Pending" ) | .metadata.name' | wc -l
30
→30個のPod全てが"Pending"
この時の様子もアノテーション"filter-result"に、ポイントとなる判断が記載されています。
"NodeResourcesFit"欄に"Insufficient cpu"(CPU不足)と表示され除外されているのです。
$ kubectl get pod normal-bdd8bcd54-jvcqp -n priority -o json | jq -r '.metadata.annotations."kube-scheduler-simulator.sigs.k8s.io/filter-result" | fromjson' | grep -e node- -e NodeResourcesFit
  "node-a-001": {
    "NodeResourcesFit": "Insufficient cpu",
  "node-a-002": {
    "NodeResourcesFit": "Insufficient cpu",
  "node-a-003": {
    "NodeResourcesFit": "Insufficient cpu",
  "node-a-004": {
    "NodeResourcesFit": "Insufficient cpu",
  "node-a-005": {
    "NodeResourcesFit": "Insufficient cpu",
・・・略・・・
k8sにはこのような場合でも絶対に起動してほしいPodに対しPriority(優先度)を高く設定することで無理やり起動することができます。"無理やり"とは、Priorityが低いPodを強制的に停止し追い出すことを意味します。
具体的には以下のように優先度(value:)を指定したPriorityClassリソースを定義したうえで、それをPod定義のpriorityClassName:に指定します。
※優先度の値の範囲は-2147483648から1000000000までとなり、値が大きいほど優先度が高くなります。
apiVersion: scheduling.k8s.io/v1
kind: PriorityClass
metadata:
  name: high-priority
value: 1000000000
globalDefault: false
---
apiVersion: apps/v1
kind: Deployment
metadata:
  labels:
    app: high
  name: high
  namespace: priority
spec:
  replicas: 30
  selector:
    matchLabels:
      app: high
  template:
    metadata:
      labels:
        app: high
    spec:
      topologySpreadConstraints:
      - maxSkew: 1
        topologyKey: topology.kubernetes.io/zone
        whenUnsatisfiable: DoNotSchedule
        labelSelector:
          matchLabels:
            app: high
      - maxSkew: 1
        topologyKey: kubernetes.io/hostname
        whenUnsatisfiable: DoNotSchedule
        labelSelector:
          matchLabels:
            app: high
      containers:
      - name: high
        image: debian:12-slim
        resources:
          requests:
            cpu: 1
            memory: 128Mi
          limits:
            cpu: 1
            memory: 128Mi
      priorityClassName: high-priority
## normal Podを削除
$ kubectl delete -f normal.yaml

## PriorityClassをデプロイ
$ kubectl apply -f priorityclass.yaml

## 「high-priority」を指定したPodをデプロイ
$ kubectl apply -f high.yaml

$ kubectl get pod -n priority | grep high- | grep Running | wc -l
30
→「high-priority」を指定したPodはRunningになる

$ kubectl get pod -o json | jq -r '.items[] | select( .status.phase == "Running" ) | .metadata.name' | wc -l
270
→app1が30個追い出され起動数が270になった
なお、あるPod(この場合high)が他のPodを追い出した(preempt)場合、kubectl get podの項目の"NOMINATED NODE"にそのNode名が表記されます。今回の場合も、ちゃんと"NOMINATED NODE"に表記があり、このあたりもシミュレートできていることがわかります。
$ kubectl get pod -n priority high-64f8657f45-sccpt -o wide
NAME                    READY   STATUS    RESTARTS   AGE   IP           NODE         NOMINATED NODE   READINESS GATES
high-64f8657f45-sccpt   1/1     Running   0          51m   10.0.1.106   node-c-064   node-c-064       <none>
当該Podのスケジューラの挙動を確認すると、"NOMINATED NODE"に表記されたNodeについては追い出しを実行した結果、すべての項目が"passed"となり、スケジュールされたことが伺えます。
$ kubectl get pod -n priority high-64f8657f45-sccpt -o json | jq -r '.metadata.annotations."kube-scheduler-simulator.sigs.k8s.io/filter-result" | fromjson'
・・・略・・・
  "node-c-062": {
    "NodeName": "passed",
    "NodeResourcesFit": "Insufficient cpu",
    "NodeUnschedulable": "passed",
    "TaintToleration": "passed"
  },
  "node-c-063": {
    "NodeName": "passed",
    "NodeResourcesFit": "Insufficient cpu",
    "NodeUnschedulable": "passed",
    "PodTopologySpread": "passed",
    "TaintToleration": "passed"
  },
  "node-c-064": {  ##★全ての項目がpassed
    "NodeName": "passed",
    "NodeResourcesFit": "passed",
    "NodeUnschedulable": "passed",
    "PodTopologySpread": "passed",
    "TaintToleration": "passed"
  },
  "node-c-065": {
    "NodeName": "passed",
    "NodeResourcesFit": "Insufficient cpu",
    "NodeUnschedulable": "passed",
    "TaintToleration": "passed"
  },
  "node-c-066": {
    "NodeName": "passed",
    "NodeResourcesFit": "Insufficient cpu",
    "NodeUnschedulable": "passed",
    "TaintToleration": "passed"
  },
・・・略・・・
スケジューリングプロファイル
最後に、スケジューリングプロファイルを応用し、なるべく1つのNodeにPodを詰め込む、いわゆるBin Packingをやってみます。
手順の前に少しだけ理論面のお勉強です。
k8sのスケジューラはpluginの組み合わせで実装されています。これまで確認してきた基本的な機能もすべてpluginで実装されています。
これまでの動作確認で表示していた"filter-result"アノテーションの各フィールドの名前は、実はこのpluginの名前です。
- NodeAffinity
- PodTopologySpread
- InterPodAffinity
- TaintToleration
デフォルトで含まれるpluginはこちらに一覧されています。
Bin Packingはこのうち"NodeResourcesFit"というpluginのパラメータを変更することで実現します。
"NodeResourcesFit"はPodが要求するすべてのリソース(CPUやメモリ等requests:で指定するもの)がNodeにあるかどうかを確認しスコアリングするpluginです。
このpluginのスケジューリング戦略は以下の3つから選べます。デフォルトはLeastAllocatedです。
- LeastAllocated (default)
- リソースに最も空きがあるNodeに高いスコアを付ける
- MostAllocated
- リソースを最も使用しているNode(=Pod集約率が高くなるノード)に高いスコアを付ける
- RequestedToCapacityRatio
- ユーザーが任意に指定したリソースと重みに応じスコアを付ける
というわけでスケジューリング戦略を"MostAllocated"に変更することでBin Packingをやってみます。
スケジューラのpluginの設定は、"KubeSchedulerConfiguration"というカスタムリソースの形式をした設定ファイルをスケジューラの起動時の引数に"--config ファイル名"と指定することで行います。
余談ですが、(筆者が動作環境としても使用の)AWSが提供するKubernetesサービスであるEKSではスケジューラはAWSにより管理されており、KubeSchedulerConfigurationを変更・設定することはできないそうです。代替スケジューラを使用することで似たことが実現できるようですが複雑性が増すため注意が必要です。
kube-scheduler-simulatorの資材の場合、simulator/cmd/scheduler/scheduler.yamlが設定ファイルに該当します。
このファイル、元々は以下のように特に何も設定されていません。
$ cat simulator/cmd/scheduler/scheduler.yaml
kind: KubeSchedulerConfiguration
apiVersion: kubescheduler.config.k8s.io/v1
これを以下の内容に書き換えます。
apiVersion: kubescheduler.config.k8s.io/v1
kind: KubeSchedulerConfiguration
profiles:
- schedulerName: default-scheduler         #★1
- schedulerName: node-binpacking-scheduler #★2
  pluginConfig:
  - name: NodeResourcesFit                 #★3
    args:
      scoringStrategy:
        type: MostAllocated
        resources:
        - name: cpu
          weight: 1
  plugins:
    multiPoint:
      enabled:                             #★4
      - name: 'NodeResourcesFit'
        weight: 100
      disabled:                            #★5
      - name: 'PodTopologySpread'
      - name: 'NodeResourcesBalancedAllocation'
percentageOfNodesToScore: 100              #★6
この設定ファイルのポイントとなる設定(★)の意味を以下に示します。
KubeSchedulerConfigurationのリファレンスはこちらにあるためこちらも適宜ご参照ください。
- ★1:
- Podにスケジューラ設定を記載しなかった場合にデフォルトで使用される「default-scheduler」をそのままのかたちで維持するための記載。
- ★2:
- 新たなスケジューラ「node-binpacking-scheduler」の定義。(~21行目)
- ★3:
- プラグイン「NodeResourcesFit」のスコアリング戦略(scoringStrategy)をCPU数をベースとした"MostAllocated"に設定する。(~13行目)
- ★4:
- プラグイン「NodeResourcesFit」の重み付けを100とし(デフォルトは1)、他のプラグインより優先されるように設定する。(~18行目)
- ★5:
- プラグイン「PodTopologySpread」と「NodeResourcesBalancedAllocation」はBin Packing(同じNodeにPodを詰め込む)とは逆の判断を行うもののため、無効化しています。(~21行目)
- ★6:
- スケジューラはデフォルトで、全体のNode数が50を超える場合、ある数の割り当て可能なNodeが見つかった時点でNodeの探索を止めるアルゴリズムが組み込まれています。
- 本節での実験ではNodeは300台あるため、このアルゴリズムが作動しBin Packingが中途半端になってしまう(バラつく)ため、100(%)を設定し必ず全Nodeが探索されるように設定しています。
scheduler.yamlの書き換え後、kube-scheduler-simulatorを再起動します。Nodeも含めリセットされるため再度デプロイする必要がある点に注意してください。
$ vi simulator/cmd/scheduler/scheduler.yaml
→上記内容に書き換え

## kube-scheduler-simulatorを停止
$ podman-compose down --volumes

## kube-scheduler-simulatorを起動
$ podman-compose up -d

## Nodeを改めてデプロイ
$ kubectl apply -f dummy-node-100.yaml
Bin Packingの挙動を確認するため、以下のDeploymentをデプロイします。
schedulerName:には先ほどscheduler.yamlに定義したスケジューラ「node-binpacking-scheduler」を指定しています。
また、resources:にCPUを500m(0.5個)使用することを宣言しています。
---
apiVersion: apps/v1
kind: Deployment
metadata:
  labels:
    app: binpack
  name: binpack
  namespace: binpack
spec:
  replicas: 300
  selector:
    matchLabels:
      app: binpack
  template:
    metadata:
      labels:
        app: binpack
    spec:
      schedulerName: node-binpacking-scheduler
      containers:
      - name: test
        image: debian:12-slim
        resources:
          requests:
            cpu: 500m
            memory: 128Mi
          limits:
            cpu: 500m
            memory: 128Mi
$ kubectl create namespace binpack

$ kubectl apply -f binpack.yaml
デプロイ後、Podの配置状況を確認します。
$ kubectl get pod -n binpack -o json | jq -r '.items[] | select( .status.phase == "Running" ) | .metadata.name' | wc -l
300

$ kubectl get pod -n binpack -o json | jq -r '.items[] | select( .status.phase == "Running" ) | .spec.nodeName' | sort | uniq -c
     32 node-a-041
     32 node-a-083
     12 node-a-089
     32 node-c-002
     32 node-c-004
     32 node-c-017
     32 node-c-060
     32 node-c-079
     32 node-c-097
     32 node-d-046
9ノードに32個ずつ、1ノードに12個、合計300個のPodが起動しました。
本環境での各NodeのCPU搭載数が16個で、各Podが0.5個のCPUを要求しているため各NodeのPodは"16 ÷ 0.5 = 32個"ずつとなりました。
このときのスケジューラの挙動は(filter-resultではなく)score-resultアノテーションを見るとわかります。
以下のようにPodが配置されたNodeだけ"NodeResourcesFit"のスコア値が他より高くなっていることがわかります。
$ kubectl get pod -n binpack binpack-666bb56b89-zz7zb -o wide
NAME                       READY   STATUS    RESTARTS   AGE     IP           NODE         NOMINATED NODE   READINESS GATES
binpack-666bb56b89-zz7zb   1/1     Running   0          3m15s   10.0.0.226   node-d-046   <none>           <none>

$ kubectl get pod -n binpack binpack-666bb56b89-zz7zb -o json | jq -r '.metadata.annotations."kube-scheduler-simulator.sigs.k8s.io/score-result" | fromjson'

・・・略・・・
  "node-d-042": {
    "ImageLocality": "0",
    "NodeResourcesFit": "3",
    "TaintToleration": "0"
  },
  "node-d-043": {
    "ImageLocality": "0",
    "NodeResourcesFit": "3",
    "TaintToleration": "0"
  },
  "node-d-044": {
    "ImageLocality": "0",
    "NodeResourcesFit": "3",
    "TaintToleration": "0"
  },
  "node-d-045": {
    "ImageLocality": "0",
    "NodeResourcesFit": "3",
    "TaintToleration": "0"
  },
  "node-d-046": {
    "ImageLocality": "0",
    "NodeResourcesFit": "6", #★このNodeのスコアが高い
    "TaintToleration": "0"
  },
  "node-d-047": {
    "ImageLocality": "0",
    "NodeResourcesFit": "3",
    "TaintToleration": "0"
  },
  "node-d-048": {
    "ImageLocality": "0",
    "NodeResourcesFit": "3",
    "TaintToleration": "0"
  },
  "node-d-049": {
    "ImageLocality": "0",
    "NodeResourcesFit": "3",
    "TaintToleration": "0"
  },
・・・略・・・
なお、補足として上記score-resultの項目には本来は「PodTopologySpread」や「NodeResourcesBalancedAllocation」もあるはずですが、これらは先ほどscheduler.yamlで明示的に無効にしたため表示されなくなっています。
さいごに
というわけで、無事にk8sのスケジューラをシミュレーションすることができました。
Node数300台のk8sクラスタを触る機会は筆者にはなかなか無いですが、シミュレーションであればサクッと構築・実験できるのでとても勉強になりました。
皆様も是非kube-scheduler-simulatorを活用し、k8sのスケジューリングを完全に理解したうえで心安らかにクリスマス&年末をお過ごしください。
※記載されている会社名、製品名、サービス名は、各社の商標または登録商標です。