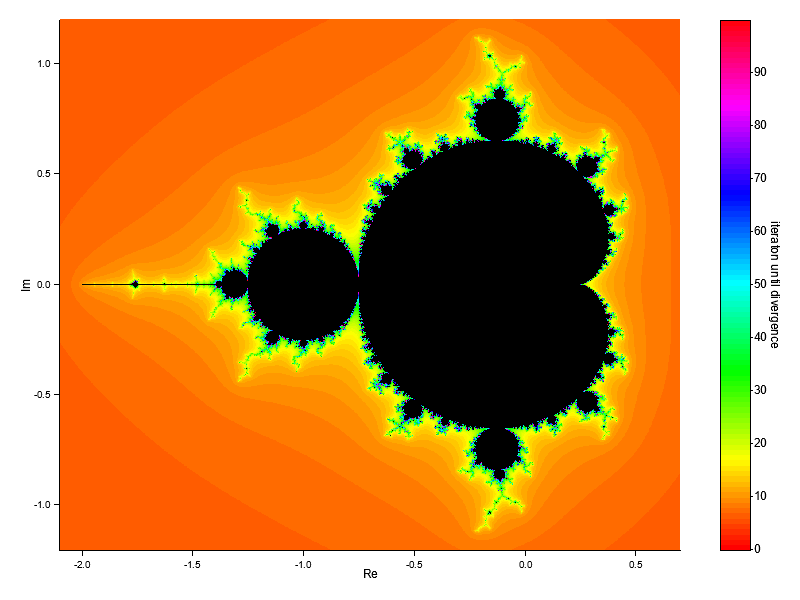
今回はrustの勉強としてplottersでマンデルブロ集合のグラフの描画を行います.具体的には以下の画像が描画できます.
ほとんどexampleのコードと同じなので,分かりにくい場合はそちらを参照してください.
マンデルブロ集合を求める
マンデルブロ集合とは,複素数列
$$
\begin{equation*}
\begin{cases}
z_{n+1} = z_{n}^2 + c \
z_{0} = 0
\end{cases}
\end{equation*}
$$
が$n\to \infty$の極限で無限大に発散しない複素数$c$の集合です.$c=a+ib,\ z_{n+1}=x_{n+1}+iy_{n+1},\ z_{n}=x_{n}+iy_{n}$とすれば
$$
\begin{align*}
x_{n+1}+iy_{n+1} &= (x_n + iy_n)(x_n+ iy_n) + a+ib \
&= x_n^2+2ix_ny_n-y_n^2+a+ib \
&= (x_n^2 - y_n^2+a) + i(2x_ny_n+b)
\end{align*}
$$
よって
$$
\begin{equation}
\begin{cases}
x_{n+1} &= x_n^2 - y_n^2 + a \
y_{n+1} &= 2x_ny_n+b
\end{cases}
\end{equation}
$$
として実部と虚部をそれぞれ更新していきます.発散するつまり$|z_{n}|= \sqrt{x_{n}^2+y_{n}^2}$がある値(今回は10e20)を越えたときに更新を終了し,発散しなかった場合は黒で,発散した場合は発散までのイテレーション回数と対応する色で描画します.発散までのイテレーション回数を計算する部分は以下となります.
struct MandelbrotSet{
    real_lim: (f64, f64),  // 実部の範囲
    complex_lim: (f64, f64),  // 虚部の範囲
    max_iter: usize,  // 最大イテレーション数
    step: (f64, f64),  // サンプル間の距離
}

impl MandelbrotSet{
    fn new(
        real_lim: (f64, f64),  // 実部の範囲
        complex_lim: (f64, f64),  // 虚部の範囲
        sample_size: (usize, usize),  // グラフのサンプル数
        max_iter: usize  // 最大イテレーション数
    ) -> Self{
        let step = (
            (real_lim.1 - real_lim.0) / sample_size.0 as f64,
            (complex_lim.1 - complex_lim.0) / sample_size.1 as f64
        );  // stepの計算
        Self{
            real_lim,
            complex_lim,
            max_iter,
            step
        }
    }

    fn get_count(&self, pixel_xy: (usize, usize)) -> (f64, f64, usize) {
        let (pixel_x, pixel_y) = pixel_xy;
        let a: f64 = self.real_lim.0 + (pixel_x as f64) * self.step.0;  // 実部
        let b: f64 = self.complex_lim.0 + (pixel_y as f64) * self.step.1;  // 虚部

        let (mut x, mut y): (f64, f64) = (0.0, 0.0);  // 数列用の変数
        let mut count = 0;
        while count < self.max_iter && x * x + y * y <= 1e10 {
            let new_x = x * x - y * y + a;
            let new_y =  2.0 * x * y + b;
            x = new_x;
            y = new_y;
            count += 1;
        }
        (a, b, count)
    }
}
与えられた実部と虚部の範囲を画像のように格子状に区切って描画することを想定しています.stepは格子の横と縦の長さを表します.get_countメソッドは格子の座標を引数として,対応する実際の実部と虚部の値と発散までのイテレーション回数を返します.
描画
描画部分全体は以下になります.
use plotters::prelude::*;

fn main() -> Result<(), Box<dyn std::error::Error>> {
    let out_file = "plotters-doc-data/mandelbrot_v3.png";

    let graph_size: (usize, usize) = (700, 600);  // グラフのサイズ
    let sample_size: (usize, usize) = (1400, 1200);  // サンプルサイズ

    let real_lim = (-2.1f64, 0.7f64);  // 実部の範囲
    let complex_lim = (-1.2f64, 1.2f64);  // 虚部の範囲

    let root = BitMapBackend::new(out_file, (graph_size.0 as u32 + 100_u32, graph_size.1 as u32)).into_drawing_area();
    root.fill(&WHITE)?;

    let (left, right) = root.split_horizontally(graph_size.0 as u32);  // カラーバーの部分と描画部分を分割

    // マンデルブロー集合の描画
    let mut chart_1 = ChartBuilder::on(&left)
        .margin(20)
        .x_label_area_size(30)
        .y_label_area_size(40)
        .build_cartesian_2d(real_lim.0..real_lim.1, complex_lim.0..complex_lim.1)?;

    chart_1
        .configure_mesh()
        .disable_x_mesh()
        .disable_y_mesh()
        .x_desc("Re")
        .y_desc("Im")
        .axis_desc_style(("sans-serif", 15))
        .draw()?;

    let plotting_area_1 = chart_1.plotting_area();

    let max_iter: usize = 100;
    let mandelbrot_set = MandelbrotSet::new(real_lim, complex_lim, sample_size, max_iter);

    for i in 0..sample_size.0*sample_size.1 {
        let (pixel_x, pixel_y): (usize, usize) = ((i % sample_size.0) as usize, (i / sample_size.0) as usize);
        let (a, b, count) = mandelbrot_set.get_count((pixel_x, pixel_y));
        if count != max_iter {  // 最大イテレーションではない場合
            plotting_area_1.draw_pixel((a, b), &HSLColor(count as f64 / max_iter as f64, 1.0, 0.5))?;
        } else {
            plotting_area_1.draw_pixel((a, b), &BLACK)?;
        }
    }

    // カラーバーの描画
    let mut chart_2 =  ChartBuilder::on(&right)
        .margin(20)
        .set_label_area_size(LabelAreaPosition::Right, 30)
        .x_label_area_size(30)
        .build_cartesian_2d(0..1, 0..max_iter)?;

    chart_2
        .configure_mesh()
        .disable_x_mesh()
        .disable_y_mesh()
        .disable_x_axis()
        .y_desc("iteraton until divergence")
        .label_style(("sans-serif", 15).into_font())
        .draw()?;

    // カラーマップの描画
    chart_2.draw_series(
        (0..max_iter).map(|i|{Rectangle::new([(0, i + 1), (1, i)],
            Into::<ShapeStyle>::into(&HSLColor(i as f64 / max_iter as f64, 1.0, 0.5)).filled()
            )})
    )?;

    let plotting_area_2 = chart_2.plotting_area();

    // 枠の描画
    plotting_area_2.draw(&Rectangle::new(
        [(0, max_iter), (1, 0)],
        ShapeStyle::from(&BLACK)
    ))?;

    // 以下でもよい(plotting_area_2を作成しない場合)
    //chart_2.draw_series(
    //    (0..1).map(|_|Rectangle::new([(0, max_iter), (1, 0)], ShapeStyle::from(&BLACK)))
    //)?;

    root.present().expect("Unable to write result to file, please make sure 'plotters-doc-data' dir exists under current dir");
    println!("Result has been saved to {}", out_file);

    Ok(())
}
into_drawing_area()メソッドでルートとなるDrawingAreaを取得します.サイズはカラーバーの部分も含んでいます.
let root = BitMapBackend::new(out_file, (graph_size.0 as u32 + 100_u32, graph_size.1 as u32)).into_drawing_area();
root.fill(&WHITE)?;
マンデルブロ集合のグラフとカラーバーの二つを描画するため,DrawingAreaを横に分割します.以降はそれぞれのDrawingAreaについてチャートの設定と描画を行います.
let (left, right) = root.split_horizontally(graph_size.0 as u32); // カラーバーの部分と描画部分を分割
マンデルブロ集合のグラフ描画部分は以下となります.例によってChartContextをビルドし,軸の設定を行います.for文では何番目の格子であるかを示すpixel_x, pixel_yをMandelbrotSetのget_countメソッドに渡し,対応する実部と虚部の実数値とイテレーション回数を取得しています.DrawingAreaのdraw_pixelメソッドでピクセルずつの描画をしていますが,どういうわけかChartContextから作成したDrawingAreaのdraw_pixelではチャートの座標によっては実数を渡すことができます.どのようにピクセルのサイズを評価しているか気になります.
// マンデルブロー集合の描画
let mut chart_1 = ChartBuilder::on(&left)
    .margin(20)
    .x_label_area_size(30)
    .y_label_area_size(40)
    .build_cartesian_2d(real_lim.0..real_lim.1, complex_lim.0..complex_lim.1)?;

chart_1
    .configure_mesh()
    .disable_x_mesh()
    .disable_y_mesh()
    .x_desc("Re")
    .y_desc("Im")
    .axis_desc_style(("sans-serif", 15))
    .draw()?;

let plotting_area_1 = chart_1.plotting_area();

let max_iter: usize = 100;
let mandelbrot_set = MandelbrotSet::new(real_lim, complex_lim, sample_size, max_iter);

for i in 0..sample_size.0*sample_size.1 {
    let (pixel_x, pixel_y): (usize, usize) = ((i % sample_size.0) as usize, (i / sample_size.0) as usize);
    let (a, b, count) = mandelbrot_set.get_count((pixel_x, pixel_y));
    if count != max_iter {  // 最大イテレーションではない場合
        plotting_area_1.draw_pixel((a, b), &HSLColor(count as f64 / max_iter as f64, 1.0, 0.5))?;
    } else {
        plotting_area_1.draw_pixel((a, b), &BLACK)?;
    }
}
カラーバーの描画が以下となります.位置の調整のため,余白は左側と同じにしています.
カラーマップはChartContextのdraw_seriesメソッドを利用して色のついた矩形を並べて描画しています.枠線は一つの矩形だけなのでDrawingAreaを利用していますが,draw_seriesメソッドを利用してもいいと思います.
// カラーバーの描画
let mut chart_2 =  ChartBuilder::on(&right)
    .margin(20)
    .set_label_area_size(LabelAreaPosition::Right, 30)
    .x_label_area_size(30)
    .build_cartesian_2d(0..1, 0..max_iter)?;

chart_2
    .configure_mesh()
    .disable_x_mesh()
    .disable_y_mesh()
    .disable_x_axis()
    .y_desc("iteraton until divergence")
    .label_style(("sans-serif", 15).into_font())
    .draw()?;

// カラーマップの描画
chart_2.draw_series(
    (0..max_iter).map(|i|{Rectangle::new([(0, i + 1), (1, i)],
        Into::<ShapeStyle>::into(&HSLColor(i as f64 / max_iter as f64, 1.0, 0.5)).filled()
        )})
)?;

let plotting_area_2 = chart_2.plotting_area();

// 枠の描画
plotting_area_2.draw(&Rectangle::new(
    [(0, max_iter), (1, 0)],
    ShapeStyle::from(&BLACK)
))?;

// 以下でもよい(plotting_area_2を作成しない場合)
//chart_2.draw_series(
//    (0..1).map(|_|Rectangle::new([(0, max_iter), (1, 0)], ShapeStyle::from(&BLACK)))
//)?;
最後に指定したパスのディレクトリが存在しなかった場合のエラーメッセージを追加しています.
線の太さを変えたり,文字を回転させる方法が分からなかったので調べていく予定です.
root.present().expect("Unable to write result to file, please make sure 'plotters-doc-data' dir exists under current dir");
println!("Result has been saved to {}", out_file);
プログラム全体
最後にプログラム全体を載せます.
use plotters::prelude::*;

struct MandelbrotSet{
    real_lim: (f64, f64),  // 実部の範囲
    complex_lim: (f64, f64),  // 虚部の範囲
    max_iter: usize,  // 最大イテレーション数
    step: (f64, f64),  // サンプル間の距離
}

impl MandelbrotSet{
    fn new(
        real_lim: (f64, f64),  // 実部の範囲
        complex_lim: (f64, f64),  // 虚部の範囲
        sample_size: (usize, usize),  // グラフのサンプル数
        max_iter: usize  // 最大イテレーション数
    ) -> Self{
        let step = (
            (real_lim.1 - real_lim.0) / sample_size.0 as f64,
            (complex_lim.1 - complex_lim.0) / sample_size.1 as f64
        );  // stepの計算
        Self{
            real_lim,
            complex_lim,
            max_iter,
            step
        }
    }

    fn get_count(&self, pixel_xy: (usize, usize)) -> (f64, f64, usize) {
        let (pixel_x, pixel_y) = pixel_xy;
        let a: f64 = self.real_lim.0 + (pixel_x as f64) * self.step.0;  // 実部
        let b: f64 = self.complex_lim.0 + (pixel_y as f64) * self.step.1;  // 虚部

        let (mut x, mut y): (f64, f64) = (0.0, 0.0);  // 数列用の変数
        let mut count = 0;
        while count < self.max_iter && x * x + y * y <= 1e10 {
            let new_x = x * x - y * y + a;
            let new_y =  2.0 * x * y + b;
            x = new_x;
            y = new_y;
            count += 1;
        }
        (a, b, count)
    }
}


fn main() -> Result<(), Box<dyn std::error::Error>> {
    let out_file = "plotters-doc-data/mandelbrot_v3.png";

    let graph_size: (usize, usize) = (700, 600);  // グラフのサイズ
    let sample_size: (usize, usize) = (1400, 1200);  // サンプルサイズ

    let real_lim = (-2.1f64, 0.7f64);  // 実部の範囲
    let complex_lim = (-1.2f64, 1.2f64);  // 虚部の範囲

    let root = BitMapBackend::new(out_file, (graph_size.0 as u32 + 100_u32, graph_size.1 as u32)).into_drawing_area();
    root.fill(&WHITE)?;

    let (left, right) = root.split_horizontally(graph_size.0 as u32);  // カラーバーの部分と描画部分を分割

    // マンデルブロー集合の描画
    let mut chart_1 = ChartBuilder::on(&left)
        .margin(20)
        .x_label_area_size(30)
        .y_label_area_size(40)
        .build_cartesian_2d(real_lim.0..real_lim.1, complex_lim.0..complex_lim.1)?;

    chart_1
        .configure_mesh()
        .disable_x_mesh()
        .disable_y_mesh()
        .x_desc("Re")
        .y_desc("Im")
        .axis_desc_style(("sans-serif", 15))
        .draw()?;

    let plotting_area_1 = chart_1.plotting_area();

    let max_iter: usize = 100;
    let mandelbrot_set = MandelbrotSet::new(real_lim, complex_lim, sample_size, max_iter);

    for i in 0..sample_size.0*sample_size.1 {
        let (pixel_x, pixel_y): (usize, usize) = ((i % sample_size.0) as usize, (i / sample_size.0) as usize);
        let (a, b, count) = mandelbrot_set.get_count((pixel_x, pixel_y));
        if count != max_iter {  // 最大イテレーションではない場合
            plotting_area_1.draw_pixel((a, b), &HSLColor(count as f64 / max_iter as f64, 1.0, 0.5))?;
        } else {
            plotting_area_1.draw_pixel((a, b), &BLACK)?;
        }
    }

    // カラーバーの描画
    let mut chart_2 =  ChartBuilder::on(&right)
        .margin(20)
        .set_label_area_size(LabelAreaPosition::Right, 30)
        .x_label_area_size(30)
        .build_cartesian_2d(0..1, 0..max_iter)?;

    chart_2
        .configure_mesh()
        .disable_x_mesh()
        .disable_y_mesh()
        .disable_x_axis()
        .y_desc("iteraton until divergence")
        .label_style(("sans-serif", 15).into_font())
        .draw()?;

    // カラーマップの描画
    chart_2.draw_series(
        (0..max_iter).map(|i|{Rectangle::new([(0, i + 1), (1, i)],
            Into::<ShapeStyle>::into(&HSLColor(i as f64 / max_iter as f64, 1.0, 0.5)).filled()
            )})
    )?;

    let plotting_area_2 = chart_2.plotting_area();

    // 枠の描画
    plotting_area_2.draw(&Rectangle::new(
        [(0, max_iter), (1, 0)],
        ShapeStyle::from(&BLACK)
    ))?;

    // 以下でもよい(plotting_area_2を作成しない場合)
    //chart_2.draw_series(
    //    (0..1).map(|_|Rectangle::new([(0, max_iter), (1, 0)], ShapeStyle::from(&BLACK)))
    //)?;

    root.present().expect("Unable to write result to file, please make sure 'plotters-doc-data' dir exists under current dir");
    println!("Result has been saved to {}", out_file);

    Ok(())
}