In cryptocurrency trading, predicting price reversal points is extremely important for maximizing profits and minimizing risks. However, a challenge faced by many traders is identifying appropriate support and resistance levels and predicting price reactions at those levels. One powerful tool that solves this problem is Fibonacci Retracement. Particularly, utilizing Auto Fib Retracement functionality significantly reduces manual calculation and setting efforts, enabling more objective and consistent analysis.
For those who want to learn more about detailed Pine Script features, please check TradingView's Pine Script Official Reference.
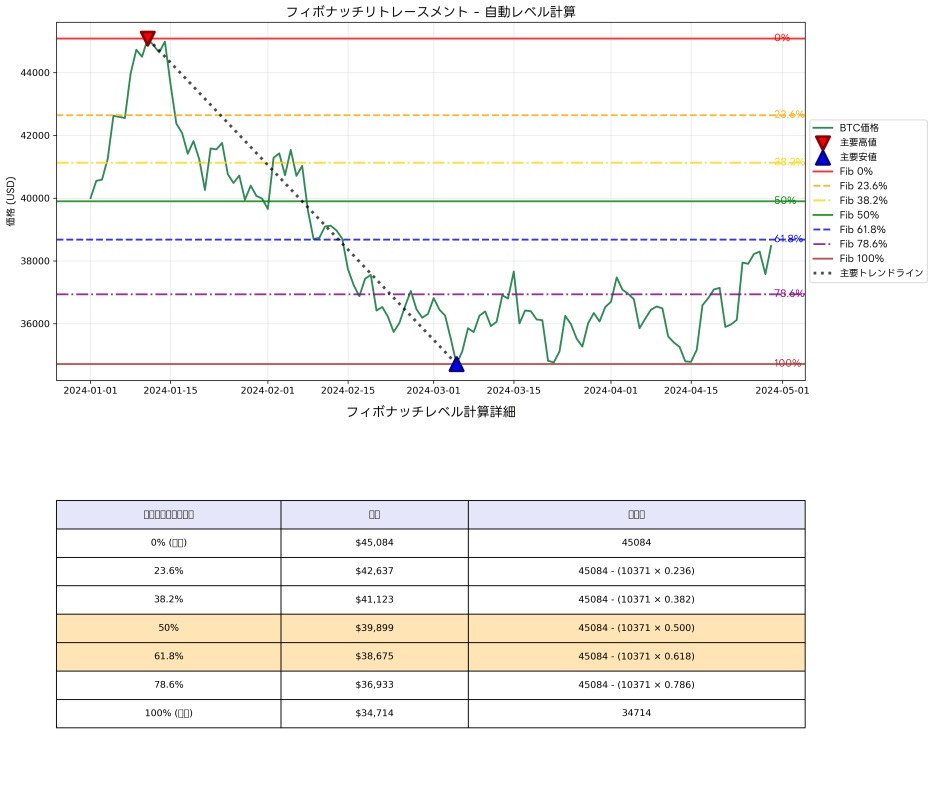
The concept of Fibonacci Retracement is based on the Fibonacci sequence discovered by 13th-century Italian mathematician Leonardo Fibonacci. The ratios derived from this sequence (23.6%, 38.2%, 50%, 61.8%, 78.6%, etc.) are known as golden ratios frequently observed in nature and financial markets. Advanced chart analysis platforms like TradingView can automatically calculate these ratios and display them in visually comprehensible formats.
Mathematical Foundation and Market Theory of Fibonacci Retracement
The effectiveness of Fibonacci Retracement is not mere superstition or coincidence, but is grounded in solid mathematical foundations and market psychology. In the Fibonacci sequence (1, 1, 2, 3, 5, 8, 13, 21, 34, 55, 89...), dividing each number by the next number converges to 0.618, and dividing by the number after next converges to 0.382. These ratios, known as the golden ratio, are recognized as elements that create aesthetic harmony in various natural phenomena and artistic works.
In financial markets, these ratios hold important meaning during price correction phases. The collective psychology and behavioral patterns of market participants tend to align with these mathematical ratios. For example, during correction phases following strong uptrends, when many investors consider "how far down to buy back," they often instinctively focus on positions around 38.2% or 61.8% of the overall movement.
This phenomenon may seem to contradict modern portfolio theory regarding market efficiency and randomness, but it can actually be explained from a behavioral economics perspective. When numerous market participants use the same analytical methods, it functions as a self-fulfilling prophecy, increasing the probability of actual price reversals at those levels.
Innovation and Practical Benefits of Auto Fib Retracement
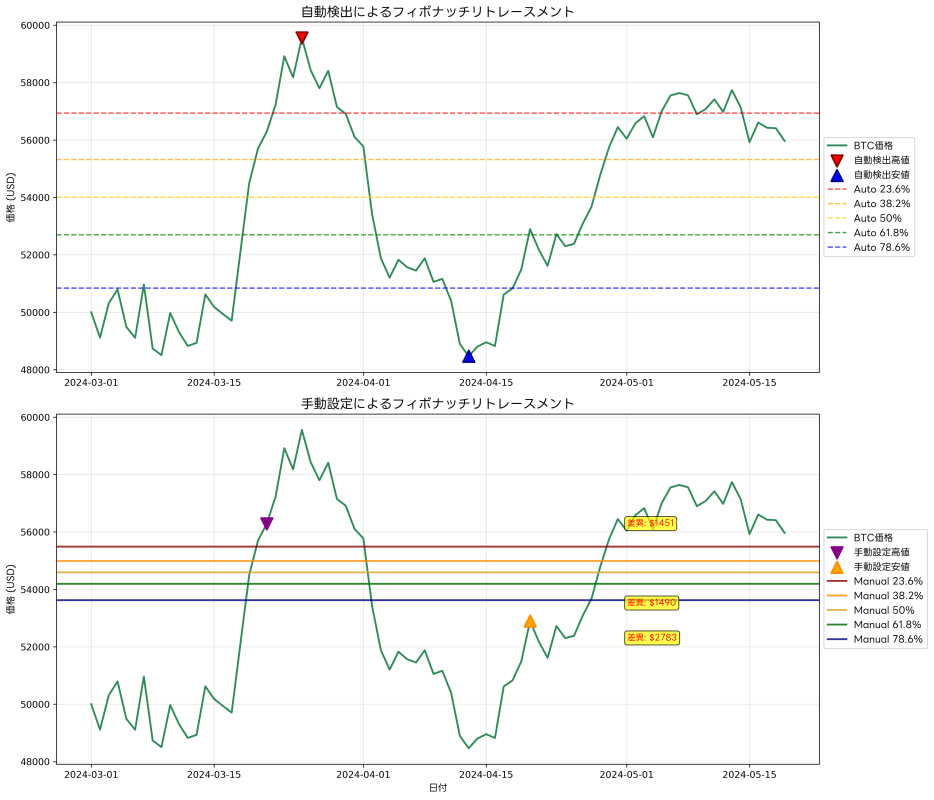
Traditional Fibonacci Retracement analysis required traders to manually identify highs and lows, select appropriate periods, and set retracement levels. This work was not only time-consuming but also dependent on subjective judgment, potentially producing different results even when analyzing the same chart. Auto Fib Retracement functionality minimizes such human factor errors and realizes more objective, reproducible analysis.
On TradingView's BTCUSD chart, this automatic functionality enables efficient analysis of Bitcoin price trends. The system automatically detects recent important highs and lows and draws Fibonacci levels over appropriate periods. This allows traders to concentrate on more important strategy planning and market analysis without spending time on technical setup work.
The accuracy of automatic detection functions greatly depends on the algorithms and configuration parameters used. Many implementations use pivot point detection algorithms to identify statistically significant highs and lows. These algorithms automatically identify price points with the highest and lowest values within specified periods and calculate Fibonacci levels between them.
Special Effectiveness of Auto Fib Retracement in Cryptocurrency Markets
Cryptocurrency markets have several unique characteristics compared to traditional financial markets: 24/7 continuous trading, high volatility, and incomplete price discovery mechanisms due to being relatively new asset classes. These characteristics heighten the importance of technical analysis beyond traditional levels, with the effectiveness of universal analytical methods like Fibonacci Retracement appearing particularly prominently.
In major cryptocurrencies like Bitcoin and Ethereum, price reversals at Fibonacci levels are frequently observed. This stems from many cryptocurrency market participants relying on technical analysis and traders worldwide using similar analytical tools. Auto Fib Retracement functionality significantly reduces risks of overlooking these important levels.
Particularly noteworthy is the effectiveness of Fibonacci levels during extreme price movements in cryptocurrency markets. During correction phases after rapid market rises or rebound phases after significant declines, price reversals near 61.8% retracement levels are observed very frequently. Using TradingView's Pine Script enables setting alerts at such important levels and building automated trading systems.
Multi-Timeframe Auto Fib Retracement Analysis
Effective Fibonacci analysis requires integrating information from multiple timeframes rather than depending on single timeframes. Applying Auto Fib Retracement functionality across different timeframes enables efficiently conducting both short-term trading opportunities and long-term trend analysis.
Auto Fib Retracement on daily charts is suitable for identifying main trend directions and important price levels. Weekly and monthly analyses are effective for long-term investment strategy planning. Meanwhile, 4-hour and 1-hour analyses can be utilized for identifying short-term trading opportunities and optimizing entry timing.
What's important are price zones where Fibonacci levels from different timeframes overlap. These overlapping zones are called "confluence zones" and often function as particularly powerful support/resistance levels. For example, when daily 38.2% levels and 4-hour 61.8% levels overlap at similar prices, reversal possibilities in that price zone increase significantly compared to individual levels.
Advanced Auto Fib Retracement Implementation with Pine Script
To further develop standard Auto Fib Retracement functionality and optimize for individual trading strategies, creating custom scripts is effective. Below is a basic implementation example:
//@version=5
indicator("Advanced Auto Fib Retracement", shorttitle="Auto Fib", overlay=true)

// Configuration parameters
lookback = input.int(20, title="Pivot Detection Period", minval=5, maxval=50)
fib_levels = input.bool(true, title="Show Fibonacci Levels")
extend_lines = input.bool(true, title="Extend Lines")

// Pivot point detection
pivot_high = ta.pivothigh(high, lookback, lookback)
pivot_low = ta.pivotlow(low, lookback, lookback)

// Track latest pivot points
var float last_high = na
var float last_low = na
var int high_bar = na
var int low_bar = na

// Update pivot points
if not na(pivot_high)
    last_high := pivot_high
    high_bar := bar_index - lookback

if not na(pivot_low)
    last_low := pivot_low
    low_bar := bar_index - lookback

// Calculate and draw Fibonacci levels
if not na(last_high) and not na(last_low) and fib_levels
    diff = last_high - last_low
    fib_786 = last_low + diff * 0.786
    fib_618 = last_low + diff * 0.618
    fib_500 = last_low + diff * 0.500
    fib_382 = last_low + diff * 0.382
    fib_236 = last_low + diff * 0.236

    // Draw Fibonacci lines
    line.new(x1=high_bar, y1=fib_786, x2=bar_index, y2=fib_786,
             color=color.red, width=1, style=line.style_dashed)
    line.new(x1=high_bar, y1=fib_618, x2=bar_index, y2=fib_618,
             color=color.orange, width=2, style=line.style_solid)
    line.new(x1=high_bar, y1=fib_500, x2=bar_index, y2=fib_500,
             color=color.yellow, width=1, style=line.style_dotted)
    line.new(x1=high_bar, y1=fib_382, x2=bar_index, y2=fib_382,
             color=color.green, width=2, style=line.style_solid)
    line.new(x1=high_bar, y1=fib_236, x2=bar_index, y2=fib_236,
             color=color.blue, width=1, style=line.style_dashed)
This script uses pivot point detection algorithms to automatically identify important highs and lows and draws Fibonacci levels between them. Using the Pine Script Editor enables further customization and feature expansion.
Utilizing Fibonacci Levels as Price Reversal Signals
The true value of Auto Fib Retracement lies not simply in displaying levels, but in properly interpreting price reactions at those levels and utilizing them for trading decisions. Fibonacci levels should be understood not as absolute price reversal points, but rather as "price zones requiring attention."
One effective utilization method is detailed observation of price action near Fibonacci levels. By comprehensively judging volume when prices approach Fibonacci levels, candlestick patterns, concordance with other technical indicators, etc., reversal possibilities can be evaluated more accurately.
Particularly important is the 61.8% retracement level. This level is also called "golden retracement" and functions as the most reliable reversal point in many cases. When prices clearly break below this level (in uptrends), questions arise about the original trend's continuation possibility, increasing the likelihood of deeper corrections or trend reversals.
Application to Risk Management and Position Sizing
Auto Fib Retracement plays an important role not only in identifying entry points but also in building effective risk management strategies. Stop-loss settings based on Fibonacci levels enable rational risk management considering natural market price movements.
For example, when taking long positions at 38.2% retracement levels, setting 50% or 61.8% levels as stop-losses enables maintaining appropriate risk-reward ratios. Such settings limit losses when predictions fail while maximizing profits when predictions succeed.
In position sizing, Fibonacci levels also provide effective guidance. A staged approach taking larger positions at more reliable levels (e.g., 61.8%) and smaller positions at less reliable levels (e.g., 23.6%) can improve risk-adjusted returns.
Integration with Other Technical Analysis Methods
Integrating with other technical analysis methods is important for maximizing Auto Fib Retracement effectiveness. Combinations with moving averages, trend lines, support/resistance levels, oscillator indicators, etc. enable more comprehensive and reliable analysis.
TradingView's indicator library publishes various scripts combining Fibonacci Retracement with other indicators, enabling construction of unique analysis systems using these as reference.
One particularly effective combination is concurrent use with RSI (Relative Strength Index). Confirming RSI values when prices reach Fibonacci levels enables comprehensive judgment combined with overbought/oversold conditions. When RSI is in oversold conditions while prices are at 61.8% retracement levels, this can be interpreted as a strong buy signal.
Adaptive Operation According to Market Environment
Auto Fib Retracement effectiveness varies depending on market environment. In strong trending markets, reversals at shallow retracements (23.6% or 38.2%) are frequently observed, while in range markets or unstable markets, prices tend to move to deeper retracements (61.8% or 78.6%).
To respond to such market environment changes, utilizing TradingView's alert features to set immediate notifications when prices reach important Fibonacci levels is effective. This minimizes risks of missing trading opportunities in 24-hour cryptocurrency markets.
Additionally, during high and low volatility periods, Fibonacci level effectiveness also changes. During high volatility periods, even if prices temporarily break through Fibonacci levels, they often eventually return near those levels. Meanwhile, during low volatility periods, more accurate reversals at Fibonacci levels tend to be observed.
Role of Auto Fib Retracement in Long-Term Investment Strategies
Auto Fib Retracement plays important roles not only in short-term trading but also in long-term investment strategies. Fibonacci analysis on monthly or weekly charts enables predicting major market cycle turning points and optimizing long-term portfolio allocation.
For emerging asset classes like cryptocurrencies, where traditional fundamental analysis is difficult, technical analysis importance increases further. Through TradingView's long-term chart analysis, Fibonacci level effectiveness across multi-year price cycles can be verified and utilized for long-term investment strategy accuracy improvement.
Backtesting and Performance Evaluation
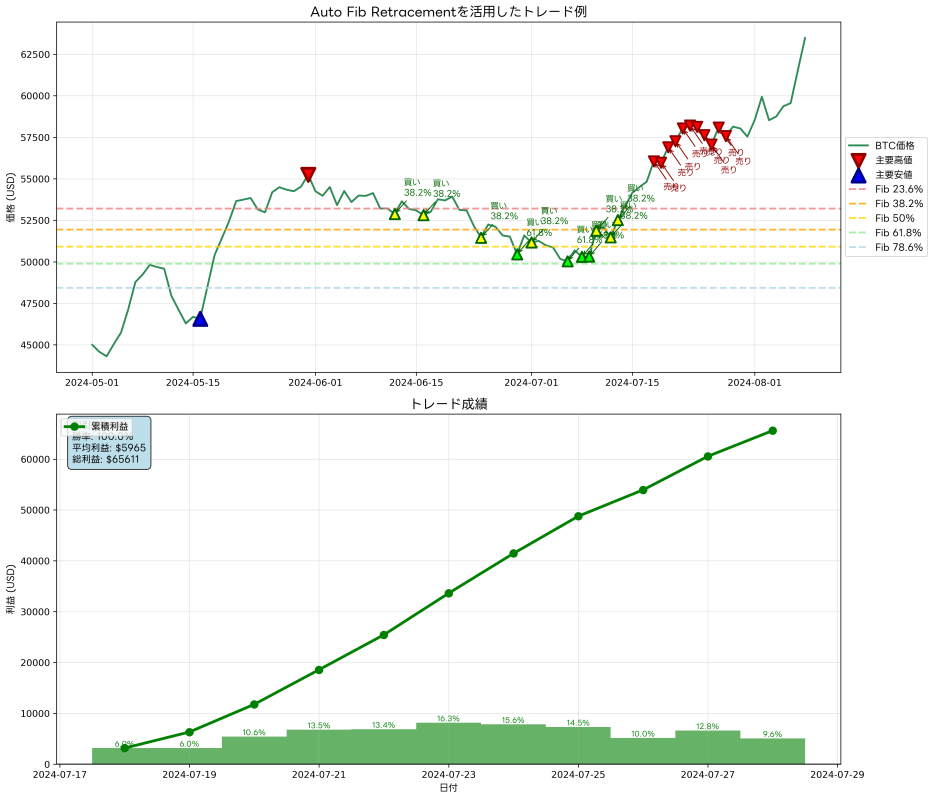
Objective evaluation of trading strategy effectiveness utilizing Auto Fib Retracement requires backtesting using historical data. Backtesting enables quantitative analysis of Fibonacci level effectiveness under different market environments, optimal parameter settings, risk-reward ratios, etc.
Important evaluation metrics include win rate, average profit, maximum drawdown, Sharpe ratio, etc. Through these metrics, long-term sustainability and profitability of Auto Fib Retracement strategies can be evaluated and connected to continuous improvement.
Psychological Factors and Market Sentiment
Fibonacci Retracement effectiveness is closely related not only to mathematical foundations but also to market participant psychological factors. When many traders are conscious of the same Fibonacci levels, trading pressure concentrates at those levels, realizing price reversals through self-fulfilling aspects.
Understanding these psychological factors enables more accurate prediction of price reactions at Fibonacci levels. Particularly before and after important economic events or news announcements, market participant attention tends to concentrate on Fibonacci levels, with clearer price reactions tending to be observed.
Continuous Learning and Improvement
Mastering Auto Fib Retracement requires continuous learning and accumulation of practical experience. Adjusting analytical methods according to market environment changes and continuing learning from new market data is necessary.
TradingView's community shares insights on Fibonacci analysis from traders worldwide, helping discover new methods and ideas. Additionally, regular strategy reviews and improvements enable maintaining effective analysis systems adapted to changing market environments.
Conclusion
Auto Fib Retracement is a powerful tool that significantly streamlines price analysis and investment decisions in cryptocurrency trading while improving accuracy. By utilizing both mathematical foundations based on Fibonacci sequences and psychological factors of market participants, market movements that traditional analytical methods cannot capture can be understood.
Automation functionality minimizes errors from subjective judgment and enables more objective, reproducible analysis. Through multi-timeframe analysis, combinations with other technical indicators, and integration with appropriate risk management, comprehensive and effective trading strategies can be built.
What's important is not overconfidently viewing Auto Fib Retracement as an omnipotent tool, but positioning it as part of comprehensive market analysis and optimizing through continuous learning and improvement. By flexibly responding to market environment changes and constantly incorporating new insights, stable long-term investment results can be achieved.
For those who wish to learn Pine Script programming more deeply, please utilize TradingView's Pine Script Official Reference.
Disclaimer
The design, implementation, operation of automated trading systems and related financial transactions should all be judged and executed at the user's own discretion and responsibility. The author and the publication medium (Qiita) assume no legal or financial responsibility for any damages or losses arising from these activities.
This article is intended to provide information based on the author's technical verification and operational experience with TradingView and Pine Script. While efforts have been made regarding the accuracy and completeness of the content, its validity and applicability are not guaranteed.
Since market trading inherently involves risks, it is recommended to conduct sufficient backtesting and risk assessment before actual capital investment, and to seek professional advice when necessary.
Please utilize this article after fully understanding and agreeing to the above matters.