In cryptocurrency trading, one of the biggest challenges individual investors face is understanding the movements of institutional investors and whales (large investors). Since the trading behavior of these large participants has decisive influence on overall market direction, early detection of their movements can provide significant advantages. The Accumulation Distribution Line (ADL) serves as a powerful analytical tool for this purpose.
For those who want to learn more about detailed Pine Script features, please check TradingView's Pine Script Official Reference.
Accumulation Distribution (ADL) is a volume analysis indicator developed by Marc Chaikin that quantifies money inflow and outflow through the relationship between price and volume. High-performance platforms like TradingView can instantly execute these complex calculations, enabling visual understanding of institutional investor accumulation and distribution phases.
Basic Principles and Calculation Mechanism of ADL
The core of the Accumulation Distribution Line lies in analyzing where within the range prices closed during each trading period, combined with the volume at that time. When prices close near the high, this indicates strong buying pressure, and that period's volume is treated as accumulation. Conversely, when prices close near the low, this indicates strong selling pressure and is interpreted as distribution.
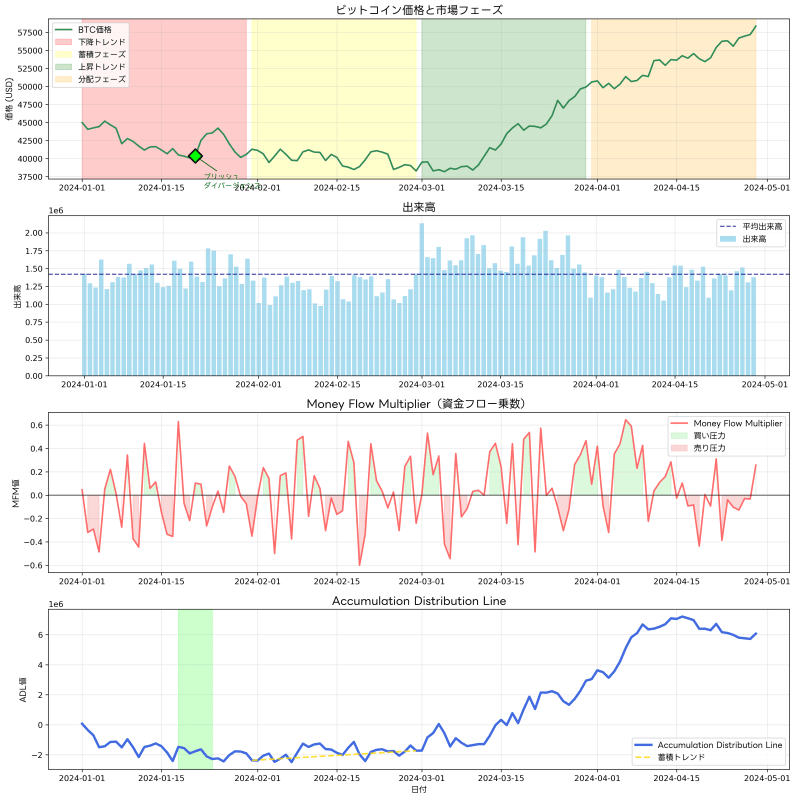
The specific calculation begins with computing the Money Flow Multiplier. This multiplier is calculated as ((Close - Low) - (High - Close)) / (High - Low), taking values ranging from -1 to +1. When this value is positive, it indicates buying pressure is dominant; when negative, it represents dominant selling pressure. Next, by multiplying this multiplier by the period's volume, the Money Flow Volume is calculated. Finally, by adding the Money Flow Volume to the previous period's ADL value, the current ADL value is obtained.
This cumulative calculation method enables ADL to capture long-term money flows without being misled by short-term price movements, making it possible to understand essential market supply and demand balance. Particularly in cryptocurrency markets where price manipulation and temporary speculative movements frequently occur, this ability to read fundamental supply and demand is extremely important.
Special Value of ADL in Cryptocurrency Markets
Cryptocurrency markets have unique characteristics compared to traditional financial markets, including 24-hour trading, high volatility, and regulatory uncertainty. In such environments, the importance of technical analysis increases beyond traditional levels, and understanding institutional investor movements becomes a critical issue for individual investors. ADL provides effective solutions to such challenges.
Observing ADL on TradingView's BTCUSD chart, you can often see ADL direction changes preceding major price turning points. This suggests institutional investors act earlier than general investors, meaning ADL captures such early movements.
Particularly for high-liquidity cryptocurrencies like Bitcoin, the impact of large investor trading on prices is tremendous. When they enter accumulation phases, even if prices continue declining or moving sideways in the short term, ADL may show upward trends. Conversely, during distribution phases, even when prices are rising, ADL may decline, and these divergences become important signals.
Divergence Analysis and Early Warning Systems
One of ADL's most powerful applications is divergence analysis with prices. Bullish divergence refers to situations where prices are making new lows while ADL remains at higher levels than previous lows. This indicates that although prices appear to be declining superficially, institutional investor accumulation is actually progressing, foreshadowing near-future price reversals.
Conversely, bearish divergence occurs when prices are making new highs while ADL remains below previous highs. This indicates price rises are not supported by institutional investor buying, suggesting uptrend endings and distribution phase beginnings.
Such divergence analysis can detect subtle market changes that cannot be captured by traditional price-based analysis, and particularly in volatile markets like cryptocurrencies, it's extremely valuable from a risk management perspective. By utilizing ADL as an early warning system, it becomes possible to avoid large losses and identify timing for advantageous position building.
Accumulation and Distribution Phase Analysis
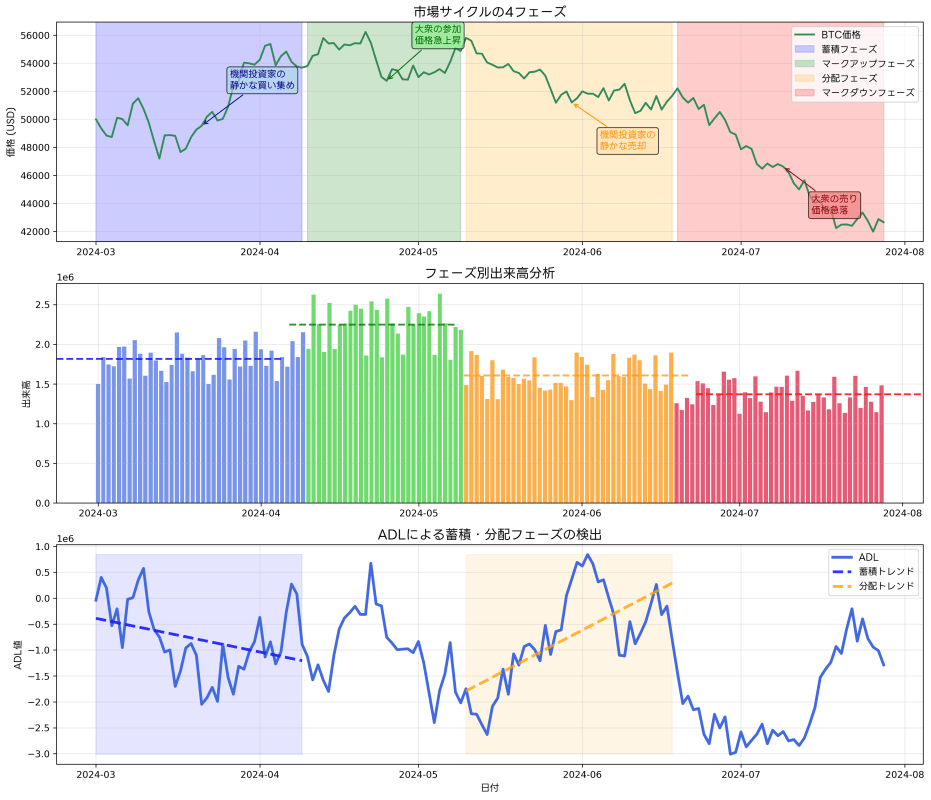
Institutional investor behavior can generally be divided into four phases: accumulation, markup, distribution, and markdown. ADL excels particularly at clearly identifying accumulation and distribution phases.
During accumulation phases, institutional investors build large positions over time without significantly moving market prices. During this period, while prices often move within relatively narrow ranges, ADL continues steadily rising. This indicates institutional investors are quietly accumulating without drawing market attention.
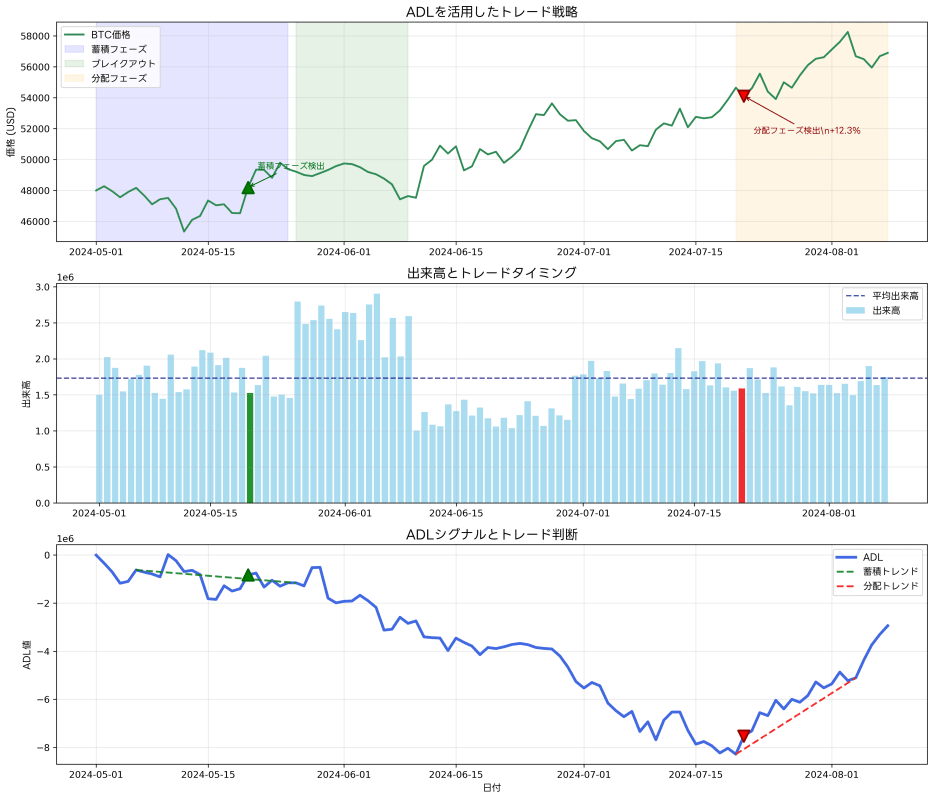
Distribution phases are the opposite of accumulation phases, representing periods when institutional investors release held positions to the market. While prices move in high ranges, ADL gradually begins declining, eventually indicating distribution completion prior to price declines. Early identification of this phase enables avoiding high-price purchases and closing positions at appropriate timing.
Advanced ADL Implementation with Pine Script
In addition to basic ADL calculations, customization to improve signal accuracy is important for practical trading application. Using TradingView's Pine Script, ADL indicators incorporating unique analytical logic can be created.
//@version=5
indicator("Advanced Accumulation Distribution", shorttitle="Advanced ADL", overlay=false)

// Parameter settings
use_custom_calculation = input.bool(true, title="Use Custom Calculation")
smoothing_period = input.int(21, title="Smoothing Period", minval=1)
divergence_lookback = input.int(50, title="Divergence Detection Period", minval=10)

// Basic ADL calculation
money_flow_multiplier = ((close - low) - (high - close)) / (high - low)
money_flow_volume = money_flow_multiplier * volume
adl = ta.cum(money_flow_volume)

// Smoothed ADL
smoothed_adl = ta.sma(adl, smoothing_period)

// Divergence detection
price_higher_high = ta.highest(high, divergence_lookback) == high
price_lower_low = ta.lowest(low, divergence_lookback) == low
adl_higher_high = ta.highest(adl, divergence_lookback) == adl
adl_lower_low = ta.lowest(adl, divergence_lookback) == adl

bearish_divergence = price_higher_high and not adl_higher_high
bullish_divergence = price_lower_low and not adl_lower_low

// Plotting
plot(adl, title="ADL", color=color.blue, linewidth=2)
plot(smoothed_adl, title="Smoothed ADL", color=color.orange, linewidth=1)

// Divergence display
plotshape(bearish_divergence, title="Bearish Divergence",
          style=shape.triangledown, location=location.top, color=color.red, size=size.small)
plotshape(bullish_divergence, title="Bullish Divergence",
          style=shape.triangleup, location=location.bottom, color=color.green, size=size.small)

// Background color emphasis
bgcolor(bearish_divergence ? color.new(color.red, 90) : na)
bgcolor(bullish_divergence ? color.new(color.green, 90) : na)
This script incorporates smoothing processing and divergence detection functions in addition to basic ADL calculations. Using the Pine Script Editor for further customization enables creating tools optimized for individual trading styles.
Integrated Analysis with Other Volume Indicators
To improve ADL analysis accuracy, combinations with other volume-related indicators are effective. By using indicators like On-Balance Volume (OBV) or Volume Price Trend (VPT) in conjunction, market money flows can be analyzed from multiple perspectives.
Particularly when both ADL and OBV show the same direction, signal reliability significantly improves. Conversely, when both indicators show different directions, this suggests high market uncertainty, requiring more cautious approaches.
TradingView's indicator library also publishes numerous scripts for streamlining such multi-indicator combination analysis, enabling construction of practical analytical environments.
Timeframe-Specific Analysis and Strategic Applications
Effective ADL utilization requires appropriate timeframe selection. For short-term trading, 1-hour or 4-hour analysis is effective, but to capture institutional investors' genuine accumulation or distribution phases, long-term analysis using daily or weekly charts is essential.
By confirming ADL's long-term trends on TradingView's weekly charts, you can determine whether current markets are in accumulation or distribution phases. Based on this information, overall portfolio strategies can be adjusted and risk levels appropriately managed.
For short-term trading, hierarchical approaches where daily ADL trends serve as background for determining entry and exit timing on shorter timeframes are effective. When long-term trends and short-term signals align, trade success probability significantly improves.
Application to Risk Management and Position Adjustment
In risk management using ADL, dynamically adjusting position sizes and holding periods according to market money flow conditions is important. During accumulation phases, more aggressive positions can be taken due to institutional investor buying support. Conversely, during distribution phases, since predicting when large selling will enter markets is difficult, position sizes should be reduced with more frequent profit-taking.
Particularly when ADL shows bearish divergence, even if prices are making new highs, distribution may be progressing, so new buy positions should be avoided and partial profit-taking on existing positions should be considered. Conversely, when bullish divergence occurs, temporary price declines can be viewed as additional buying opportunities.
Correlation Between Market Cycles and ADL
Cryptocurrency markets have clear cycles, and ADL is known to show strong correlation with these cycles. By analyzing relationships with Bitcoin halving cycles or shorter-term seasonality, ADL signal interpretation accuracy can be improved.
Historical data analysis shows that before major bull market beginnings, long-term accumulation phases almost invariably exist. During these periods, while prices often continue sideways or gradual declines, ADL continues steadily rising, indicating continuous institutional investor accumulation.
Advanced Analysis Techniques and Practical Applications
To further sophisticate ADL analysis, comparative analysis of ADL across multiple cryptocurrencies is also effective. When Bitcoin's ADL is rising while altcoin ADL is declining, this suggests money flowing from altcoins to Bitcoin. Understanding such money flows enables more effective portfolio construction.
Additionally, utilizing TradingView's alert features to automatically notify ADL breakouts at important levels or divergence occurrences is also important. In cryptocurrency markets that move continuously 24 hours, such automatic monitoring systems are essential for preventing missed trading opportunities.
Practical Operation Guidelines
When applying ADL to actual trading, several important considerations exist. First, since ADL also has characteristics as a lagging indicator, waiting too long for signal confirmation may result in prices having already moved significantly. Therefore, this risk must be mitigated through combinations with other leading indicators or partial position construction.
Additionally, since volume quality directly affects ADL accuracy, using data from reliable exchanges is important. By utilizing TradingView's integrated data, more comprehensive analysis integrating information from multiple exchanges becomes possible.
Continuous Learning and Adaptation
To master ADL, continuous learning and practice are essential. Parameter adjustments and introduction of new analytical methods must be continuously performed according to changing market conditions. Particularly since the environment surrounding cryptocurrency markets is rapidly changing due to regulatory changes and new financial product introductions, flexible adaptation capabilities are required.
Additionally, since institutional investor behavior patterns also change with market maturation, it's important to continuously update analytical methods based on new data rather than adhering to past patterns.
Conclusion
The Accumulation Distribution Line (ADL) is a powerful tool for understanding institutional investor movements in cryptocurrency trading. By quantifying money flows through price and volume relationships, it can capture essential market changes that tend to be missed by traditional price-only analysis.
Through divergence analysis, accumulation/distribution phase identification, and combinations with other indicators, more accurate investment decisions become possible. Particularly through utilization considering cryptocurrency market specialties, individual investors can predict institutional investor movements and build advantageous positions.
However, rather than overconfidently viewing ADL as an omnipotent indicator, positioning it as part of comprehensive market analysis and combining it with appropriate risk management is key to success. Through continuous learning and practice, maximize this powerful tool's utilization and improve cryptocurrency trading skills.
For those who wish to learn Pine Script programming more deeply, please utilize TradingView's Pine Script Official Reference.
Disclaimer
The design, implementation, operation of automated trading systems and related financial transactions should all be judged and executed at the user's own discretion and responsibility. The author and the publication medium (Qiita) assume no legal or financial responsibility for any damages or losses arising from these activities.
This article is intended to provide information based on the author's technical verification and operational experience with TradingView and Pine Script. While efforts have been made regarding the accuracy and completeness of the content, its validity and applicability are not guaranteed.
Since market trading inherently involves risks, it is recommended to conduct sufficient backtesting and risk assessment before actual capital investment, and to seek professional advice when necessary.
Please utilize this article after fully understanding and agreeing to the above matters.