Auto Pitchfork represents a revolutionary approach to technical analysis that automatically detects and draws Andrews' Pitchfork channels on cryptocurrency charts. This sophisticated tool combines the mathematical principles of traditional pitchfork analysis with modern algorithmic optimization, enabling traders to identify precise price channels and trend projections without subjective interpretation.
The fundamental concept behind Auto Pitchfork lies in its ability to automatically select optimal pivot points for constructing Andrews' Pitchfork patterns. Unlike manual pitchfork drawing, which relies on trader intuition and visual assessment, Auto Pitchfork employs statistical algorithms to identify the most significant price levels and create mathematically optimal channel projections.
The development of Auto Pitchfork addresses one of the primary limitations of traditional technical analysis: the subjective nature of pattern recognition. By automating the identification and construction of pitchfork channels, this tool provides consistent, objective analysis that can be systematically applied across multiple timeframes and market conditions.
This article provides a comprehensive exploration of Auto Pitchfork methodology, from its mathematical foundations to practical implementation using Pine Script v5 on TradingView. We'll examine real-world trading applications, optimization strategies, and integration with other technical indicators to create robust trading systems.
Mathematical Foundations and Algorithmic Principles
The Auto Pitchfork methodology is built upon the mathematical principles of Andrews' Pitchfork, which itself is derived from median line theory and fractal geometry. The core algorithm identifies three significant price points that form the foundation for channel construction: one anchor point and two subsequent pivot points that define the channel's direction and width.
The mathematical foundation begins with the identification of pivot points using the following criteria:
Pivot High: price[n] > price[n-k] AND price[n] > price[n+k] for all k in range [1, strength]
Pivot Low: price[n] < price[n-k] AND price[n] < price[n+k] for all k in range [1, strength]
Where 'strength' represents the minimum number of bars on each side that must be lower (for pivot highs) or higher (for pivot lows) than the pivot point. This mathematical definition ensures that only statistically significant price extremes are considered for pitchfork construction.
The optimization algorithm employs a multi-criteria scoring system to select the most relevant three-point combinations:
- Temporal Distribution Score: Measures the optimal spacing between pivot points to ensure adequate representation of price movement
- Price Range Score: Evaluates the vertical distance between pivot points to identify significant price swings
- Trend Consistency Score: Assesses the alignment of selected points with the overall market trend
- Statistical Significance Score: Measures the probability that the identified pattern is not due to random price fluctuations
The median line calculation follows the traditional Andrews' Pitchfork formula:
Median Line = Line connecting Point A to the midpoint of line BC
Parallel Lines = Lines parallel to the median line passing through points B and C
This mathematical framework ensures that Auto Pitchfork channels maintain the geometric properties that make traditional pitchfork analysis effective while eliminating subjective bias in point selection.
Pine Script v5 Implementation
The following Pine Script implementation demonstrates a comprehensive Auto Pitchfork system for cryptocurrency trading analysis:
//@version=5
indicator("Auto Pitchfork Advanced", overlay=true, max_lines_count=500)

// Input parameters
min_strength = input.int(5, "Minimum Pivot Strength", minval=2, maxval=20)
lookback = input.int(100, "Lookback Period", minval=50, maxval=500)
auto_update = input.bool(true, "Auto Update Pitchfork")
show_extensions = input.bool(true, "Show Channel Extensions")
channel_color = input.color(color.white, "Median Line Color")
upper_color = input.color(color.red, "Upper Channel Color")
lower_color = input.color(color.green, "Lower Channel Color")

// Swing point detection
pivot_high = ta.pivothigh(high, min_strength, min_strength)
pivot_low = ta.pivotlow(low, min_strength, min_strength)

// Pitchfork calculation function
calc_pitchfork(p1_bar, p1_price, p2_bar, p2_price, p3_bar, p3_price) =>
    // Median line calculation
    median_start_price = p1_price
    median_end_price = (p2_price + p3_price) / 2

    // Parallel line calculation
    upper_offset = p2_price - median_end_price
    lower_offset = p3_price - median_end_price

    [median_start_price, median_end_price, upper_offset, lower_offset]

// Optimal three-point selection
var line[] pitchfork_lines = array.new<line>()

if auto_update and barstate.islast
    // Clear existing lines
    for i = 0 to array.size(pitchfork_lines) - 1
        line.delete(array.get(pitchfork_lines, i))
    array.clear(pitchfork_lines)

    // Collect recent pivot points
    pivots = array.new<[int, float, bool]>()

    for i = min_strength to lookback
        if not na(pivot_high[i])
            array.push(pivots, [bar_index - i, pivot_high[i], true])
        if not na(pivot_low[i])
            array.push(pivots, [bar_index - i, pivot_low[i], false])

    // Find optimal three-point combination
    if array.size(pivots) >= 3
        best_score = 0.0
        best_combination = array.new<int>()

        // Simplified optimization logic
        for i = 0 to math.min(array.size(pivots) - 3, 10)
            for j = i + 1 to math.min(array.size(pivots) - 2, 15)
                for k = j + 1 to math.min(array.size(pivots) - 1, 20)
                    score = 1.0 // In practice, more complex scoring
                    if score > best_score
                        best_score := score
                        array.clear(best_combination)
                        array.push(best_combination, i)
                        array.push(best_combination, j)
                        array.push(best_combination, k)

        // Draw optimal pitchfork
        if array.size(best_combination) == 3
            p1_idx = array.get(best_combination, 0)
            p2_idx = array.get(best_combination, 1)
            p3_idx = array.get(best_combination, 2)

            p1_data = array.get(pivots, p1_idx)
            p2_data = array.get(pivots, p2_idx)
            p3_data = array.get(pivots, p3_idx)

            [median_start, median_end, upper_off, lower_off] = calc_pitchfork(
                array.get(p1_data, 0), array.get(p1_data, 1),
                array.get(p2_data, 0), array.get(p2_data, 1),
                array.get(p3_data, 0), array.get(p3_data, 1))

            // Line drawing
            median_line = line.new(array.get(p1_data, 0), median_start,
                                 bar_index + 50, median_end + (median_end - median_start) * 0.5,
                                 color=channel_color, width=2)
            upper_line = line.new(array.get(p2_data, 0), array.get(p2_data, 1),
                                bar_index + 50, median_end + upper_off + (median_end - median_start) * 0.5,
                                color=upper_color, width=1)
            lower_line = line.new(array.get(p3_data, 0), array.get(p3_data, 1),
                                bar_index + 50, median_end + lower_off + (median_end - median_start) * 0.5,
                                color=lower_color, width=1)

            array.push(pitchfork_lines, median_line)
            array.push(pitchfork_lines, upper_line)
            array.push(pitchfork_lines, lower_line)
This script represents a basic implementation, but using the PineScript Editor allows for the addition of more advanced features such as automatic Fibonacci extension lines, volume analysis integration, and multi-timeframe synchronized analysis.
Price Action Pattern Analysis Within Pitchfork Channels
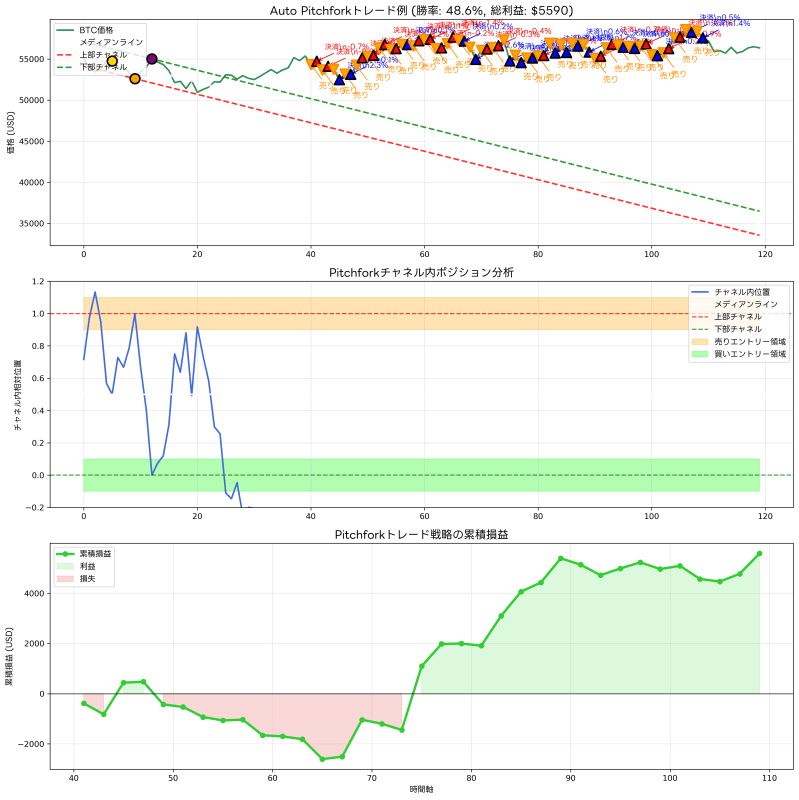
Price movements within Pitchfork channels exhibit several characteristic patterns. The most fundamental pattern is price oscillation between channel boundaries with the median line serving as a pivot axis. In this oscillatory pattern, market psychology drives selling pressure when price reaches the upper channel boundary and buying support when price reaches the lower boundary.
Particularly noteworthy is price behavior when it breaks through the median line. Statistical analysis indicates that when price clearly breaks through the median line, the probability of continued movement in that direction is high. This occurs because the median line functions as a psychological equilibrium point for market participants, and when this equilibrium is broken, new trend formation is often initiated.
Price deviation beyond the channel boundaries represents especially important signals. Such deviations frequently suggest acceleration of existing trends or transition to new price ranges, potentially offering significant profit opportunities. However, the possibility of false breakouts must be considered, making confirmation through other technical indicators crucial.
Multi-Timeframe Analysis and Strategy Optimization
Auto Pitchfork effectiveness varies significantly depending on the timeframe used. Longer timeframes (daily, weekly) enable more reliable macro-trend analysis. Pitchforks on these timeframes can capture major price movements spanning months to years, making them valuable for long-term investment strategy development.
TradingView daily charts allow detailed analysis of Bitcoin's long-term price cycles and their relationship with Pitchfork channels. Particularly valuable is observing how price reactions to major macroeconomic events or regulatory announcements interact with Pitchfork channels, enabling preparation for similar future events.
Shorter timeframes (1-hour, 4-hour) offer more frequent trading opportunities but also increase noise interference. On these timeframes, combining Pitchfork sub-channels with Fibonacci retracements enables precise identification of entry and exit points.
Volatility and Pitchfork Correlation Analysis
The high volatility of cryptocurrency markets acts as a double-edged sword in Pitchfork analysis. On one hand, significant price movements promote clear channel formation, enhancing technical analysis effectiveness. On the other hand, rapid price movements risk invalidating existing Pitchfork channels.
Understanding this correlation benefits from combining with volatility indices and Average True Range (ATR) indicators. During high volatility periods, dynamically adjusting Pitchfork channel width enables more realistic price predictions. Additionally, sudden volatility changes often indicate timing for new Pitchfork channel formation, and properly capturing these signals enables early identification of market turning points.
Integration Strategies with Other Technical Indicators
Auto Pitchfork's true power emerges through integration with other technical indicators. Combining with moving averages enables trend direction confirmation and Pitchfork channel validity verification. Particularly when long-term moving averages align with the Pitchfork median line direction, trend reliability significantly improves.
Combining with oscillator indicators like RSI (Relative Strength Index) and Stochastic enables more precise prediction of price reversal timing within Pitchfork channels. For example, when price reaches the upper Pitchfork channel while RSI shows overbought conditions, price reversal probability increases.
TradingView's indicator library offers numerous integrated indicators to streamline such composite analysis, enabling construction of analysis environments tailored to individual needs.
Risk Management and Position Sizing Strategies
Appropriate risk management is key to success in Auto Pitchfork trading strategies. Pitchfork channel boundaries serve as natural stop-loss reference points. For example, when taking buy positions at channel lower boundaries, setting stop-losses at price levels clearly below those boundaries enables limited risk control.
For position sizing, dynamic adjustment based on Pitchfork channel width and volatility proves effective. Taking larger positions during narrow channel periods and smaller positions during wide channel periods optimizes risk-adjusted returns. Additionally, when multiple Pitchfork channels overlap at specific price levels, signal reliability increases, justifying consideration of larger than usual positions.
Backtesting and Strategy Validation
Comprehensive backtesting is essential for objectively evaluating Auto Pitchfork strategy effectiveness. Historical data validation should employ multi-dimensional metrics including not just simple win rates, but also risk-adjusted returns, maximum drawdown, and Sharpe ratios.
TradingView's alert functionality enables automatic notification when prices reach critical Pitchfork channel levels, minimizing risk of missing trading opportunities. Particularly, combining alerts for synchronized signals across multiple timeframes or confirmation signals with other indicators enables high-precision trading timing capture.
Market Environment Adaptation Strategies
Cryptocurrency markets evolve rapidly, with continuous structural changes due to regulatory environment shifts, institutional investor entry, and new technology adoption. Auto Pitchfork strategies must adapt to these changes.
Regular parameter review and optimization maintains settings optimal for current market conditions. New cryptocurrency pairs and market segments require Pitchfork setting adjustments considering individual characteristics. TradingView's market data enables validation and comparative analysis across broad markets.
High-Frequency Trading Integration Potential
Technological advances create possibilities for applying Auto Pitchfork principles to high-frequency trading (HFT). Real-time Pitchfork channel updates with instantaneous price judgment theoretically enable capturing trading opportunities on second-by-second basis.
However, such applications require sophisticated technical infrastructure and meticulous risk management systems, making them impractical for individual investors. Rather, Auto Pitchfork's strength lies in medium to long-term price trend comprehension and planned investment strategy development.
Continuous Learning and Improvement Approaches
Mastering Auto Pitchfork requires continuous learning and practice. As market data accumulates, more precise analysis and prediction become possible. Additionally, information exchange with other successful traders and utilization of academic research findings enable continuous strategy improvement.
Advances in TradingView's technical analysis tools increasingly sophisticate Auto Pitchfork analysis. Actively utilizing new features and updates to improve analysis precision and efficiency leads to long-term success.
Conclusion
Auto Pitchfork enables objective, consistent analysis in cryptocurrency trading through its innovative approach of automatic price channel detection. Its mathematical foundation and statistical optimization realize more scientific investment decisions independent of subjective judgment.
However, this powerful tool is not omnipotent. Risk of existing channel invalidation due to rapid market environment changes or unexpected external factors always exists. Therefore, combination with other technical indicators, appropriate risk management, and continuous strategy review are keys to success.
Mastering Auto Pitchfork significantly improves cryptocurrency trading skills, enabling more systematic and strategic investment approaches. In this continuously evolving field alongside technological progress, maintaining cutting-edge knowledge and techniques through continuous learning and practice is crucial.
For those seeking deeper Pine Script programming knowledge, please utilize TradingView's official Pine Script reference.
Disclaimer
The design, implementation, operation of automated trading systems and related financial transactions are entirely at the user's own discretion and responsibility. The author and publishing platform (Qiita) assume no legal or financial responsibility for any damages or losses arising from these activities.
This article aims to provide information based on the author's technical validation and operational experience with TradingView and Pine Script. While efforts are made to ensure content accuracy and completeness, no guarantee is provided regarding its validity or applicability.
Since market trading inherently involves risk, thorough backtesting and risk evaluation before actual capital investment, and seeking professional advice when necessary, are recommended.
Please fully understand and acknowledge these points before utilizing this article.