In cryptocurrency trading, accurate measurement and understanding of market volatility is essential for achieving proper risk management and profit maximization. By appropriately grasping price fluctuation ranges, all important trading decisions such as stop-loss level setting, position size determination, and profit target establishment can be made more precisely. One of the most reliable and practical indicators developed for this purpose is the Average True Range (ATR).
For more detailed Pine Script functionality, please refer to TradingView's official Pine Script reference.
ATR is an innovative technical indicator conceived by J. Welles Wilder Jr. in 1978 that measures the market's true volatility, which cannot be captured by simple high-low differences alone. Advanced platforms like TradingView can automate these complex calculations and display them in formats that allow traders to intuitively understand market conditions.
Basic Concept and Calculation Mechanism of ATR
Average True Range calculation adopts a much more sophisticated approach than traditional price range analysis. In conventional price volatility calculations, the simple difference between the day's high and low is used, but this method completely ignores the relationship with the previous day's close. However, in actual markets, large gaps frequently occur between the previous day's close and the current day's opening price, and especially in 24-hour traded markets like cryptocurrency markets, these gaps can significantly impact trading strategies.
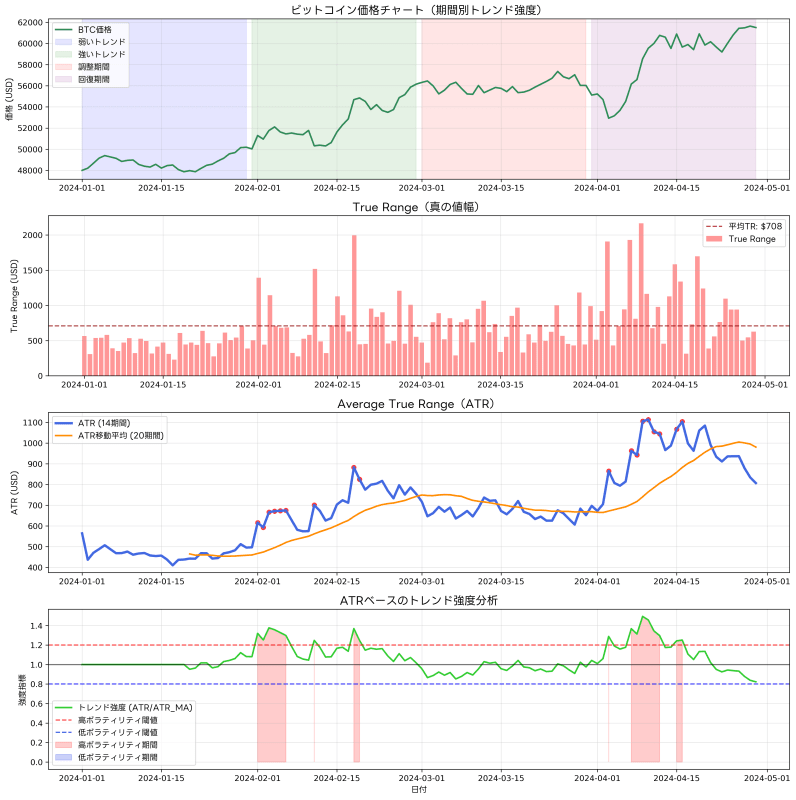
To solve this problem, ATR introduces the concept of True Range (TR). True Range is defined as the maximum of the following three values: first, the difference between the day's high and low; second, the absolute value of the difference between the day's high and the previous day's close; third, the absolute value of the difference between the day's low and the previous day's close. By comparing these three values, the true range of price movement can be accurately captured.
For example, consider Bitcoin with a previous day's close of $50,000 that opens the next day at $48,000 and trades in a range from $47,500 to $49,500. Using conventional methods, the volatility would be calculated as $2,000 ($49,500-$47,500), but in True Range calculation, the $500 difference between the day's high and previous close ($50,000-$49,500) is also considered, providing a more accurate reflection of actual market movement.
ATR is the average of this True Range over a specified period (typically 14 periods). Initial ATR values are calculated as simple moving averages, but subsequently, smoothing techniques like Exponential Moving Average (EMA) are often used, placing greater weight on more recent price movements.
Special Importance of ATR in Cryptocurrency Markets
Since cryptocurrency markets exhibit extremely high volatility compared to traditional financial markets, the utility value of ATR becomes particularly significant. Bitcoin, Ethereum, and other altcoins frequently show price movements exceeding 10% in a single day. In such extreme volatility environments, fixed profit targets and stop-loss level settings are inefficient and can sometimes lead to significant opportunity losses or unexpected losses.
Analyzing TradingView's BTCUSD charts reveals that Bitcoin's ATR values fluctuate greatly according to market cycles. In bull markets, it can reach thousands of dollars, while in sideways markets, it may decline to just hundreds of dollars. Understanding and utilizing this volatility enables construction of adaptive trading strategies according to market environment.
Additionally, a unique characteristic of cryptocurrency markets is the extremely large impact that major exchange high-volume trading or news events have on prices. While predicting such sudden movements in advance is difficult, continuously monitoring ATR enables understanding of the current market's tendency for volatility range and implementing appropriate risk management accordingly.
Application to Dynamic Stop-Loss Strategies
One of ATR's most practical and effective applications is dynamic stop-loss setting. Traditional fixed stop-loss settings cannot respond to changes in market volatility, causing frequent stop-outs due to overly tight settings during low volatility periods and risking large losses due to overly wide settings during high volatility periods.
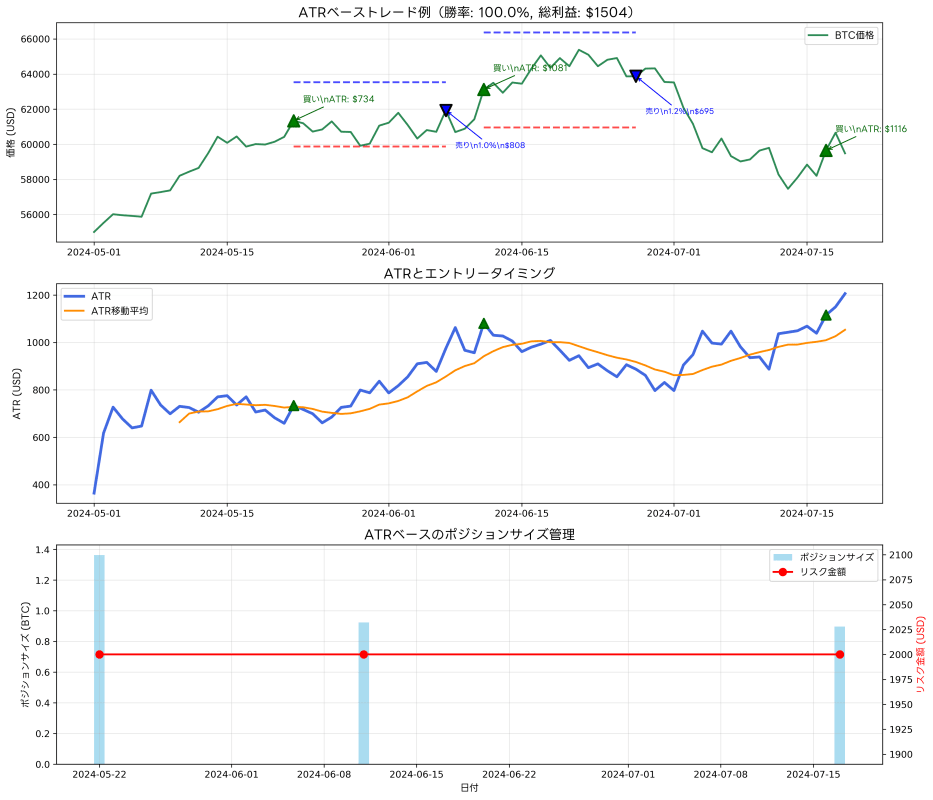
In ATR-based dynamic stop-loss strategies, stop-loss levels are set at prices calculated by subtracting multiples of current ATR values (typically 1.5 to 3 times) from entry prices. For example, if Bitcoin is purchased at $50,000 and the ATR at that time is $1,000, with a 2x setting, the stop-loss would be $48,000 ($50,000 - $1,000×2). This method avoids false stop-outs due to natural market fluctuations while appropriately limiting losses in truly dangerous situations.
As a more advanced strategy, there's the method of combining ATR with trailing stop-loss. By adjusting ATR-based stop-losses as prices move favorably, profits can be protected while maintaining positions as long as possible. This technique is extremely effective for maximizing utilization of large trend movements in cryptocurrency markets.
Integration with Position Sizing and Risk Management
ATR also plays an important role in position sizing. According to Van Tharp's renowned research, position sizing is the most important factor in investment success, having far greater impact than market prediction ability. By utilizing ATR, appropriate position sizes can be determined according to market volatility while maintaining consistent risk in each trade.
The basic ATR-based position sizing formula calculates position size by dividing acceptable loss amounts by ATR multiples. For example, if willing to lose 2% of total capital ($400 for $20,000) in one trade, with ATR at $1,000 and stop-loss multiple at 2x, position size would be 400÷($1,000×2) = 0.2 Bitcoin. This calculation automatically adjusts position sizes according to market volatility while maintaining consistent risk in each trade.
Strategic Utilization in Profit Target Setting
ATR is a highly valuable tool not only for stop-losses but also for profit target setting. One common mistake many traders make is setting fixed profit targets without considering market volatility. In low volatility environments, they set difficult-to-achieve targets, while in high volatility environments, they miss large profit opportunities due to overly conservative targets.
In ATR-based profit strategies, initial profit targets are set at prices calculated by adding ATR multiples to entry prices. TradingView's indicator library offers various scripts that automate such strategies, customizable according to individual needs.
As a more advanced strategy, utilizing ATR for partial profit-taking is also possible. Setting the first profit target at 1.5x ATR, second at 3x ATR, third at 5x ATR, and gradually reducing positions. This method reduces the risk of being satisfied with small profits while maximizing benefits when large trends occur.
ATR Strategy Implementation Using Pine Script
Implementing comprehensive trading strategies utilizing ATR with Pine Script reduces manual calculation burden and enables consistent trade execution.
//@version=5
strategy("ATR Dynamic Trading System", shorttitle="ATR DTS", overlay=true)

// ATR settings
atr_period = input.int(14, title="ATR Period", minval=1)
stop_multiplier = input.float(2.0, title="Stop Loss Multiplier", minval=0.1, step=0.1)
profit_multiplier = input.float(3.0, title="Profit Multiplier", minval=0.1, step=0.1)

// Risk management settings
risk_per_trade = input.float(2.0, title="Risk Per Trade (%)", minval=0.1, maxval=10.0, step=0.1) / 100
account_size = input.float(10000, title="Account Size ($)", minval=1000)

// ATR calculation
atr = ta.atr(atr_period)
atr_stop = atr * stop_multiplier
atr_profit = atr * profit_multiplier

// Entry conditions (example: moving average crossover)
fast_ma = ta.sma(close, 10)
slow_ma = ta.sma(close, 20)
long_condition = ta.crossover(fast_ma, slow_ma)

// Position size calculation
risk_amount = account_size * risk_per_trade
position_size = risk_amount / atr_stop

// Strategy execution
if long_condition and strategy.position_size == 0
    strategy.entry("Long", strategy.long, qty=position_size)
    strategy.exit("Exit", "Long", stop=close - atr_stop, limit=close + atr_profit)

// Display
plot(close + atr_profit, title="Profit Target", color=color.green, linewidth=1)
plot(close - atr_stop, title="Stop Loss", color=color.red, linewidth=1)
This script implements a basic ATR-based trading system and can be further customized in the Pine Script Editor.
ATR Interpretation According to Market Environment
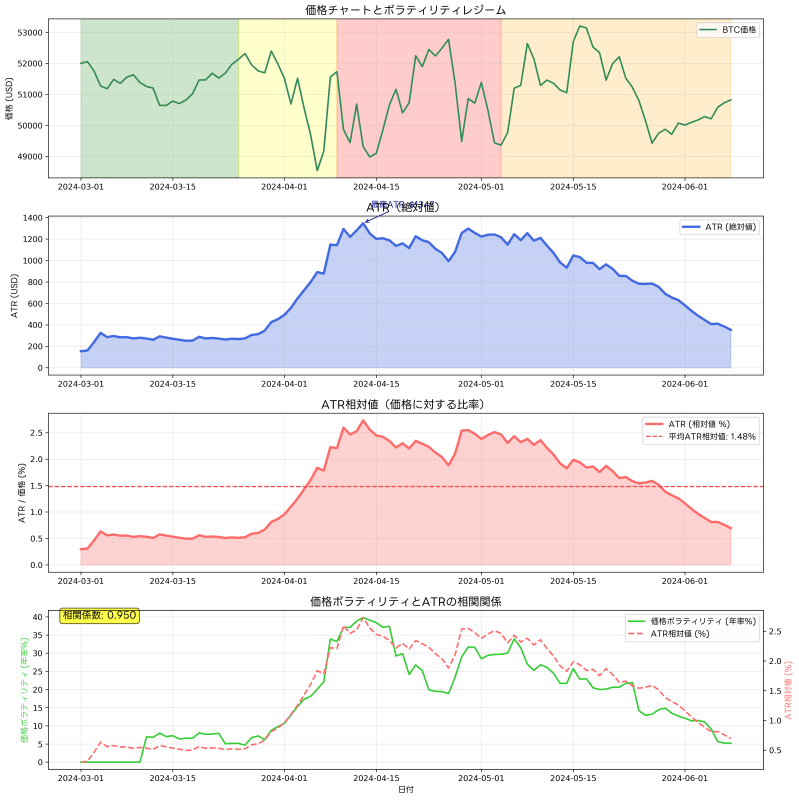
To accurately interpret ATR values, understanding current market environment is important. The same ATR value can have vastly different meanings depending on price levels and market cycle stages. For example, $1,000 ATR when Bitcoin is at $20,000 versus $1,000 ATR at $60,000 have completely different meanings on a percentage basis.
Therefore, monitoring relative ATR ratios (ATR÷Price×100) alongside absolute ATR values is recommended. This ratio enables fair comparison of volatility at different price levels and provides more useful information for long-term strategy planning.
Integrated Utilization with Other Technical Indicators
Rather than using ATR alone, combining it with other technical indicators enables construction of more comprehensive and reliable trading strategies. Combining with Bollinger Bands enables analysis of ATR behavior when prices are at statistically abnormal levels. Using with momentum indicators like RSI (Relative Strength Index) or MACD (Moving Average Convergence Divergence) enables deeper understanding of the relationship between trend strength and volatility.
Combining with volume analysis is also very effective. When high ATR values are accompanied by large volume, that volatility is based on broad market participant consensus and can be expected to persist. Conversely, when high ATR values are observed with low volume, it's likely temporary volatility requiring different strategic approaches.
Multi-layered ATR Analysis Across Different Timeframes
Conducting ATR analysis on a single timeframe risks overlooking the complex structure of markets. Using TradingView's multi-timeframe functionality enables simultaneous ATR analysis across multiple timeframes for more comprehensive market understanding.
For example, while daily ATR shows long-term trend strength, 1-hour ATR can be used for optimizing short-term entry timing. Weekly ATR is effective for understanding positioning within overall market cycles, while 15-minute ATR helps with precise risk management in scalping strategies.
The key is consistently integrating information from these different timeframes without contradiction. When upper timeframe ATR is expanding, lower timeframe volatility increases are likely precursors to major trend changes, requiring more cautious position management.
News Event and ATR Relationship Analysis
In cryptocurrency markets, various external factors like regulatory announcements, technical upgrades, and institutional investor entry news significantly impact prices. Analyzing ATR changes before and after these news events enables understanding market reaction patterns and more effective preparation for similar future events.
Generally, before important news announcements, market participant uncertainty increases and ATR may temporarily decline. This occurs because traders take wait-and-see approaches and trading volumes decrease. However, after news announcements, rapid ATR expansion is often observed, requiring different approaches from normal trading strategies during these periods.
Seasonality and ATR Pattern Analysis
Research shows that certain seasonal patterns exist in cryptocurrency markets throughout the year. For example, year-end holiday periods traditionally see decreased trading volumes and declining ATR. Conversely, quarter-ends and half-year ends may see increased institutional investor activity and ATR expansion.
Using TradingView's historical data to analyze long-term ATR patterns enables incorporating these seasonal variations into strategies. Particularly from a risk management perspective, adopting conservative position sizing during periods when ATR statistically tends to be high and more aggressive approaches during periods when it tends to be low becomes possible.
Advanced ATR Application Strategies
Experienced traders utilize ATR in more creative and advanced ways. For example, calculating moving averages of ATR and analyzing whether current ATR exceeds or falls below those moving averages enables predicting volatility expansion and contraction cycles. Additionally, calculating ATR Rate of Change (ROC) enables measuring volatility acceleration and earlier identification of market turning points.
As an even more advanced technique, comparing ATR across multiple cryptocurrencies enables evaluation of overall market risk environment. If Bitcoin's ATR remains stable while altcoin ATR rapidly expands, risk-off movements may be beginning, potentially requiring portfolio-wide risk adjustments.
Backtesting and Performance Optimization
Before actually operating ATR-based strategies, sufficient backtesting using historical data is essential. Using TradingView's Strategy Tester enables detailed analysis of strategy performance with various ATR parameters and multiplier settings.
In backtesting, evaluating comprehensive metrics beyond simple profit rates is important, including Sharpe Ratio (risk-adjusted returns), Maximum Drawdown, win rate, and average profit-to-average loss ratios. Particularly for ATR-based strategies where consistency across different market environments is important, individual analysis of performance in bull markets, bear markets, and sideways markets is recommended.
Psychological Aspects and ATR Utilization
Since ATR is an objective numerical indicator, it's extremely effective for eliminating emotional trading decisions. One problem many traders face is rational judgment being distorted by fear or greed, but setting clear ATR-based rules can minimize such psychological influences.
For example, setting a clear rule like "always execute stop-loss when losses exceed 2x ATR" prevents judgment errors from hopeful speculation that "it might recover if I wait a little longer." Similarly, a rule like "execute partial profit-taking when profits reach 3x ATR" avoids opportunity losses from excessive greed.
Conclusion
Average True Range (ATR) is one of the most practical and reliable technical indicators in cryptocurrency trading. By accurately measuring market volatility and enabling adaptive risk management based on it, trading consistency and profitability can be significantly improved.
Through dynamic stop-loss setting, scientific position sizing, rational profit target determination, and integrated utilization with other technical indicators, ATR becomes a core element of comprehensive trading strategies. The key is not overrelying on ATR as a standalone magic indicator, but appropriately positioning it as part of overall market analysis.
Through continuous learning and practice, and sufficient backtesting, deep understanding of ATR characteristics and establishing optimized utilization methods for individual trading styles and market environments will surely improve cryptocurrency trading skills and build pathways to long-term success.
For those seeking deeper Pine Script programming knowledge, please utilize TradingView's official Pine Script reference.
Disclaimer
The design, implementation, operation of automated trading systems and related financial transactions are entirely at the user's own discretion and responsibility. The author and publishing platform (Qiita) assume no legal or financial responsibility for any damages or losses arising from these activities.
This article aims to provide information based on the author's technical validation and operational experience with TradingView and Pine Script. While efforts are made to ensure content accuracy and completeness, no guarantee is provided regarding its validity or applicability.
Since market trading inherently involves risk, thorough backtesting and risk evaluation before actual capital investment, and seeking professional advice when necessary, are recommended.
Please fully understand and acknowledge these points before utilizing this article.