Accurately grasping market volatility in cryptocurrency trading is a crucial element directly connected to trading strategy success. If periods of large price fluctuation ranges can be detected in advance, appropriate position size adjustments and entry timing optimization become possible. Today we introduce ATR (Average True Range) volatility detection methods.
For those who want to learn more about detailed Pine Script features, please check TradingView's Pine Script Official Reference.
ATR is a technical indicator developed by J. Welles Wilder in 1978 that calculates the average of true price ranges over a specific period. Unlike general price ranges, ATR is characterized by its ability to measure market volatility more accurately by also considering the previous day's closing price. TradingView's chart platform provides many technical indicators including ATR as standard.
Basic Concepts and Calculation Methods of ATR
To understand ATR, you must first grasp the concept of "True Range." True Range refers to the largest of the following three values:
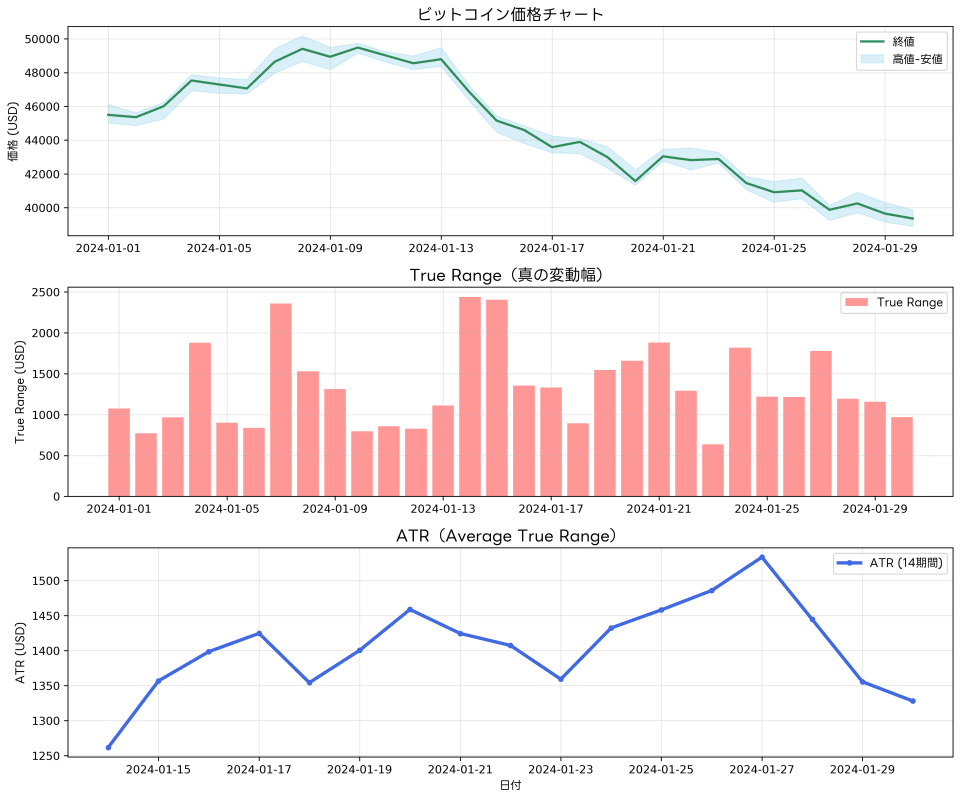
First, the value obtained by subtracting the day's low from its high. This is the most basic price range, representing the maximum price movement within a day. Second, the absolute value of subtracting the previous day's close from the current day's high. This shows the maximum value of how much prices rose from the previous day's close. Third, the absolute value of subtracting the previous day's close from the current day's low. This represents the maximum value of how much prices fell from the previous day's close.
The largest of these three values is adopted as the True Range, and averaging this over a specific period (usually 14 periods) becomes ATR. High ATR values mean high market volatility and violent price fluctuations. Conversely, when ATR values are low, this indicates low market volatility and gentle price movements.
Utilizing ATR for Volatility Detection
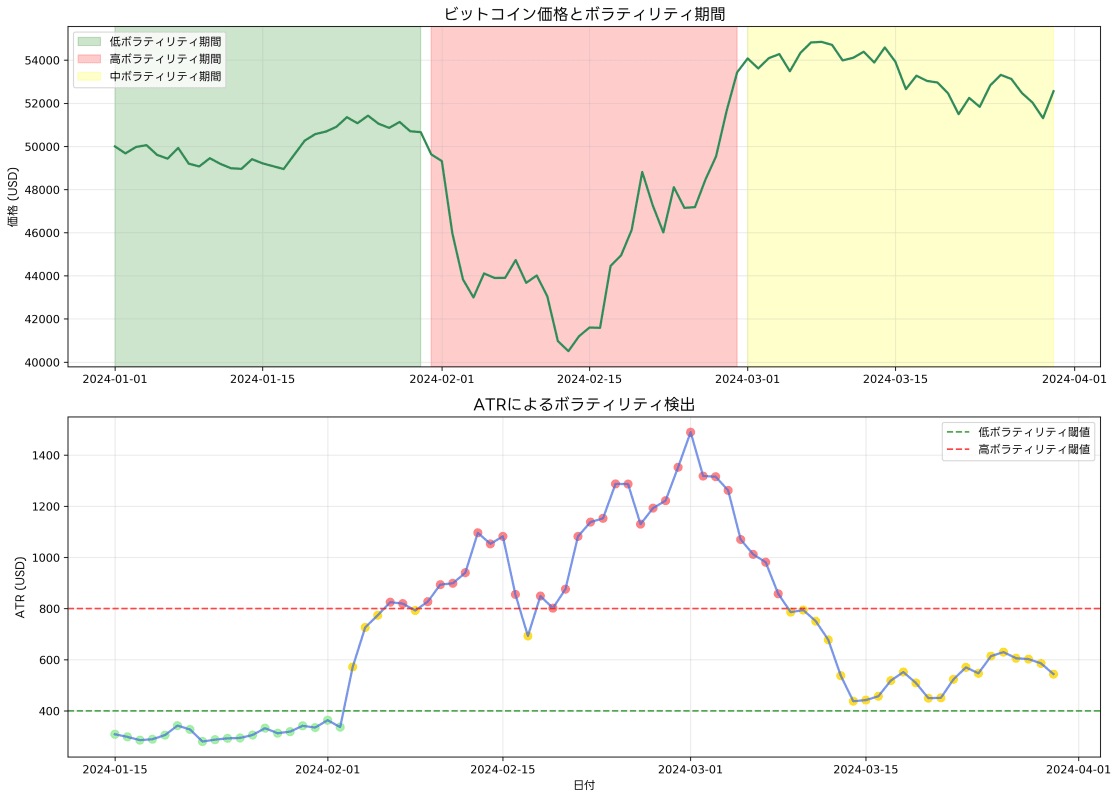
The most effective way to utilize ATR for volatility detection is comparing current ATR values with past values. For example, when current ATR values exceed the average of the past 20 periods by a certain percentage or more, volatility can be judged as expanding. This suggests the possibility that some important news or changes have occurred in the market, affecting investor psychology.
In cryptocurrency markets like Bitcoin, volatility often changes rapidly due to sudden news or large investor movements. If such situations can be detected in advance, this is extremely effective from a risk management perspective. During periods when ATR is rising sharply, making position sizes smaller than usual or setting stricter stop-losses can avoid unexpectedly large losses. On TradingView's BTCUSD chart, you can establish trading strategies while checking ATR values in real-time.
Additionally, ATR demonstrates greater effectiveness when combined with other technical indicators rather than used alone. For example, combining with Bollinger Bands enables more detailed analysis of volatility situations when prices break outside the bands. Combining with RSI also enables monitoring volatility changes during overbought or oversold conditions.
Implementing ATR Indicators with Pine Script
Let's create an ATR-based volatility detection indicator using TradingView's Pine Script. This indicator includes functions for visually displaying volatility states in addition to basic ATR calculations. Using the Pine Script Editor enables easy creation of customized technical indicators.
//@version=5
indicator("ATR Volatility Detection", shorttitle="ATR Vol", overlay=false)

// ATR settings
atr_length = input.int(14, title="ATR Period", minval=1)
vol_threshold = input.float(1.5, title="Volatility Threshold", minval=1.0, step=0.1)
smoothing_length = input.int(20, title="Smoothing Period", minval=1)

// ATR calculation
atr_value = ta.atr(atr_length)
atr_smooth = ta.sma(atr_value, smoothing_length)
vol_ratio = atr_value / atr_smooth

// Volatility state determination
high_vol = vol_ratio > vol_threshold
normal_vol = vol_ratio <= vol_threshold and vol_ratio > 0.8
low_vol = vol_ratio <= 0.8

// Chart plotting
plot(atr_value, title="ATR", color=color.blue, linewidth=2)
plot(atr_smooth, title="ATR Average", color=color.gray, linewidth=1)

// Volatility state background colors
bgcolor(high_vol ? color.new(color.red, 80) :
        normal_vol ? color.new(color.yellow, 90) :
        color.new(color.green, 90))

// Volatility ratio plotting
hline(vol_threshold, title="High Volatility Threshold", color=color.red, linestyle=hline.style_dashed)
hline(0.8, title="Low Volatility Threshold", color=color.green, linestyle=hline.style_dashed)

// Alert conditions
alertcondition(ta.crossover(vol_ratio, vol_threshold),
               title="High Volatility Warning",
               message="Volatility is expanding")

alertcondition(ta.crossunder(vol_ratio, 0.8),
               title="Low Volatility Warning",
               message="Volatility is contracting")
This script implements functionality for comparing current ATR values with past averages in addition to basic ATR calculations. When the volatility ratio exceeds the set threshold, the background color becomes red; within the normal range it's yellow; when low it's green. This enables grasping volatility situations at a glance. In TradingView's indicator library, you can find numerous similar volatility detection indicators.
Practical Trading Application Examples
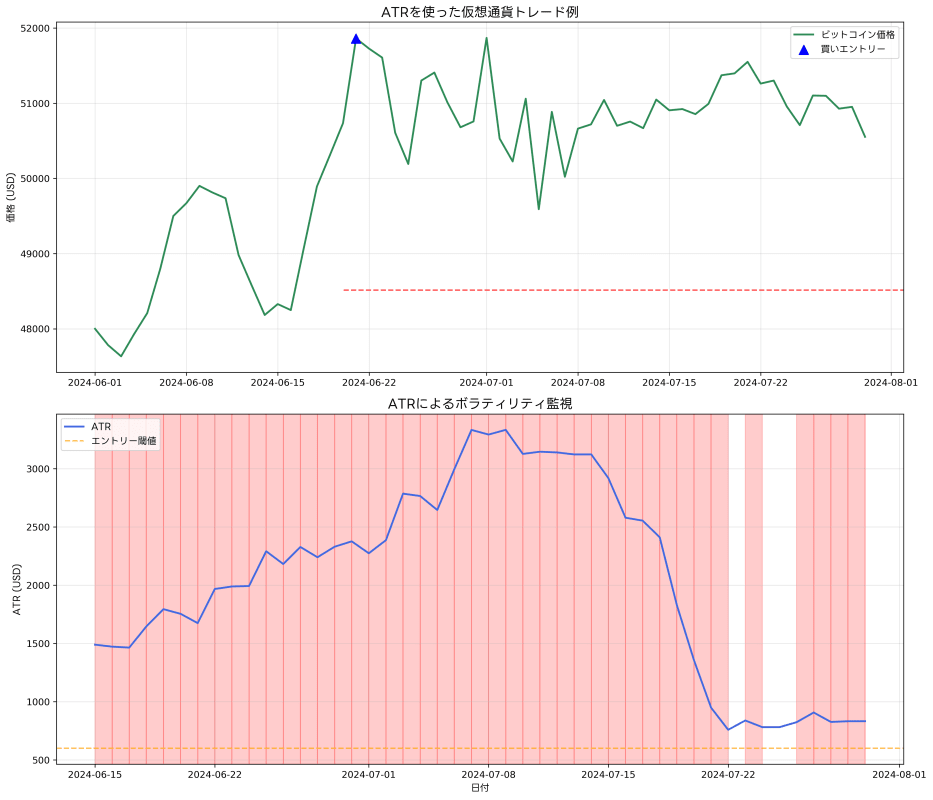
Let's consider specific examples of incorporating ATR volatility detection into actual trading strategies. When using ATR indicators on TradingView's BTCUSD daily chart, when normal ATR values are around $500 and sudden spikes exceeding $1000 are observed, this clearly indicates volatility expansion.
In such situations, first strengthen risk management for existing positions. Setting stop-loss widths to about twice the ATR prevents erroneous stop-outs from normal price fluctuations while preventing large losses. When considering new entries, also make position sizes smaller than usual and implement risk management corresponding to high volatility.
Conversely, when ATR continues declining over long periods, this indicates the market is in a deadlock state. Such periods can be viewed as preparation periods for breakout strategies. By capturing moments when volatility rapidly expands from low states and taking positions aligned with trend direction, large profits become possible. Using TradingView's alert features enables automatically receiving notifications when ATR values exceed specific thresholds.
Understanding Volatility Cycles
Understanding that market volatility has certain cycles is also important. Generally, volatility repeats contraction and expansion periods. During contraction periods, price fluctuation ranges become small and ATR values also decline. During this period, market participants are taking wait-and-see attitudes, waiting for important material announcements or events that will determine market direction.
Entering expansion periods, price movements become violent due to some trigger, and ATR values also spike. This period offers opportunities to aim for large profits, but simultaneously carries risks of large losses. Therefore, flexibly changing strategies according to volatility situations becomes the key to success.
ATR volatility detection enables early identification of these cycles and appropriate timing for position adjustments and strategy changes. Particularly in cryptocurrency markets, where volatility changes are more intense compared to traditional financial markets, the importance of such analytical methods becomes higher.
For those wanting to learn more about advanced implementations in Pine Script, you can check detailed function specifications and sample code in TradingView's Pine Script Official Reference.
Applications to Risk Management
The most important application field for ATR volatility detection is risk management. Traditional fixed stop-loss settings may not respond to market volatility changes. Using dynamic stop-losses based on ATR enables appropriate risk management according to market conditions.
For example, when holding long positions, set the stop-loss at a price subtracting twice the ATR value from the entry price. When ATR values change, stop-loss positions are adjusted accordingly. During high volatility periods, stop-loss widths become wider; during low volatility periods, widths become narrower. This realizes optimal risk management according to market conditions.
ATR is also effective in position sizing. While maintaining constant risk tolerance, position sizes can be adjusted according to volatility. Taking small positions during high volatility periods and large positions during low periods enables maximizing risk-adjusted returns.
Combinations with Other Indicators
Rather than using ATR alone, combining with other technical indicators enables more effective analysis. Combining with moving averages enables analyzing the relationship between trend strength and volatility. When ATR rises while strong trends are occurring, that trend can be judged as likely to continue. Using TradingView's technical analysis tools enables advanced analysis combining multiple indicators.
Combinations with oscillator-type indicators are also effective. Confirming overbought or oversold situations with indicators like RSI or MACD while simultaneously grasping volatility situations with ATR enables identifying more accurate entry and exit timing.
Combinations with volume indicators are also useful. When volatility expansion accompanying price movements and volume increases occur simultaneously, those movements can be judged as more reliable. Conversely, when volatility expands despite low volume, this can be considered likely temporary movement. TradingView's market data enables comprehensive analysis combining price and volume data.
Conclusion
ATR volatility detection is an extremely effective analytical method in cryptocurrency trading. By objectively quantifying market fluctuation conditions, rational decisions uninfluenced by emotions become possible. Particularly from risk management perspectives, it provides much more flexible and effective approaches than fixed methods.
What's important is not treating ATR as an omnipotent indicator, but utilizing it as part of comprehensive market analysis. By combining with other technical indicators and fundamental analysis, more reliable trading strategies can be constructed. Also, don't forget to regularly review parameters and adjust according to market environment changes.
By mastering ATR volatility detection, cryptocurrency trading skills will definitely improve, enabling more stable profits. Through continuous learning and practice, please maximize utilization of this powerful tool.
For those who wish to learn Pine Script programming more deeply, please utilize TradingView's Pine Script Official Reference.
Disclaimer
The design, implementation, operation of automated trading systems and related financial transactions should all be judged and executed at the user's own discretion and responsibility. The author and the publication medium (Qiita) assume no legal or financial responsibility for any damages or losses arising from these activities.
This article is intended to provide information based on the author's technical verification and operational experience with TradingView and Pine Script. While efforts have been made regarding the accuracy and completeness of the content, its validity and applicability are not guaranteed.
Since market trading inherently involves risks, it is recommended to conduct sufficient backtesting and risk assessment before actual capital investment, and to seek professional advice when necessary.
Please utilize this article after fully understanding and agreeing to the above matters.