In the cryptocurrency market, there are important aspects that can be overlooked when focusing only on individual asset analysis. This is the relationship of how much different cryptocurrencies move in correlation with each other. Market participants have all experienced phenomena such as altcoins falling similarly during Bitcoin's sharp declines, or currencies in specific sectors rising simultaneously. The Correlation Coefficient was developed to quantify such inter-asset correlations and apply them to investment strategies.
For more detailed PineScript functionality, please check the TradingView PineScript Official Reference.
Correlation coefficient is one of the basic concepts in statistics, expressing the strength and direction of linear relationships between two variables in a range from -1 to +1. On high-performance platforms like TradingView, these complex statistical calculations can be automated and displayed in visually understandable formats. In cryptocurrency trading, utilizing this correlation coefficient enables various advanced investment techniques such as measuring portfolio diversification effects, constructing pair trading strategies, and optimizing risk management.
Mathematical Foundation and Interpretation of Correlation Coefficient
Correlation Coefficient refers to Pearson's product-moment correlation coefficient in statistics. This coefficient measures the strength of linear relationships between two continuous variables, with values always falling within the range of -1 to +1. While the calculation formula is relatively complex, it essentially calculates the average of the products of standardized deviations for each variable.
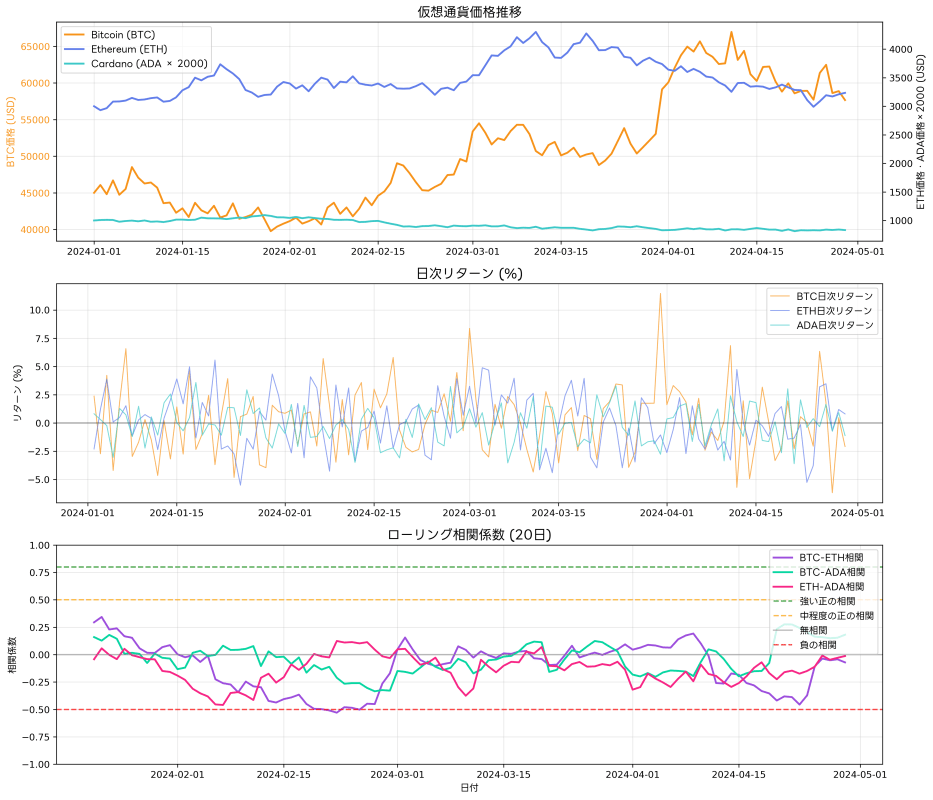
Interpreting correlation coefficient values is extremely important for investment decisions. Values close to +1 indicate perfect positive correlation, meaning when one asset rises, the other rises by a similar degree. Conversely, values close to -1 represent perfect negative correlation, showing a relationship where one rises as the other falls. Values close to 0 indicate no correlation, meaning there is no linear relationship between the two assets.
In cryptocurrency markets, an important characteristic is that correlation coefficient values change over time. During stable market periods, many altcoins show high positive correlation with Bitcoin, but these relationships can temporarily break down during market crises. Additionally, due to technological innovations or regulatory environment changes, long-term changes in correlation relationships between specific currency pairs are not uncommon.
Special Characteristics of Correlation Relationships in Cryptocurrency Markets
Cryptocurrency markets have unique correlation structures compared to traditional financial markets. The most prominent feature is Bitcoin's established position as "digital gold," causing many altcoins to be strongly influenced by Bitcoin's price movements. This phenomenon is called the "Bitcoin dominance effect" and functions as an indicator of overall market risk-on/risk-off sentiment.
Observing TradingView's BTCUSD charts, you can frequently confirm that Ethereum and other major altcoins show similar movements during Bitcoin's significant price fluctuations. However, these correlation relationships are not always constant, changing due to factors such as market sentiment, technical updates, and regulatory news.
Particularly noteworthy are the high correlation relationships between currencies belonging to specific sectors such as DeFi (decentralized finance) tokens and NFT-related currencies. These intra-sector correlations often show strength exceeding overall market correlations, tending to react simultaneously to sector-specific news and technological developments. Understanding these characteristics enables construction of more effective sector investment strategies.
Implementation and Visualization of Correlation Coefficient with PineScript
Using TradingView's PineScript, you can create indicators that calculate correlation coefficients between cryptocurrency pairs and monitor them in real-time. Here's a basic implementation example:
//@version=5
indicator("Cryptocurrency Correlation Analysis", shorttitle="Crypto Correlation", overlay=false)

// Configuration parameters
length = input.int(20, title="Calculation Period", minval=1, maxval=200)
symbol2 = input.symbol("BINANCE:ETHUSD", title="Comparison Currency")

// Price data acquisition
price1 = close
price2 = request.security(symbol2, timeframe.period, close)

// Price change rate calculation
returns1 = ta.change(price1) / price1[1]
returns2 = ta.change(price2) / price2[1]

// Correlation coefficient calculation
correlation = ta.correlation(returns1, returns2, length)

// Result display
plot(correlation, title="Correlation Coefficient", color=color.blue, linewidth=2)
hline(0.8, "Strong Positive Correlation", color=color.green, linestyle=hline.style_dashed)
hline(0.5, "Moderate Positive Correlation", color=color.yellow, linestyle=hline.style_dashed)
hline(0, "No Correlation", color=color.gray, linestyle=hline.style_solid)
hline(-0.5, "Moderate Negative Correlation", color=color.orange, linestyle=hline.style_dashed)
hline(-0.8, "Strong Negative Correlation", color=color.red, linestyle=hline.style_dashed)

// Visualization with background color
bgcolor(correlation > 0.8 ? color.new(color.green, 90) :
        correlation > 0.5 ? color.new(color.yellow, 90) :
        correlation < -0.5 ? color.new(color.red, 90) : na)
This script calculates correlation coefficients between two selected cryptocurrencies in real-time and displays them in a visually clear manner. Using the PineScript Editor enables addition of more advanced analysis features.
Utilizing Correlation Coefficient in Portfolio Diversification
In Modern Portfolio Theory, correlation coefficient is an essential element for optimal portfolio construction. In cryptocurrency investment as well, understanding correlation relationships between different currencies enables portfolio construction that maximizes returns while minimizing risk. Ideally, combining multiple assets with low correlation can achieve portfolio-wide volatility lower than individual asset volatility.
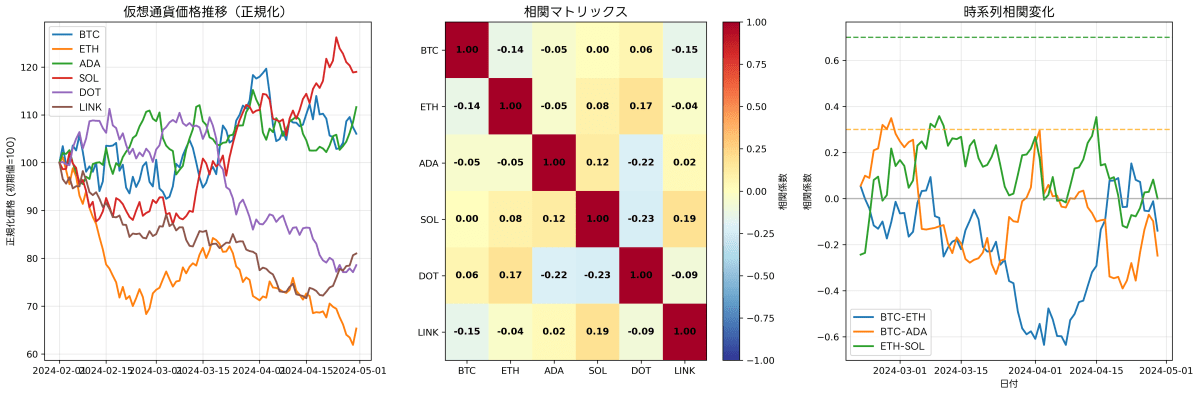
As a practical example, during periods when Bitcoin and Ethereum show high correlation coefficients of 0.8 or higher, combining these two provides limited diversification benefits. In such cases, more effective diversification can be achieved by combining currencies from other sectors with low correlation or stablecoins with low correlation to traditional assets.
Portfolio optimization using correlation coefficients requires not just selecting assets with low correlation, but mathematical optimization that comprehensively considers each asset's expected return, volatility, and correlation coefficients. Using TradingView's analysis tools enables efficient performance of such complex analysis.
Application to Pairs Trading Strategies
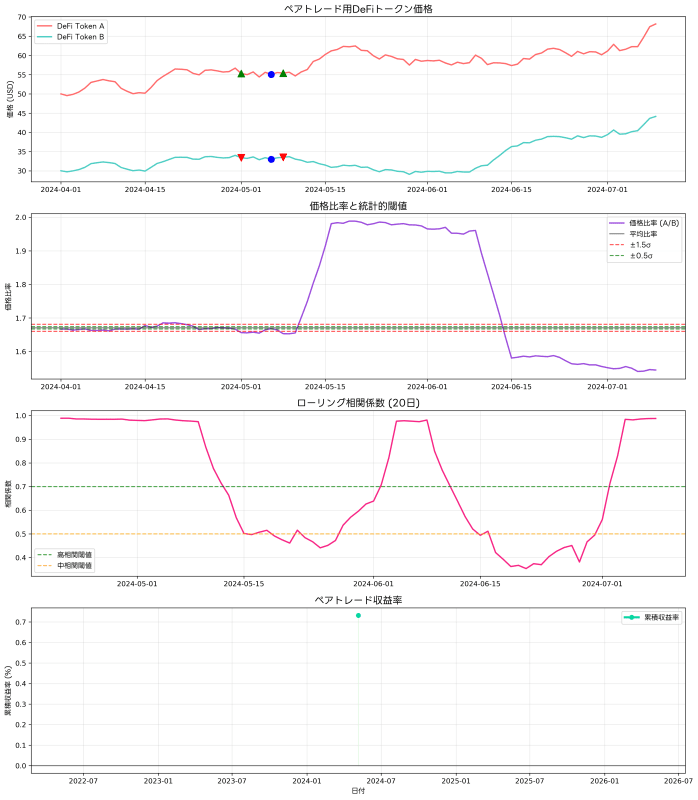
One of the most direct applications of correlation coefficients is pairs trading strategy. This strategy takes positions expecting convergence when the price relationship between two assets that historically show high correlation temporarily diverges. In cryptocurrency markets, this strategy can be applied between currencies with similar technological foundations or belonging to the same sector.
In concrete implementation, first identify currency pairs that show stable high correlation coefficients (usually 0.7 or higher) over long periods. Next, continuously monitor the price ratio or spread of these two currencies, constructing positions when statistically significant divergence occurs. Positions are closed and profits realized when price relationships return to normal ranges.
Success of this strategy depends on the stability of correlation relationships and certainty of convergence from divergence. While the high volatility of cryptocurrency markets provides opportunities, it also carries the risk of sudden changes in correlation relationships. Therefore, strict risk management and continuous monitoring of correlation relationships are essential.
Correlation Analysis in Market Risk Management
Correlation coefficient is also an important indicator for evaluating systemic risk across entire markets. During financial crises, the phenomenon of correlation coefficients rapidly rising even between assets that normally have low correlation is observed. This is called "correlation convergence," meaning diversification effects cease to function when they are most needed.
In cryptocurrency markets as well, during events affecting the entire market such as the 2022 FTX collapse or regulatory strengthening news, temporary rises in correlation coefficients among many currency pairs have been observed. To detect such phenomena in advance, monitoring moving averages and volatility of correlation coefficients can serve as early warning systems for abnormal rises.
In risk management practice, it's important to regularly recalculate correlation coefficients for all pairs within a portfolio and confirm whether expected diversification effects are maintained. When changes in correlation relationships are detected, portfolio rebalancing or consideration of additional hedging strategies becomes necessary.
Dynamics of Correlation Coefficient in Time Series Analysis
Correlation coefficient is not a static value but a dynamic indicator that changes over time. Analyzing these temporal changes enables discovery of market structure changes and new investment opportunities. The rolling correlation technique continuously recalculates correlation coefficients using moving windows of fixed periods, analyzing their change patterns.
Short-term correlation changes are often due to temporary market events or technical factors and don't significantly affect medium to long-term investment strategies. However, correlation changes persisting over several weeks to months may indicate fundamental market structure changes, requiring investment strategy reviews.
Particularly noteworthy is the correlation breakdown phenomenon. This is when stable high correlation relationships maintained over long periods suddenly collapse, often suggesting structural market changes or emergence of new investment themes. Capturing such changes early enables discovery of new investment opportunities or appropriate management of existing position risks.
Correlation Clusters in Sector Analysis
In cryptocurrency markets, clusters showing high correlation within specific sectors often form based on technological features or usage similarities. Sector-specific correlation analysis of DeFi tokens, NFT platforms, Layer 1 blockchains, etc., enables understanding of segmented market trends.
These intra-sector correlations often show higher values than overall market correlations, tending to react simultaneously to sector-specific news or technological developments. For example, in the DeFi sector, when major protocol updates or regulatory news are announced, all related currencies often show similar price movements.
Using TradingView's sector analysis enables efficient monitoring of such intra-sector correlations and application to sector rotation strategy construction. Diversifying into different sectors during periods of low inter-sector correlation can achieve more effective risk diversification.
Utilizing Correlation in High-Frequency Trading
Institutional investors and high-frequency traders also utilize correlation coefficients for millisecond-level short-term trading. Detecting short-term correlation changes or anomalies enables discovery of arbitrage opportunities or temporary price inefficiencies. Such ultra-short-term correlation analysis often employs statistical methods and machine learning algorithms different from usual.
Even at individual investor levels, monitoring minute or hourly correlation changes can improve day trading and swing trading accuracy. Particularly, using TradingView's alert features to detect correlation coefficient anomalies and receive automatic notifications is very effective for not missing trading opportunities.
However, short-term correlation analysis is susceptible to statistical noise and may generate false signals. Therefore, comprehensive judgment combining other technical indicators and fundamental analysis becomes important.
Advanced Correlation Analysis Through Machine Learning Integration
Recent developments in machine learning technology enable analysis not only of traditional linear correlations but also non-linear relationships and conditional correlations. Using deep learning models may enable more accurate prediction of inter-currency relationships under complex market conditions.
For example, models can be constructed that learn how correlation relationships change according to conditions such as market volatility states or trading volumes, predicting future correlation changes. Additionally, multidimensional correlation analysis can analyze complex relationships among three or more currencies.
These advanced analysis methods can sometimes be implemented by utilizing TradingView's PineScript external API integration features. However, using such advanced methods requires deep knowledge of statistics and machine learning, with careful verification and testing being essential.
Correlation Analysis with Global Markets
While cryptocurrency markets operate 24/7 as global markets, correlation relationships with traditional financial markets (stocks, bonds, commodities, etc.) are also important analysis targets. Particularly, with increasing institutional investor participation, correlations between Bitcoin and gold, US stock markets, and the US Dollar Index are drawing attention.
Cross-asset class correlation analysis enables understanding of how macroeconomic environment changes affect cryptocurrency markets. For example, during periods of rising inflation concerns, correlations between Bitcoin and gold tend to increase, and during risk-off phases, correlations with US stock markets can heighten.
Combining TradingView's macroeconomic data with cryptocurrency price data enables efficient multi-asset correlation analysis. Such comprehensive correlation analysis is very effective for early detection of global investment environment changes and appropriate position adjustments.
Practical Operational Precautions and Best Practices
When utilizing correlation coefficients in actual investment decisions, several important precautions must be considered. First, the basic statistical principle that correlation does not imply causation must always be kept in mind. Even when two currencies show high correlation, one is not necessarily the cause of the other's price movements.
Also, correlation coefficients are calculated based on past data and do not guarantee future relationships. Market environment changes, new technology emergence, regulatory environment changes, etc., can cause previously stable correlation relationships to suddenly change. Therefore, strategies based on correlation must always incorporate appropriate risk management measures.
Data quality and calculation period selection are also important factors. Periods too short may yield statistically insignificant results, while periods too long may include outdated relationships that don't reflect current market conditions. Generally, periods of 20-60 days are suitable for short-term analysis, while 6 months to 1 year are appropriate for medium to long-term analysis.
Continuous Learning and Improvement
Correlation analysis technology is constantly advancing, with new statistical methods and calculation algorithms being regularly developed. To become a successful investor, it's important to continuously learn these new methods and improve analytical capabilities. Continuous knowledge updates through academic research, specialized book reading, and online course participation are recommended.
Also, detailed recording of actual trading results and regular evaluation of correlation analysis-based decision accuracy is important. Analyzing both successful and failed trades to find improvement points in analytical methods can improve long-term success probability.
Summary
Correlation Coefficient is a powerful analytical tool providing multifaceted value in cryptocurrency trading. From simple price following to advanced portfolio optimization, various levels of application are possible, allowing gradual mastery according to market participants' skill levels.
Particularly considering the special characteristics of cryptocurrency markets - high volatility and 24-hour trading - objective relationship understanding through correlation analysis is essential for avoiding emotional judgments and making logical investment decisions. Understanding relationships between Bitcoin and altcoins, intra-sector correlations, and relationships with traditional assets enables construction of more sophisticated investment strategies.
However, it's important not to view correlation analysis as a universal solution but to position it as part of comprehensive market analysis. Combining with fundamental analysis, technical analysis, sentiment analysis, etc., enables more comprehensive and reliable investment judgments.
Through continuous learning and practice to refine correlation analysis techniques, cryptocurrency market investment results can be significantly improved. Acquiring multifaceted analytical capabilities that can respond to market complexity is key to long-term investment success.
For those who want to learn more deeply about PineScript programming, please utilize the TradingView PineScript Official Reference.
Disclaimer
Please judge and execute the design, implementation, operation of automated trading systems and related financial transactions entirely at your own discretion and responsibility. The author and publishing medium (Qiita) assume no legal or economic responsibility for any damage or loss arising from these actions.
This article is intended to provide information based on the author's technical verification and operational experience with TradingView and Pine Script. While efforts are made for accuracy and completeness of the content, we do not guarantee its validity or applicability.
Since market trading inherently involves risk, we recommend conducting sufficient backtesting and risk evaluation before actual capital investment, and seeking professional advice as necessary.
Please use this article after fully understanding and accepting the above matters.