In cryptocurrency trading, there exist essential market dynamics that cannot be seen through price movements alone. Behind superficial price fluctuations lies fierce competition between buyers and sellers, and this power relationship becomes an important factor determining future price directions. Cumulative Volume Delta is a powerful tool for visualizing this invisible internal market structure and quantitatively analyzing the balance between buying and selling pressure.
For more detailed PineScript functionality, please check the TradingView PineScript Official Reference.
While traditional volume analysis remained limited to simply observing the magnitude of trading volumes, Cumulative Volume Delta separates traded quantities into buyers and sellers, tracking their cumulative difference to interpret the true intentions of market participants. On advanced analysis platforms like TradingView, such complex calculations can be automated, enabling real-time market analysis.
Basic Principles of Volume Delta
To understand the concept of Volume Delta, we first need to know how individual trades are classified into buying and selling. Generally, trades are classified by execution price - trades executed at prices higher than the previous trade price are treated as buy-initiated trades (upticks), while those executed at lower prices are treated as sell-initiated trades (downticks). When prices remain unchanged, they are classified according to the direction of the immediately preceding price movement.
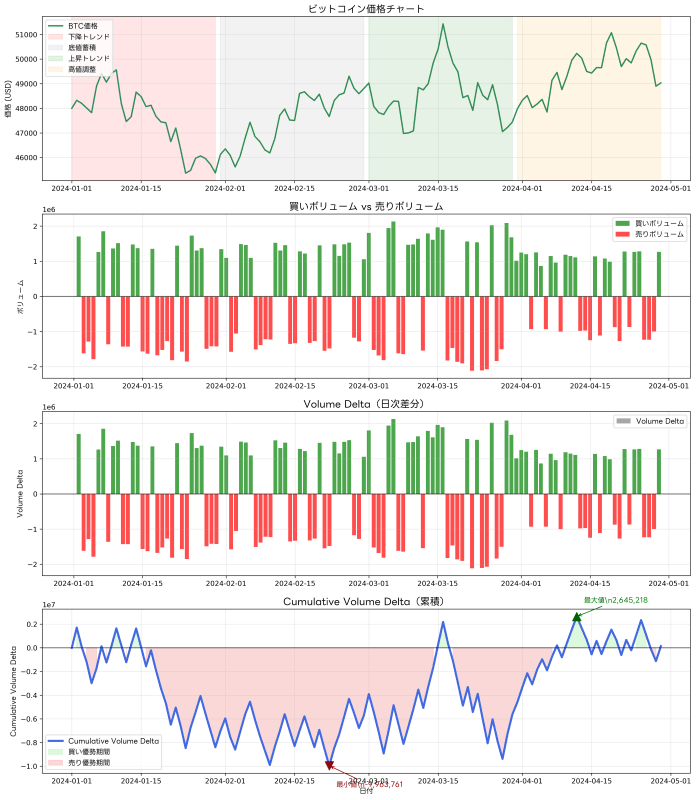
Based on this classification, buying volume and selling volume for each timeframe are calculated, with their difference becoming the Volume Delta. Positive Volume Delta indicates buying pressure exceeds selling pressure, while negative Volume Delta means selling pressure is dominant. The time-series accumulation of this value becomes Cumulative Volume Delta, enabling tracking of long-term changes in market buying and selling pressure.
In cryptocurrency markets, this analytical method holds particularly important significance. Because cryptocurrencies are traded 24 hours a day with investors from different time zones worldwide participating, regional and temporal biases in buying and selling pressure tend to occur easily. By tracking Cumulative Volume Delta, we can understand such complex market dynamics and make more accurate investment decisions.
Visualization and Interpretation of Market Psychology
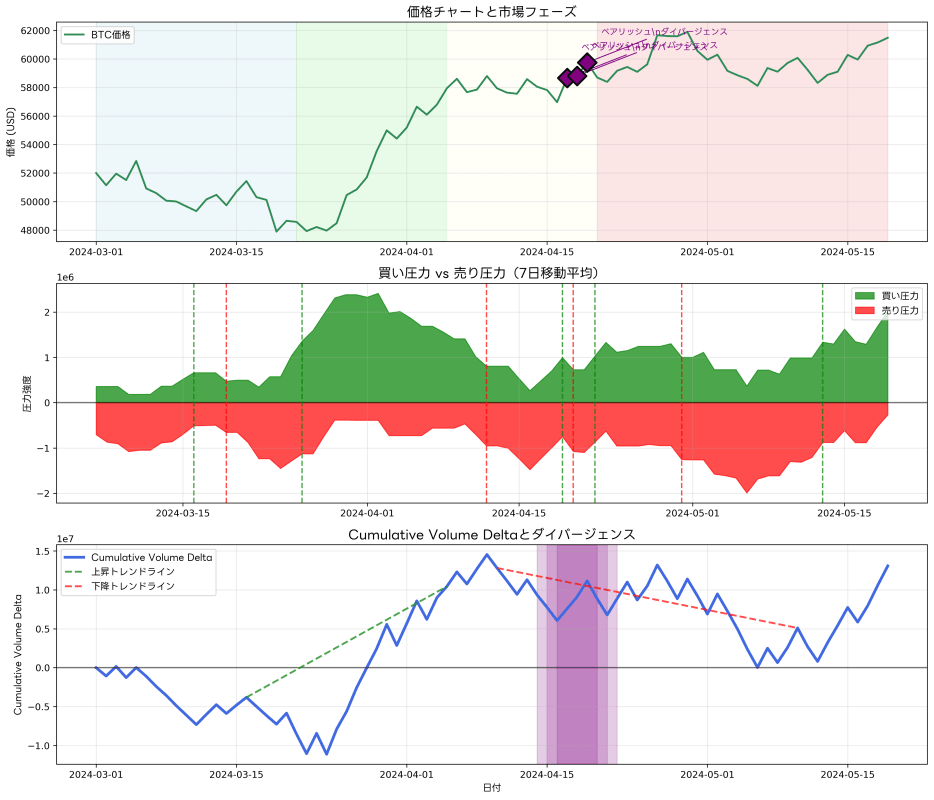
The most powerful feature of Cumulative Volume Delta is its ability to quantify and display the psychological state of market participants. When prices are rising but Cumulative Volume Delta is decreasing, it indicates that despite superficial price increases, selling pressure is actually strengthening. This is called "bearish divergence" and is noted as a precursor to price reversals.
On TradingView's BTCUSD charts, such divergence patterns can be visually confirmed, enabling early detection of market turning points that cannot be noticed through traditional price analysis alone.
Conversely, when prices are falling but Cumulative Volume Delta is rising, this is called "bullish divergence," suggesting possibilities of price bottoming or reversal upward. In such situations, rather than being misled by superficial price declines, these can be viewed as opportunities for additional buying.
Institutional Investor Movement Analysis
Cumulative Volume Delta is extremely effective not only for individual investors but also for analyzing institutional investor movements. Large institutional investors employ methods of splitting large orders into smaller portions to minimize market impact. As a result, large quantities of buying or selling can accumulate without significant price movements.
Such institutional investor movements, which are difficult to capture through traditional price analysis, can be clearly detected with Cumulative Volume Delta. Continuous accumulation of buying pressure may indicate gradual position building by institutional investors, which can be interpreted as a precursor to significant future price increases.
By utilizing TradingView's PineScript, such complex analysis can be automated and real-time monitoring becomes possible. Particularly in cryptocurrency markets, where institutional investor entry is rapidly advancing, the importance of this type of analysis is increasingly growing.
Implementation and Customization with PineScript
To effectively utilize Cumulative Volume Delta, customization according to individual trading styles and market environments is important. Basic implementation uses standard algorithms to calculate Volume Delta, but for more advanced analysis, additional elements must be considered.
//@version=5
indicator("Custom Cumulative Volume Delta", shorttitle="CVD", overlay=false)

// Parameter settings
lookback_period = input.int(20, title="Reset Period", minval=1)
delta_threshold = input.float(0.7, title="Delta Threshold", minval=0.1, maxval=1.0)
show_divergence = input.bool(true, title="Show Divergence")

// Volume Delta calculation
volume_delta = close > close[1] ? volume : close < close[1] ? -volume : 0

// Cumulative Volume Delta calculation
var float cum_volume_delta = 0
cum_volume_delta := cum_volume_delta + volume_delta

// Period reset
if bar_index % lookback_period == 0
    cum_volume_delta := 0

// Normalized delta
normalized_delta = cum_volume_delta / ta.sma(math.abs(cum_volume_delta), 14)

// Plotting
plot(cum_volume_delta, title="Cumulative Volume Delta", color=color.blue, linewidth=2)
hline(0, title="Zero Line", color=color.gray, linestyle=hline.style_dashed)

// Strong buying/selling pressure display
bgcolor(normalized_delta > delta_threshold ? color.new(color.green, 80) :
        normalized_delta < -delta_threshold ? color.new(color.red, 80) : na)

// Divergence detection
if show_divergence
    price_high = ta.highest(high, 20)
    price_low = ta.lowest(low, 20)
    delta_high = ta.highest(cum_volume_delta, 20)
    delta_low = ta.lowest(cum_volume_delta, 20)

    // Simple divergence conditions
    bullish_div = price_low[1] < price_low[20] and delta_low[1] > delta_low[20]
    bearish_div = price_high[1] > price_high[20] and delta_high[1] < delta_high[20]

    plotshape(bullish_div, title="Bullish Divergence",
              style=shape.triangleup, location=location.bottom,
              color=color.lime, size=size.small)
    plotshape(bearish_div, title="Bearish Divergence",
              style=shape.triangledown, location=location.top,
              color=color.red, size=size.small)
This script implements basic Cumulative Volume Delta calculation plus strength determination through normalized values and automatic divergence detection functionality. Using the PineScript Editor enables more advanced customization and custom alert settings.
Timeframe-Specific Analysis and Multi-Timeframe Utilization
The effectiveness of Cumulative Volume Delta varies significantly depending on the timeframe used. Short-term timeframes (5-minute or 15-minute charts) can capture minute changes in intraday buying and selling pressure, helping improve entry timing accuracy in scalping and day trading. Conversely, long-term timeframes (daily or weekly charts) enable early discovery of signs of major trend reversals.
A hierarchical approach is particularly effective: confirming long-term Cumulative Volume Delta trends on TradingView's daily charts and determining detailed entry points on 1-hour or 4-hour charts. This multi-timeframe analysis enables optimal timing execution without losing sight of overall market trends.
Combination with Liquidity Analysis
For more effective utilization of Cumulative Volume Delta, combination analysis with market liquidity conditions is important. During high liquidity periods, Volume Delta changes more accurately reflect true market supply and demand, improving signal reliability. Conversely, during low liquidity periods, Volume Delta can be significantly distorted by a few large transactions.
In cryptocurrency markets, liquidity fluctuates significantly due to regional trading time differences. Since market participant characteristics differ across Asian, European, and American trading hours, the same Cumulative Volume Delta values may require different interpretations depending on the time period. Utilizing TradingView's alert features enables efficient monitoring of these time-specific patterns.
Practical Trading Strategies
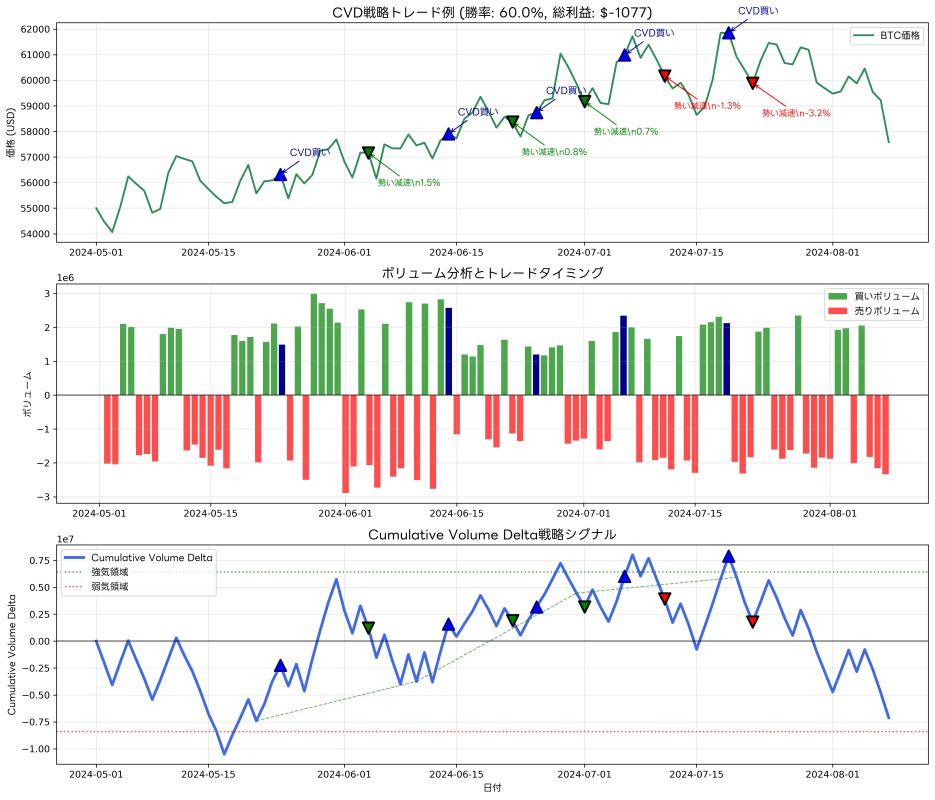
When incorporating Cumulative Volume Delta into actual trading strategies, combining multiple confirmation conditions is important. Rather than determining entries based solely on Cumulative Volume Delta direction, comprehensive judgment considering price support/resistance levels, other technical indicators, and overall market sentiment is necessary.
One effective strategy is focusing on Cumulative Volume Delta movements near important price levels. For example, when prices are consolidating near past significant highs and Cumulative Volume Delta is continuously rising, breakout possibilities increase. Conversely, when Cumulative Volume Delta is decreasing or sideways, breakout failure or price reversal is expected.
Risk Management and Position Adjustment
Risk management utilizing Cumulative Volume Delta enables position adjustments considering changes in buying and selling pressure in addition to traditional price-based methods. When Cumulative Volume Delta turns in the opposite direction while holding positions, it may indicate the market tide is changing.
In such situations, considering position size reduction or partial profit-taking can mitigate risks in advance. Particularly when large profits exist, using Cumulative Volume Delta changes as an early warning system enables both profit maximization and loss minimization.
Market Efficiency and Information Asymmetry
The value of information provided by Cumulative Volume Delta changes according to the degree of market efficiency. In efficient markets, all information is quickly reflected in prices, so advantages from Volume Delta may be limited. However, cryptocurrency markets are still developing, and due to information asymmetry and participant diversity, advanced analytical methods like Cumulative Volume Delta demonstrate their true value.
In current cryptocurrency markets where institutional investors are earnestly entering, mastering such advanced analytical methods is essential for individual investors to maintain advantages. In TradingView's indicator library, various Volume Delta-related indicators are published, allowing development of unique analytical methods while referencing these.
Application to Long-term Investment Strategies
Cumulative Volume Delta can be effectively utilized not only for short-term trading but also for long-term investment strategies. Analysis of Cumulative Volume Delta on monthly or weekly charts enables prediction of major market cycle turning points spanning several months to years. Particularly, buying or selling pressure accumulated over long periods often precedes major future price movements, providing valuable information for long-term investors.
In high-growth asset classes like cryptocurrencies, such long-term supply and demand analysis significantly impacts investment results. Using TradingView's long-term charts enables analysis of Cumulative Volume Delta trends over several years and identification of optimal investment timing.
Integration with Algorithmic Trading
In modern cryptocurrency trading, market movements have become more complex due to the proliferation of algorithmic trading. High-speed, complex trading patterns that are difficult to capture through human intuition alone can be analyzed through Cumulative Volume Delta. Particularly, large-volume trading by algorithms often appears in Volume Delta before significantly affecting prices, and early detection of this can expand trading opportunities.
Additionally, incorporating Cumulative Volume Delta into your own algorithmic trading systems enables construction of more sophisticated automated trading strategies. Multi-dimensional analysis considering not only price movements but also changes in buying and selling pressure can achieve high profitability and stability unattainable by traditional algorithms.
Continuous Learning and Adaptation
To effectively utilize Cumulative Volume Delta, continuous learning and adaptation to market environments are necessary. Cryptocurrency markets are rapidly developing, and the emergence of new exchanges, new products, and new participants can make traditional patterns obsolete. Regular parameter reviews and adjusting analytical methods to match the latest market trends are important.
Also, discovering new utilization methods and improvement points through information exchange with other traders and researchers is valuable. In TradingView's community, traders worldwide share various analytical methods, and referencing this information can lead to skill improvement.
Summary
Cumulative Volume Delta is an extremely powerful tool for visualizing the power relationship between buyers and sellers in cryptocurrency trading. By revealing the internal market structure that cannot be captured through traditional price analysis, it enables more accurate investment decisions. Its applications span widely, including detection of divergences between price and Volume Delta, institutional investor movement analysis, and determination of optimal entry timing.
However, rather than blindly trusting this indicator, comprehensive judgment combining other technical indicators and fundamental analysis is essential. Additionally, flexibly adjusting analytical methods according to market environment changes and improving skills through continuous learning are keys to success.
As cryptocurrency market complexity increases, mastering advanced analytical methods like Cumulative Volume Delta is indispensable for maintaining competitive advantages. By understanding essential market dynamics without being misled by superficial price movements, more stable investment results can be achieved.
For those who want to learn more deeply about PineScript programming, please utilize the TradingView PineScript Official Reference.
Disclaimer
Please judge and execute the design, implementation, operation of automated trading systems and related financial transactions entirely at your own discretion and responsibility. The author and publishing medium (Qiita) assume no legal or economic responsibility for any damage or loss arising from these actions.
This article is intended to provide information based on the author's technical verification and operational experience with TradingView and Pine Script. While efforts are made for accuracy and completeness of the content, we do not guarantee its validity or applicability.
Since market trading inherently involves risk, we recommend conducting sufficient backtesting and risk evaluation before actual capital investment, and seeking professional advice as necessary.
Please use this article after fully understanding and accepting the above matters.


