0
4

Delete article

Deleted articles cannot be recovered.

Draft of this article would be also deleted.

Are you sure you want to delete this article?

More than 3 years have passed since last update.

CNN可視化の紹介

Last updated at Posted at 2020-05-04

CNN Explainerとは

CNNの各計算の過程を可視化するツールです。ジョージア工科大学の博士は開発したものです。
スクリーンショット 2020-05-04 12.56.35.png

畳み込み層の可視化

このCNN Explainerの使用方法として、確認したノードにクリックしたら畳み込みの過程が示されます。
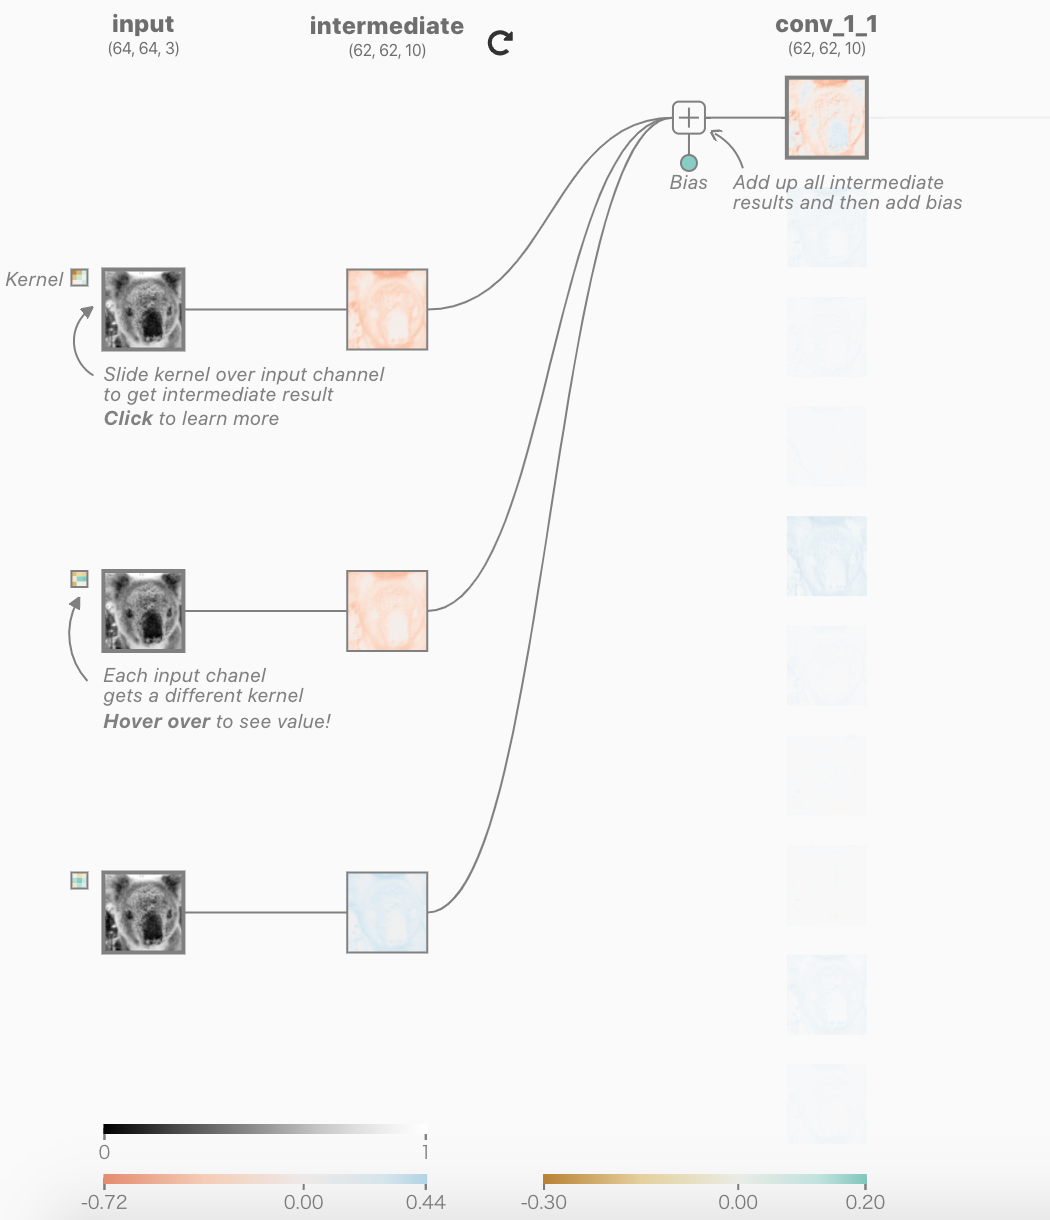
 スクリーンショット 2020-05-05 8.25.33.png

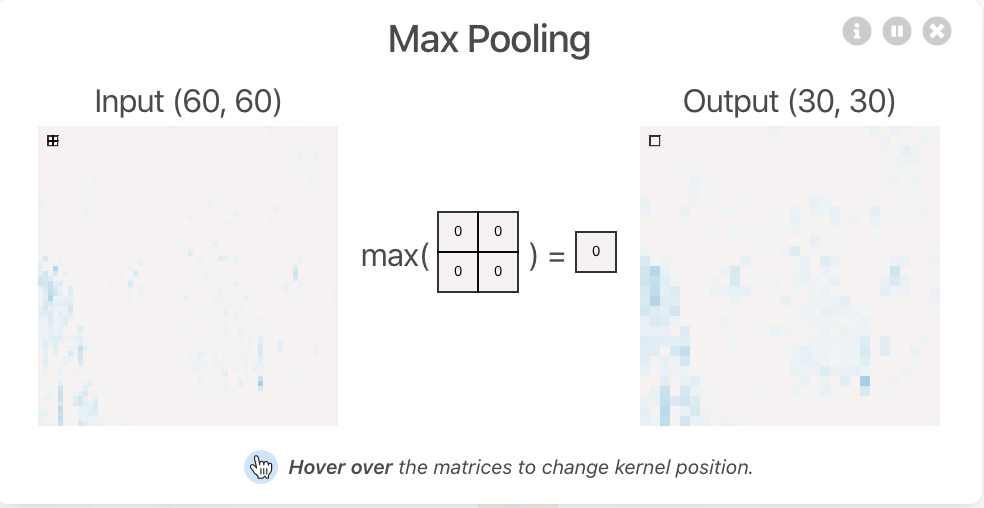
ReLU層とMax Pooling層可視化

 スクリーンショット 2020-05-05 8.26.28.png
 スクリーンショット 2020-05-05 8.27.17.png

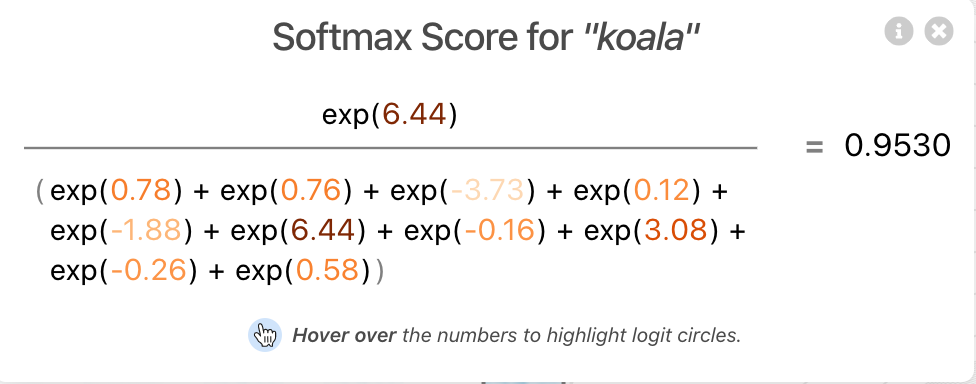
Softmax関数の詳細

 スクリーンショット 2020-05-05 8.28.35.png
CNN導出の可視化

CNNの導出過程を可視化することができます。
スクリーンショット 2020-05-05 8.29.06.png
参考文献

Web : https://poloclub.github.io/cnn-explainer/
Paper:https://arxiv.org/pdf/2004.15004.pdf

0
4
0

Register as a new user and use Qiita more conveniently

  1. You get articles that match your needs
  2. You can efficiently read back useful information
  3. You can use dark theme
What you can do with signing up
0
4

Delete article

Deleted articles cannot be recovered.

Draft of this article would be also deleted.

Are you sure you want to delete this article?