TensorFlowのバージョンが2に上がった時に、これまで使っていたtf.layersがなくなるという予定を聞いた。ということで、別の高レベルAPIであるKerasを使ってみた。
tf.layersの記事は
「TensorFlowの高レベルAPIの使用方法:tf.layersの使い方と重みなどの取り出し方」
https://qiita.com/cometscome_phys/items/95ed1b89acc7829950dd
である。
この記事でやったことをKerasでもやってみる。
バージョン
TensorFlow: 1.12.0
Keras: 2.1.6-tf
再現すべき関数
これは前と同じ。
import tensorflow as tf
import numpy as np
import matplotlib.pyplot as plt
%matplotlib inline

n = 10
x0 = np.linspace(-2.0, 2.0, n)
a0 = 3.0
a1 = 2.0
b0 = 1.0
y0 = np.zeros((n,1))
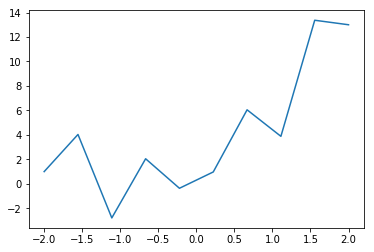
y0[:,0] = a0*x0+a1*x0**2 + b0 + 3*np.cos(20*x0)

plt.plot(x0,y0 )
plt.show()
plt.savefig("graph.png")
インプットは多項式であり、隠れ層が何もなければ多項式による線形回帰となる。インプットは
def make_phi(x0,n,k):
    phi = np.array([x0**j for j in range(k)])
    return phi.T
で定義しておく。
モデルの構築
Kerasにはモデルの表記方法が二種類あり、Sequentialモデルとfunctional APIを使ったモデルがある。今後複雑なモデルを作ることを考えて、functional APIを使うこととする。
と言っても、tf.layersとか生のTensorFlowをいじったことがあるならば、functional APIは身構える必要はない。
モデルは、
import tensorflow as tf
from tensorflow.keras import layers
from tensorflow.keras import optimizers

def build_model(d_input,d_middle):
    inputs = tf.keras.Input(shape=(d_input,))  #インプットの次元を指定
    x = layers.Dense(d_middle, activation='relu')(inputs) #中間層の指定
    y = layers.Dense(1)(x) #最終層の指定
    adam = optimizers.Adam() #最適化にはAdamを使用
    model =  tf.keras.Model(inputs=inputs, outputs=y) #モデルのインプットとアウトプットを指定

    model.compile(optimizer=adam,
              loss='mean_squared_error') #modelの構築。平均二乗誤差をloss関数とした。

    return model
となる。
よって、
k = 4
phi = make_phi(x0,n,k)
d_type = tf.float32
d_input = k
d_middle = 10
model = build_model(d_input,d_middle)
でmodelを作ることができる。
学習
学習はとても簡単で、
history = model.fit(phi, y0, epochs=20000,verbose=0)
で良い。ここで、verboseを指定しないとログがepochごとに(20000個)出力される。
結果
結果を見るには、
ytest = model.predict(phi)
で構築したモデルから出力されたyを作っておき、プロットすればよくて、
plt.plot(x0,y0 )
plt.plot(x0,ytest,'o')
plt.show()
plt.savefig("graph.png")

plt.plot(history.history['loss'])
plt.title('model loss')
plt.ylabel('loss')
plt.xlabel('epoch')
plt.legend(['train'], loc='upper left')
plt.show()
plt.savefig("train.png")
学習したモデルの表示
モデルを表示するためには、
model.summary()
model.get_weights()
とすれば、モデルの構造と、中身のWやbを見ることができる。


