https://github.com/hadley/bigrquery を利用します
https://github.com/rstats-db/bigrquery に移動しているのでこちらを使用しましょう.
install.packages('httpuv')
install.packages('devtools')
devtools::install_github("rstats-db/bigrquery") # devtools::install_github("hadley/bigrquery")
library(bigrquery)
Google 認証
httpuv を併用することで,以下のようにクエリを打つと
query_exec(project = 'twitter2bigquery', 'SELECT COUNT(*) FROM [twitter.timeline];' )
一旦ブラウザが立ち上がり Google の認証/認可を行います.
完了すると,ブラウザに Authentication complete. Please close this page and return to R. と表示されるので,コンソールに戻ります.
再度クエリを実行すると,
ちゃんと結果が返ってきています.
結果を利用する
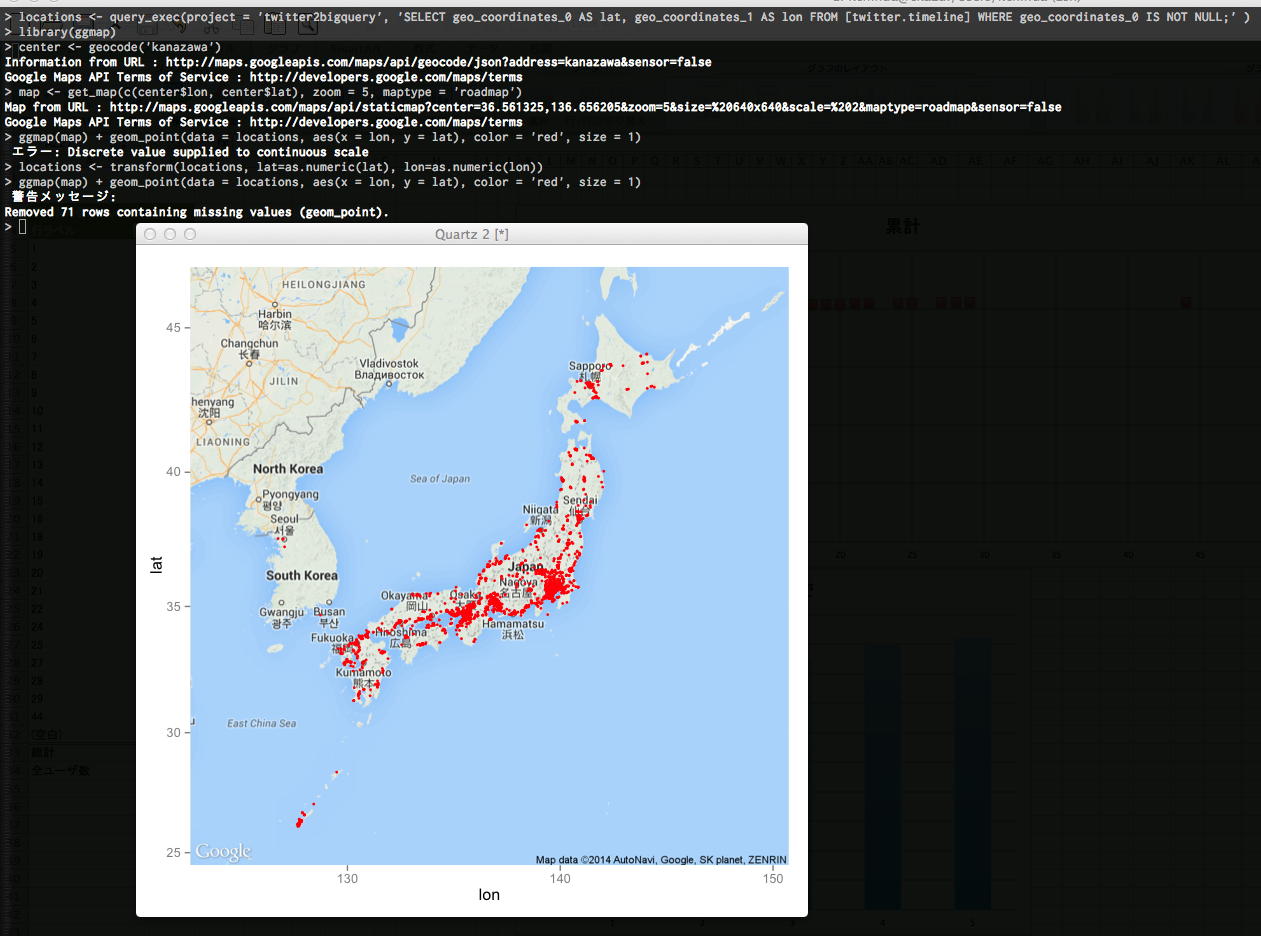
http://qiita.com/ckazu/items/d166757ed664ca622ecc のように,BigQuery からのクエリ結果を地図にプロットさせてみます.
ちなみに, http://kototech.i-studio.co.jp/212/ を参考に Twitter Streaming API から BigQuery 流しているデータを使用します.
query_exec の結果は dataframe となりますが,値は string なので,座標をすべて数値に変換しておきます.
locations <- query_exec(project = 'twitter2bigquery', 'SELECT geo_coordinates_0 AS lat, geo_coordinates_1 AS lon FROM [twitter.timeline] WHERE geo_coordinates_0 IS NOT NULL;' )
locations <- transform(locations, lat=as.numeric(lat), lon=as.numeric(lon))
このようなデータが取得できているのでプロットします.
library(ggmap)
center <- geocode('kanazawa')
map <- get_map(c(center$lon, center$lat), zoom = 5, maptype = 'roadmap')
ggmap(map) + geom_point(data = locations, aes(x = lon, y = lat), color = 'red', size = 1)
できました


