時系列データをそのままグラフにすると、細かな変動に埋もれて全体の傾向が見えにくくなることがあります。
そんな時は平滑化することで、トレンドが把握しやすくなります。
サンプルデータ
BigQueryの公開データセット Chicago Taxi Trips を使います。
-- 日別の乗車件数
SELECT
  DATE(trip_start_timestamp) AS date,
  COUNT(*) AS cnt
FROM `bigquery-public-data.chicago_taxi_trips.taxi_trips`
WHERE trip_start_timestamp BETWEEN '2023-01-01' AND '2023-03-31'
GROUP BY date
ORDER BY date

どうやら曜日による細かな変動がありそうです。
移動平均を追加する
実際に7日間の移動平均を追加してみます。
WITH daily_trips AS (
  SELECT
    DATE(trip_start_timestamp) AS date,
    COUNT(*) AS cnt
  FROM `bigquery-public-data.chicago_taxi_trips.taxi_trips`
  WHERE trip_start_timestamp BETWEEN '2023-01-01' AND '2023-03-31'
  GROUP BY date
)
SELECT
  date,
  cnt,
  ROUND(AVG(cnt) OVER (
    ORDER BY date
    ROWS BETWEEN 6 PRECEDING AND CURRENT ROW
  )) AS moving_avg_7d
FROM daily_trips
ORDER BY date
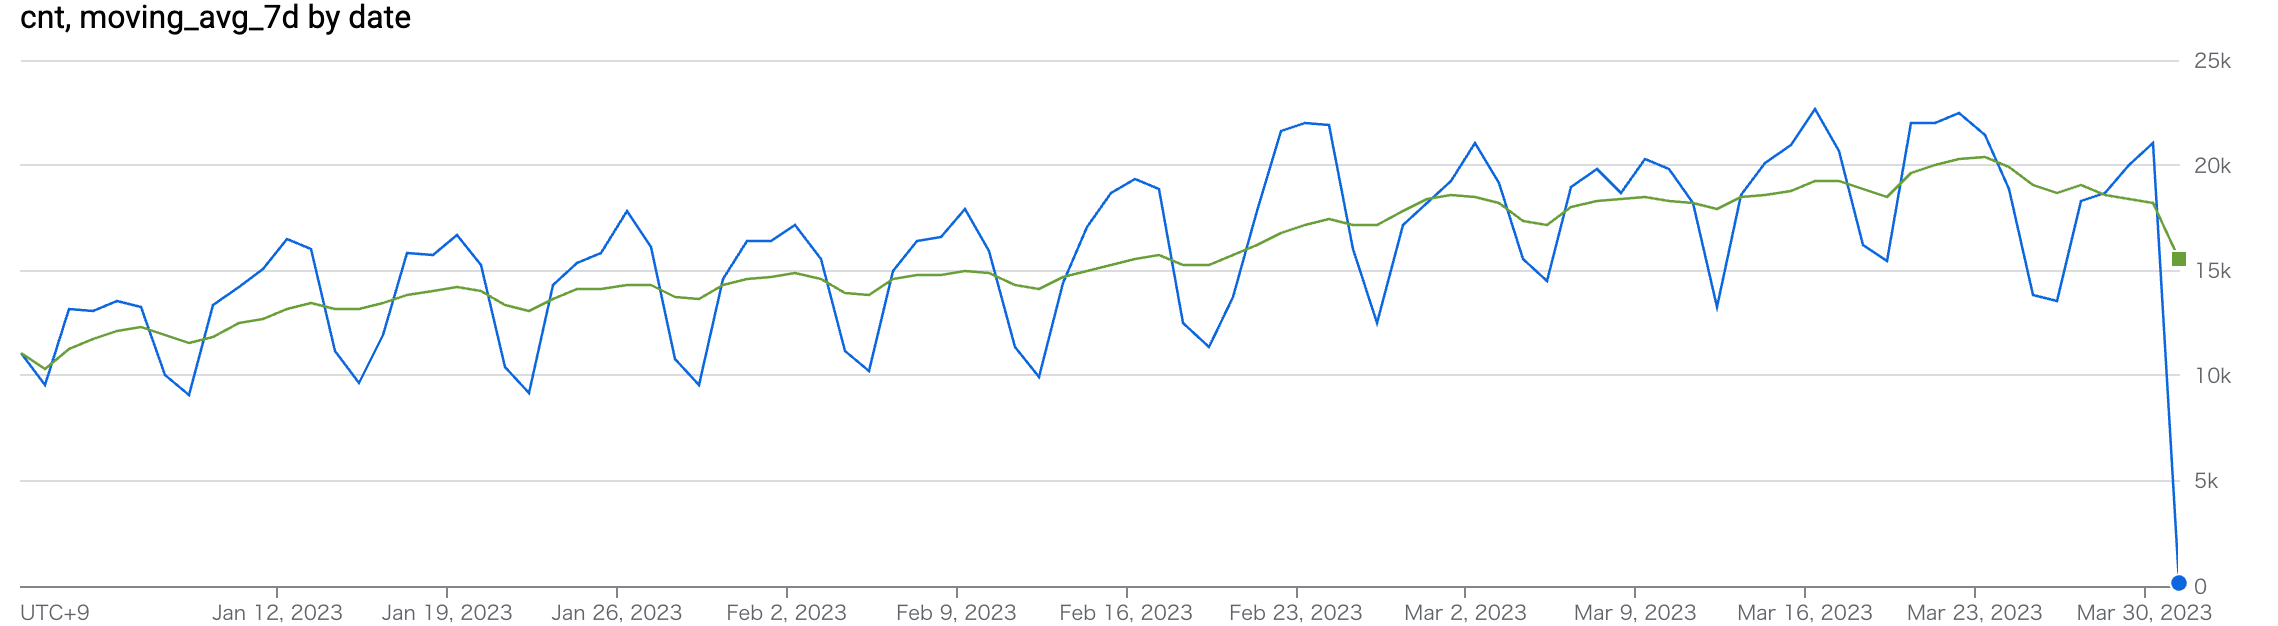
見ると2023/01/01 ~ 2021/03/31で緩やかに上昇していそうです。
最後に
監視業務においてもこの考え方は有用です。リクエスト数やPV数など、ユーザートラフィックに依存する指標を監視する場合、生の値を使えば異常を即座に検知できますが、一時的なスパイクやタイミングのズレで誤検知が多くなりがちです。
「即時性より誤検知を減らしたい」「トレンドの変化を捉えたい」というケースでは、移動平均をはじめとした平滑化手法が有効かもしれません。