はじめに
Syslogプロトコルを使ってVMware ESXiのログをElasticsearchに送る方法について説明します。
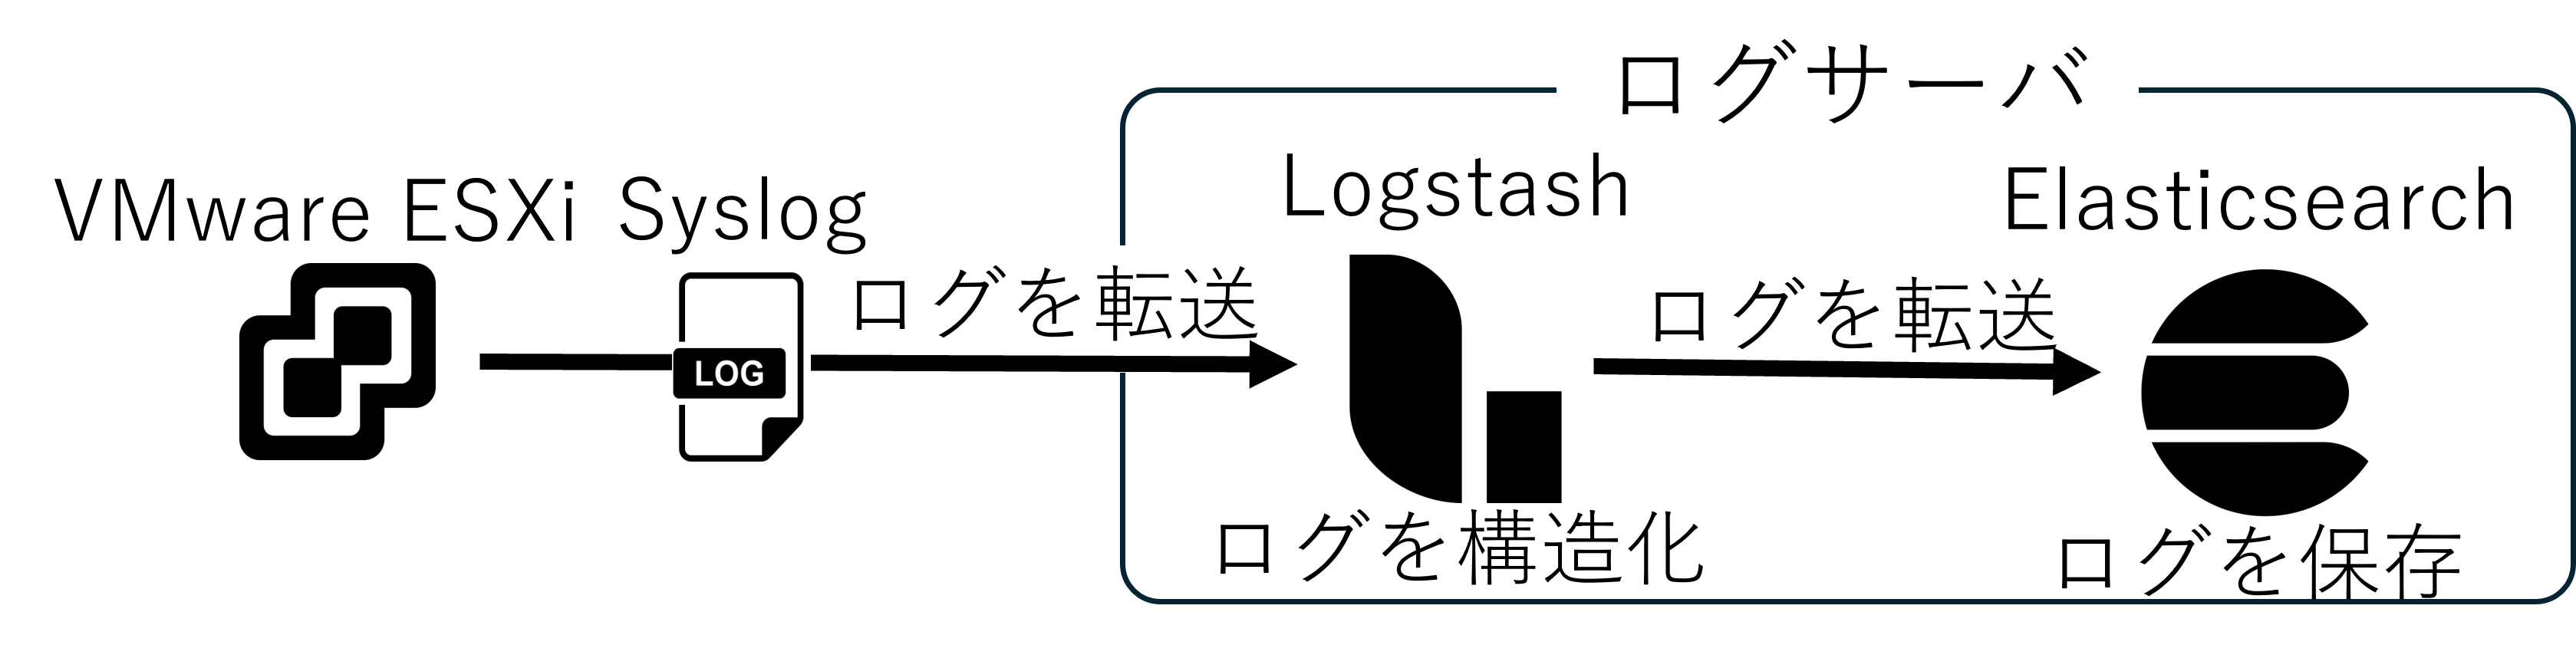
下の図はVMware ESXiをElasticsearchに送るまでの流れを表した図です。
VMware ESXiからLogstashにログを転送するとElasticsearchにログが転送されます。
環境
本記事で紹介する機器の名前とバージョンについてです。
- VMware ESXi:8.0 Update 2
- Elasticsearch:8.5.1
- Logstash:8.5.1
Logstashの設定について
Logstashの設定とインストールについて説明します。
Logstashはhelmを使用してKubernetesにインストールしました。
手順
1.ls-values.yamlの中身を書きます。
設定ファイルにポート番号が2つ書かれています。
1つ目はsyslogのポート番号31514です。2つ目はbeatsのポート番号30544です。
本記事ではsyslogの送り方なのでポート番号は31514番です。
下記の設定ファイルの20行目nodePort: 31514の部分です。
Syslogを送るElasticsearchのアドレスはhttp://elasticsearch-master:9200です。
下記の設定ファイルの下から4行目hosts => ["http://elasticsearch-master:9200"]の部分です。
logstashJavaOpts: "-Xmx1g -Xms1g"
resources:
  requests:
    cpu: "100m"
    memory: "1Gi"
  limits:
    cpu: "1000m"
    memory: "1Gi"
persistence:
  enabled: True
extraPorts:
  - name: beats
    containerPort: 5044
service:
  type: NodePort
  ports:
    - name: syslog
      port: 5140
      protocol: UDP
      nodePort: 31514
    - name: beats
      port: 5044
      protocol: TCP
      nodePort: 30544
logstashConfig:
  logstash.yml: |
    http.host: 0.0.0.0
    xpack.monitoring.enabled: false
logstashPipeline:
  logstash.conf: |
    input {
      syslog {
        port => 5140
        add_field => { "[@metadata][input_id]" => "syslog_input" }
      }
      beats {
        port => 5044
        add_field => { "[@metadata][input_id]" => "beats_input" }
      }
    }

    filter {
      if [@metadata][input_id] == "syslog_input" {
        mutate {
          replace => { "[@metadata][index_prefix]" => "syslog" }
        }

        grok {
          match => {
            "message" => "%{SYSLOG5424LINE}"
          }
          overwrite => [ "message" ]
          tag_on_failure => ["syslog_parse_failed"]
        }

        if "syslog_parse_failed" in [tags] {
          grok {
            match => {
              "message" => "<%{POSINT:syslog_pri}>%{SYSLOGTIMESTAMP:syslog_timestamp} %{SYSLOGHOST:syslog_host} %{DATA:syslog_program}(?:\[%{POSINT:syslog_pid}\])?: %{GREEDYDATA:syslog_message}"
            }
            overwrite => [ "message" ]
            remove_tag => ["syslog_parse_failed"]
            tag_on_failure => ["syslog_rfc3164_failed"]
          }
        }

        date {
          match => [ "syslog_timestamp", "ISO8601", "MMM  d HH:mm:ss", "MMM dd HH:mm:ss" ]
          target => "@timestamp"
        }
      }
      else if [@metadata][input_id] == "beats_input" {
        if "weblog" in [tags] {
          mutate {
            replace => { "[@metadata][index_prefix]" => "weblog" }
          }

          grok {
            match => { "message" => "%{HTTPD_COMBINEDLOG}" }
            overwrite => [ "message" ]
            tag_on_failure => ["weblog_parse_failed"]
          }

          date {
            match => [ "timestamp", "dd/MMM/yyyy:HH:mm:ss Z" ]
            target => "@timestamp"
          }

          if "access_log" in [tags] {
            dissect {
              mapping => {
                "[log][file][path]" => "%{path}/access.%{domain}.log.1"
              }
            }
          }
          if "error_log" in [tags] {
            dissect {
              mapping => {
                "[log][file][path]" => "%{path}/error.%{domain}.log.1"
              }
            }
          }
        }
        else {
          mutate {
            replace => { "[@metadata][index_prefix]" => "beats" }
          }
        }
      }
      else {
        mutate {
          add_field => { "[@metadata][index_prefix]" => "default" }
        }
      }
    }

    output {
      # stdout { codec => rubydebug }
      elasticsearch {
        hosts => ["http://elasticsearch-master:9200"]
        index => "%{[@metadata][index_prefix]}-%{+YYYY.MM.dd}"
      }
    }
2.Elasticsearchのhelmを使用するために、以下のコマンドでHelmリポジトリの追加をします
helm repo add elastic https://helm.elastic.co
helm repo update
↓実行結果
c0a22166@c0a22166:~$ helm repo add elastic https://helm.elastic.co
"elastic" already exists with the same configuration, skipping
c0a22166@c0a22166:~$ helm repo update
Hang tight while we grab the latest from your chart repositories...
...Successfully got an update from the "elastic" chart repository
Update Complete. ⎈Happy Helming!⎈
c0a22166@c0a22166:~$
3.Logstashのインストールします
helm install ls elastic/logstash -f ls-values.yaml
VMware ESXiのsyslogをElasticsearchに送る方法について
VMware ESXiのsyslogをElasticsearchに送る際の手順について説明します。
手順
1. コマンドプロンプトを起動して、ESXiにSSHで接続をします。
今回はrootユーザで、IPアドレスが192.168.100.21とします。
ssh root@192.168.100.21
↓実行結果
C:\Users\g022c>ssh root@192.168.100.21
(root@192.168.100.21) Password:
The time and date of this login have been sent to the system logs.

WARNING:
   All commands run on the ESXi shell are logged and may be included in
   support bundles. Do not provide passwords directly on the command line.
   Most tools can prompt for secrets or accept them from standard input.

VMware offers powerful and supported automation tools. Please
see https://developer.vmware.com for details.

The ESXi Shell can be disabled by an administrative user. See the
vSphere Security documentation for more information.
[root@plum:~]
2. 以下のコマンドでSyslogサーバの設定を行います。
syslogを送る先のLogstashのIPアドレスは192.168.100.192で、ポート番号は31514です。
esxcli system syslog config set --loghost=192.168.100.192:31514
↓実行結果
[root@plum:~] esxcli system syslog config set --loghost=192.168.100.192:31514
[root@plum:~]
3. Syslogサーバの設定を反映させるために以下のコマンドを実行します。
esxcli system syslog reload
↓実行結果
[root@plum:~] esxcli system syslog reload
[root@plum:~]
4. 以下のコマンドで設定が反映されているかを確認します。
esxcli system syslog config get
Remote Host : にログサーバのアドレスが表示されていればOKです。
↓実行結果
[root@plum:~] esxcli system syslog config get
   Allow Vsan Backing: false
   Check Certificate Revocation List: false
   Dropped Log File Rotation Size: 100
   Dropped Log File Rotations: 10
   Enforce SSLCertificates: true
   Local Log Output: /scratch/log
   Local Log Output Is Configured: false
   Local Log Output Is Persistent: true
   Local Logging Default Rotation Size: 1024
   Local Logging Default Rotations: 8
   Log Level: error
   Log To Unique Subdirectory: false
   Message Queue Drop Mark: 90
   Remote Host: udp://192.168.100.192:31514
   Remote Host Connect Retry Delay: 180
   Remote Host Maximum Message Length: 1024
   Strict X509Compliance: false
[root@plum:~]
5. ファイアウォールがありログの転送ができないため、ファイアウォールに許可ルールを追加します。
esxcli network firewall ruleset set --ruleset-id=syslog --enabled=true
↓実行結果
[root@plum:~] esxcli network firewall ruleset set --ruleset-id=syslog --enabled=true
[root@plum:~]
6. 以下のコマンドでファイアウォールの許可ルールを確認します。
esxcli network firewall ruleset list --ruleset-id=syslog
以下のように表示されたらOKです。
[root@plum:~] esxcli network firewall ruleset list --ruleset-id=syslog
Name    Enabled  Enable/Disable configurable  Allowed IP configurable
------  -------  ---------------------------  -----------------------
syslog     true                         true                     true
[root@plum:~]
7. Kibanaにアクセスをして、host.hostnameがESXiのホスト名に一致するログを検索します。
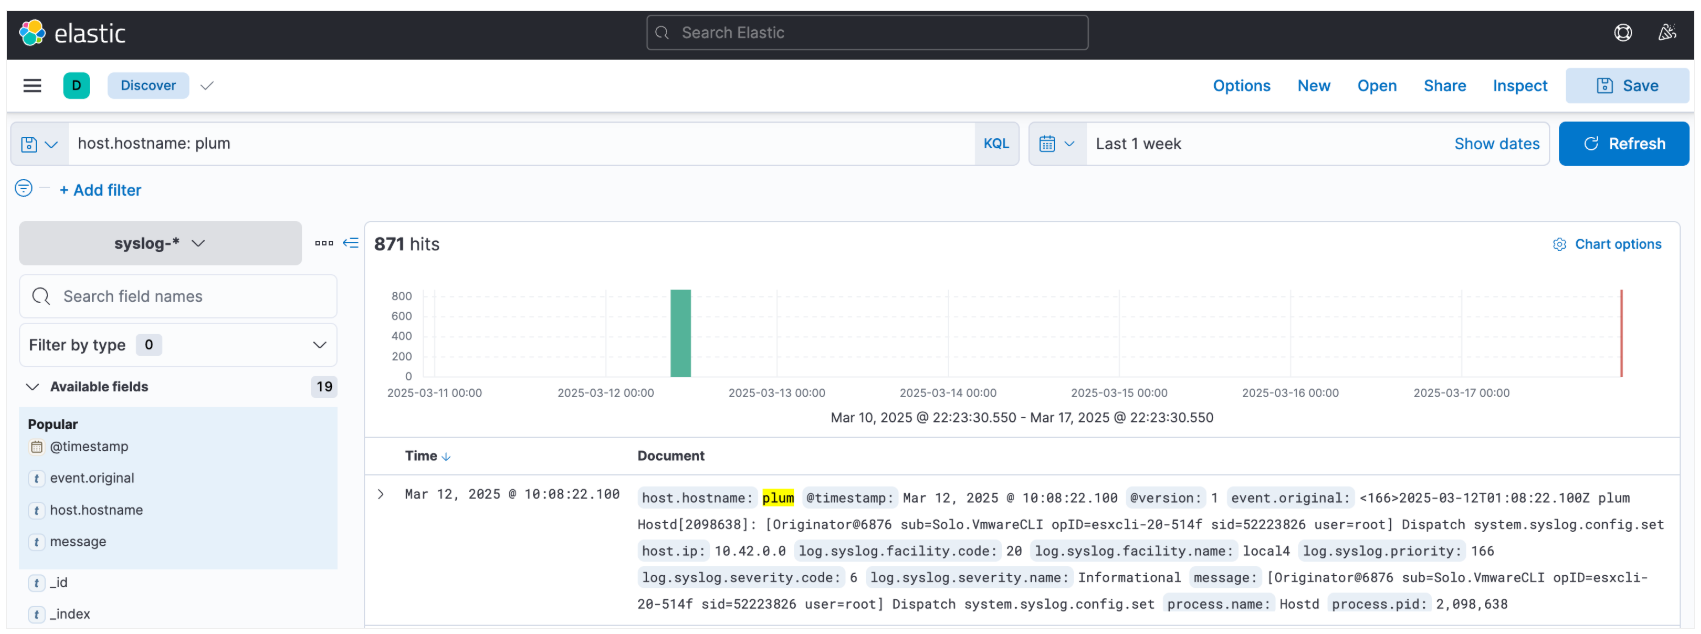
↑このようにログの確認ができればOKです。
まとめ
本記事では、ESXiのsyslogをElasticsearchに送る方法について紹介しました。
これにより、ESXiのログをElasticsearchに送ることができるようになります。
参考資料
Logstashのインストールについて
https://github.com/cdsl-research/lab-log-elastic/blob/main/elastic-2025/ls-values.yaml
helmのインストールについて
https://artifacthub.io/packages/helm/elastic/logstash