0
0

Delete article

Deleted articles cannot be recovered.

Draft of this article would be also deleted.

Are you sure you want to delete this article?

Power BI でグラフの機能を学ぶ

0
Last updated at Posted at 2026-09-24

Power BI Desktopでグラフの機能を学ぶ

Power BI Desktopでグラフの基本的な手順を学習します。
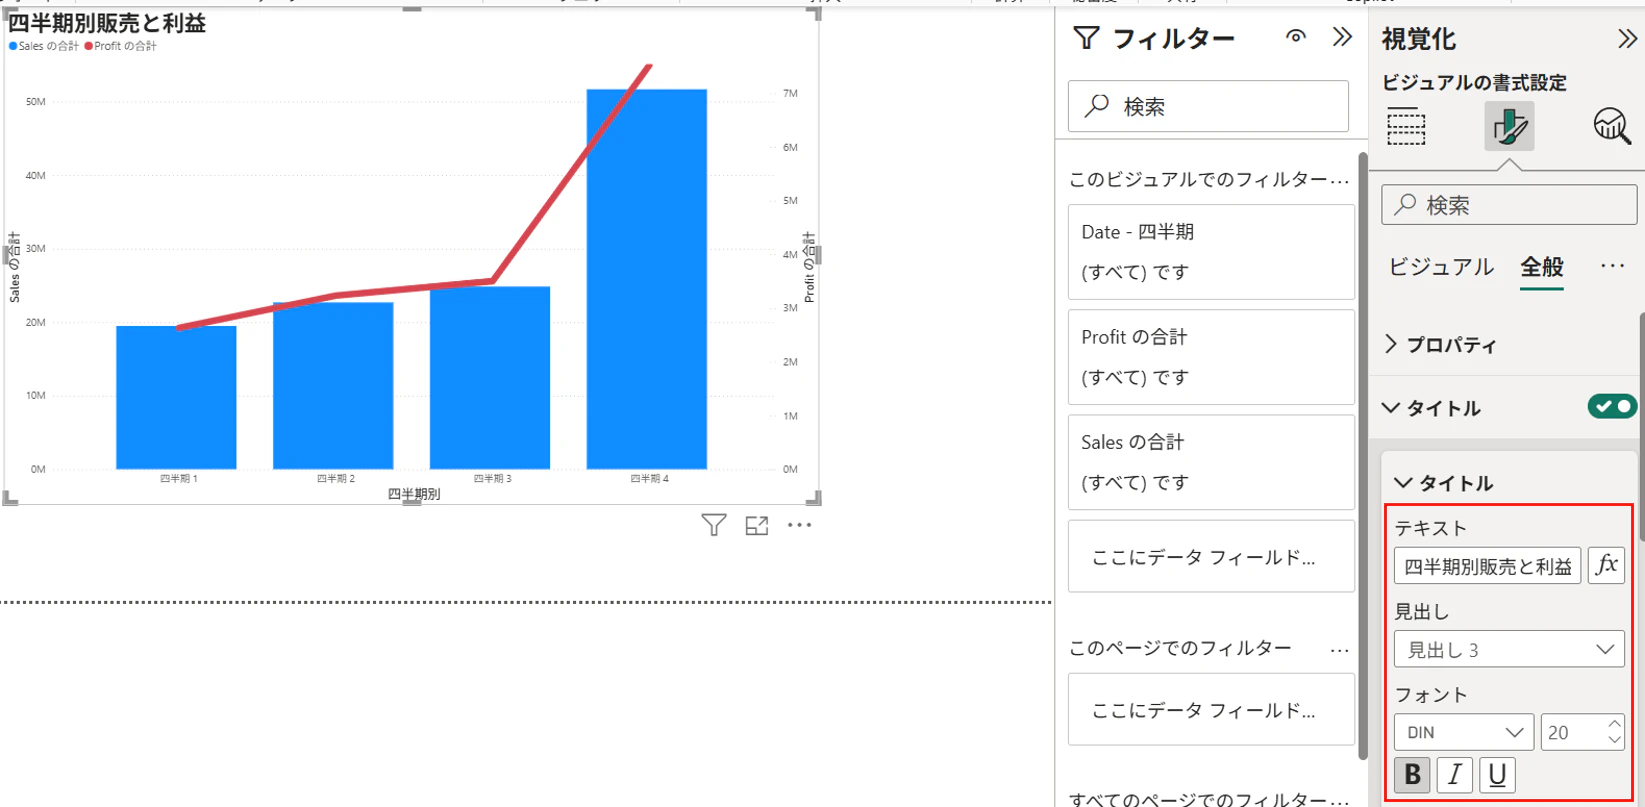
image.png

手順

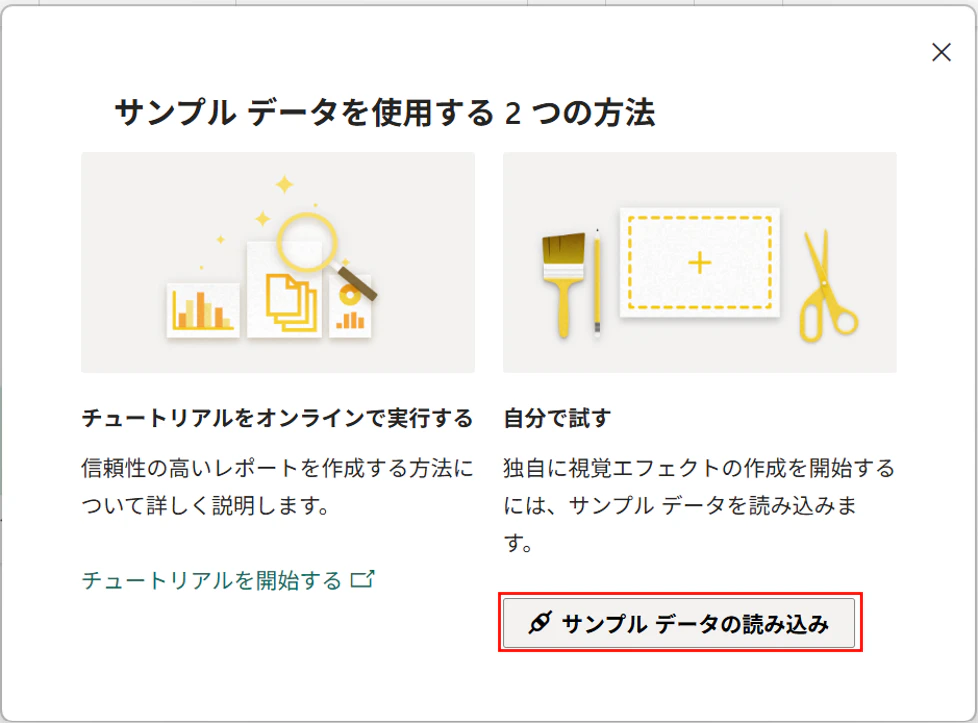
Power BI Desktopを起動し「サンプルデータを使って学ぶ」を選択
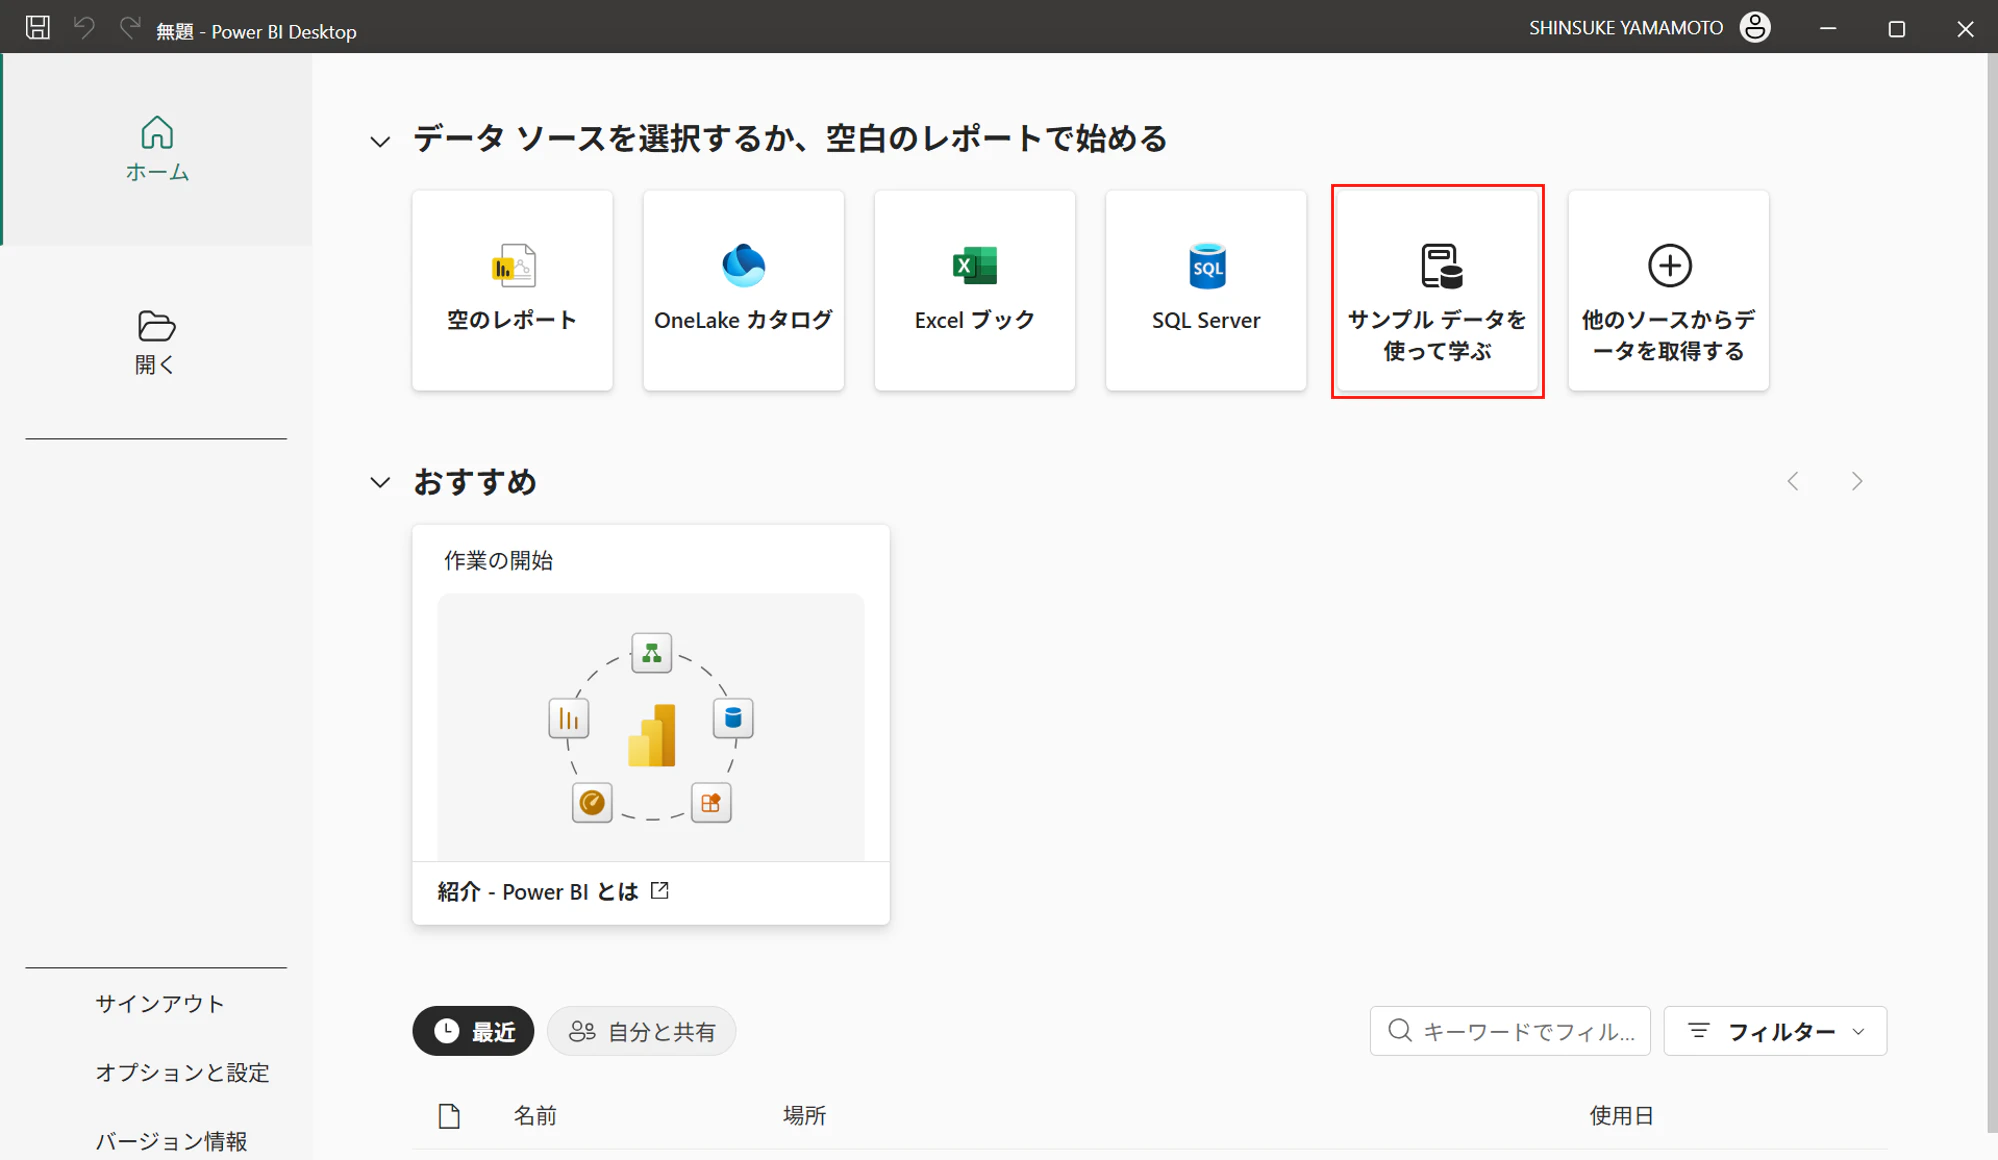
image.png

「サンプルデータの読み込み」
image.png

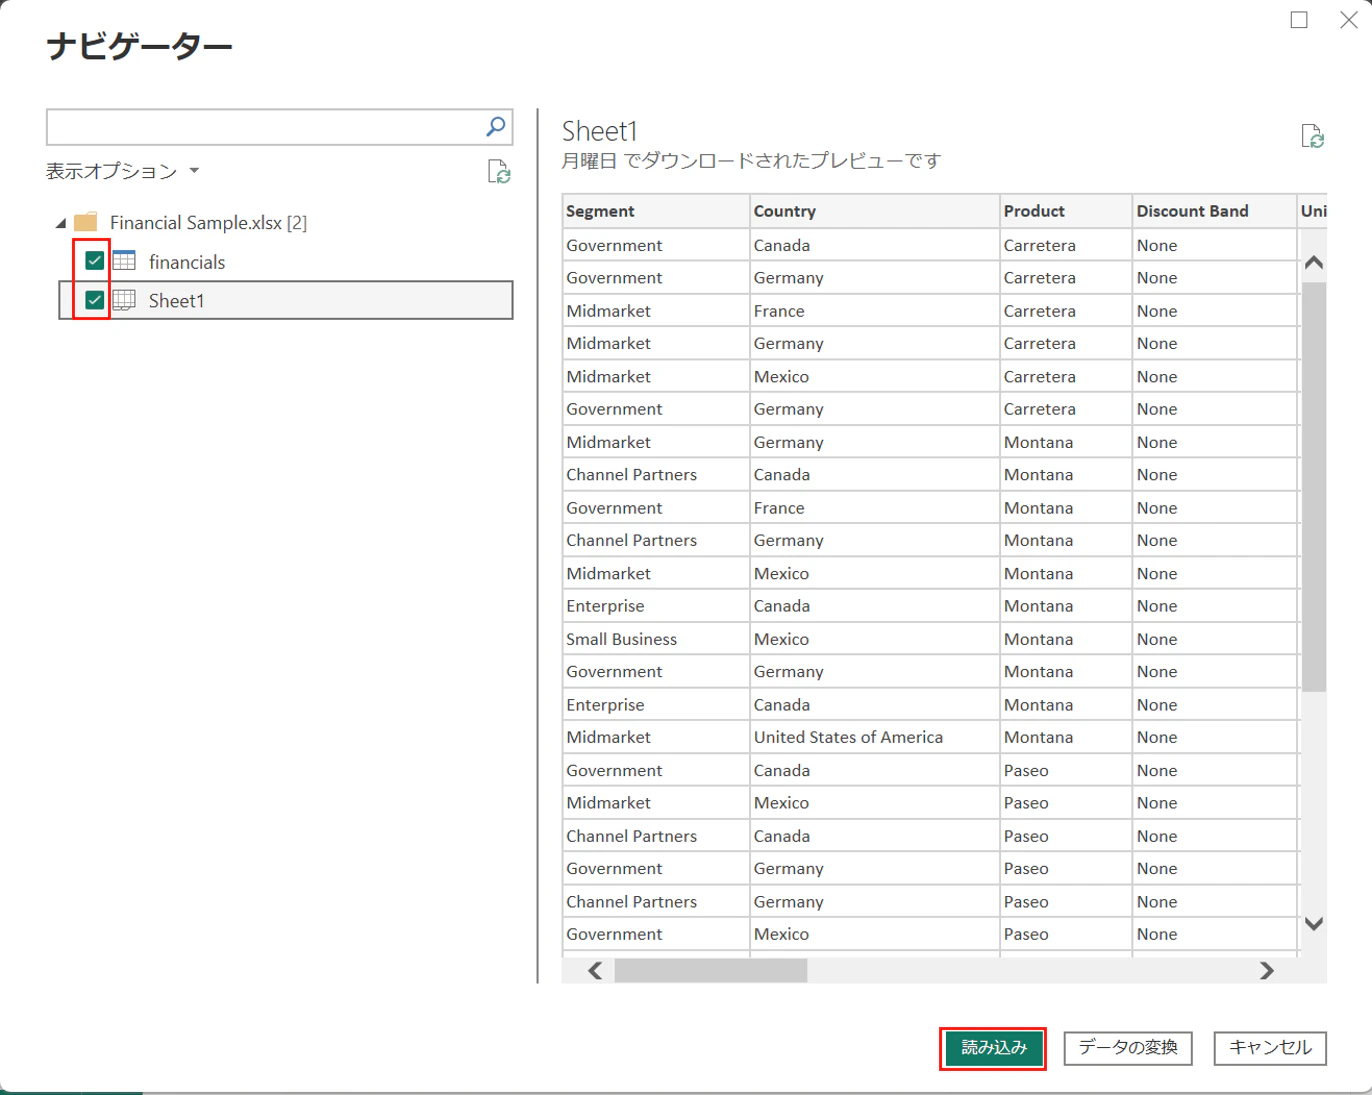
「financials」と「Sheet1」にチェックを入れて「読み込み」
image.png

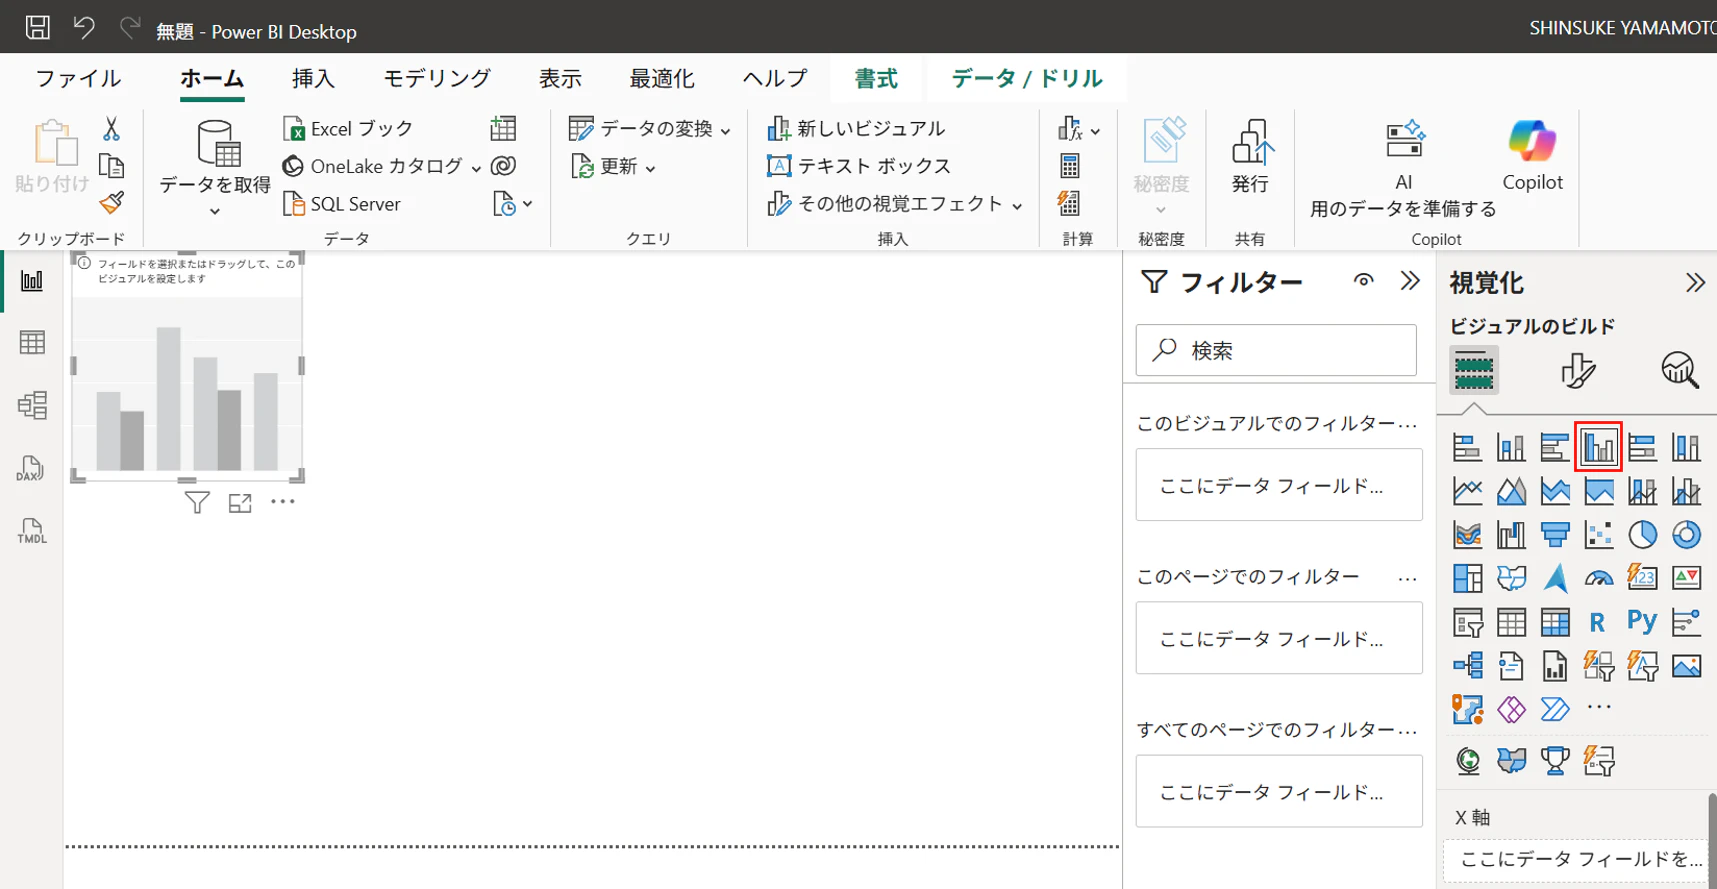
「集合縦棒グラフ」を選択
image.png

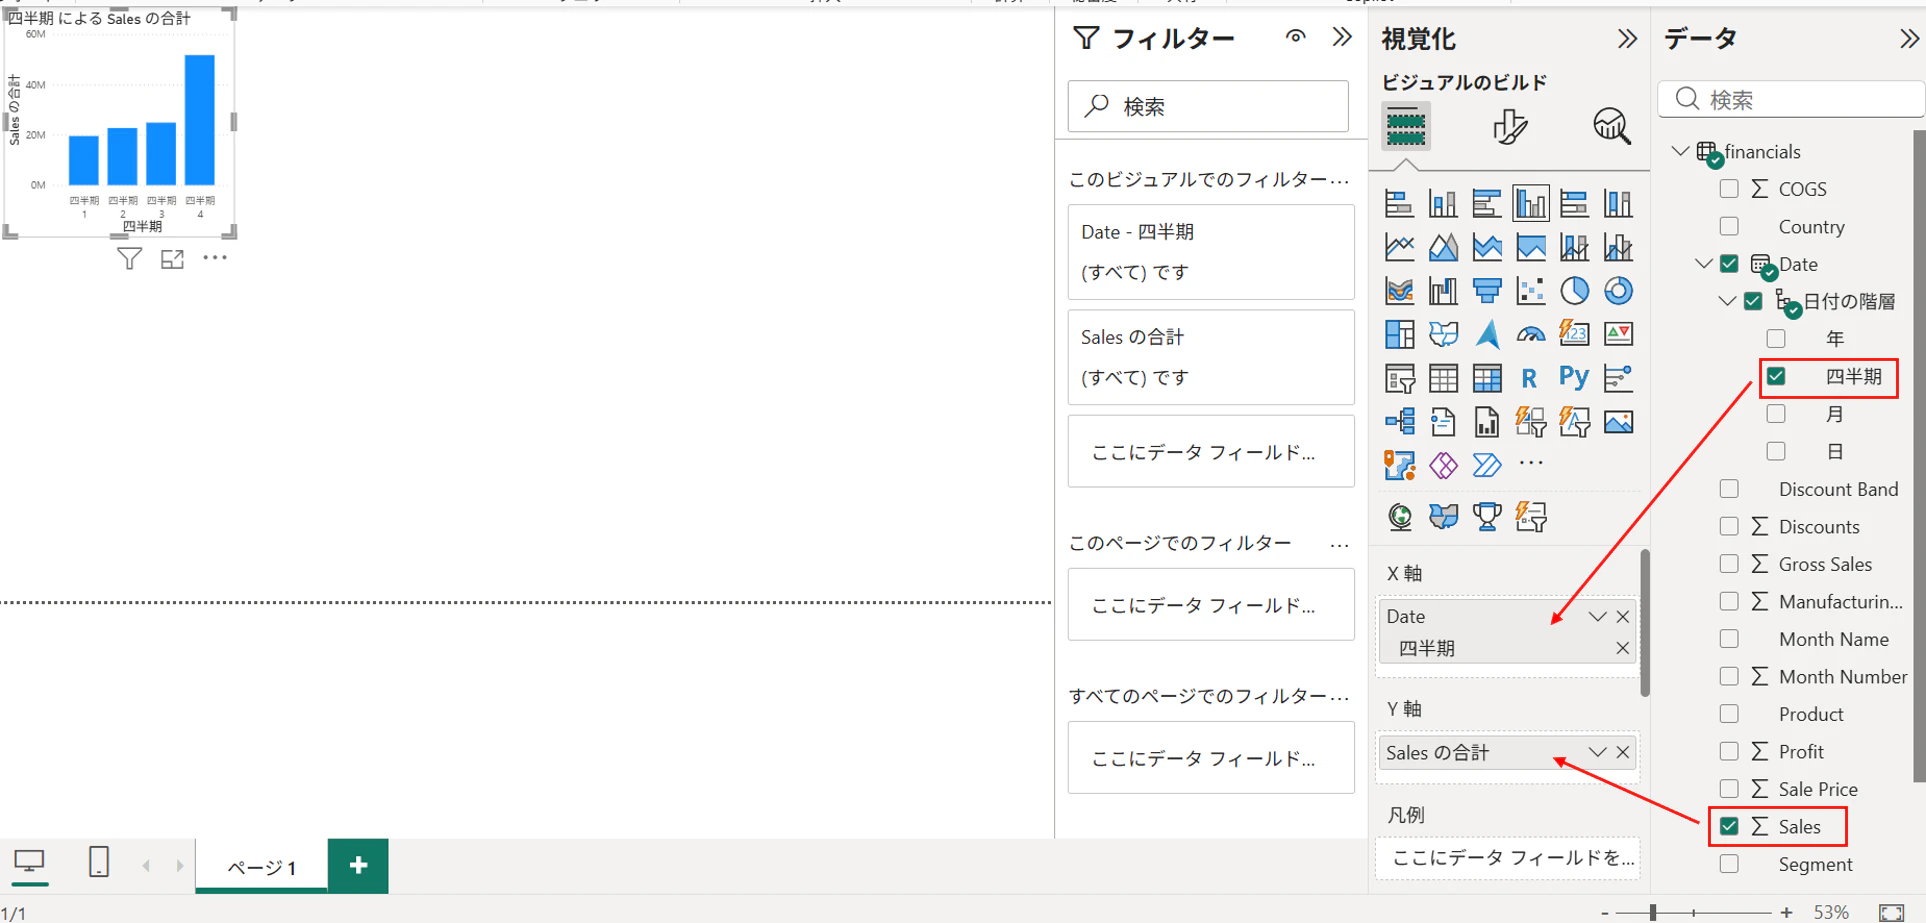
「四半期」をX軸、「Sales」をY軸にドラッグ&ドロップ
image.png

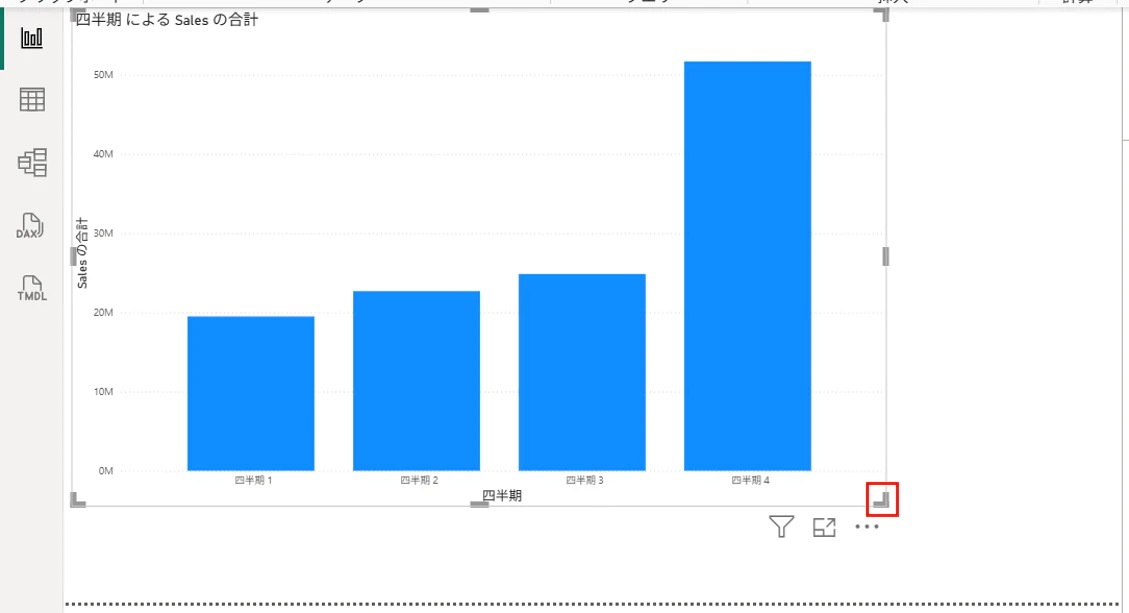
グラフを見やすいようにサイズ調整
image.png

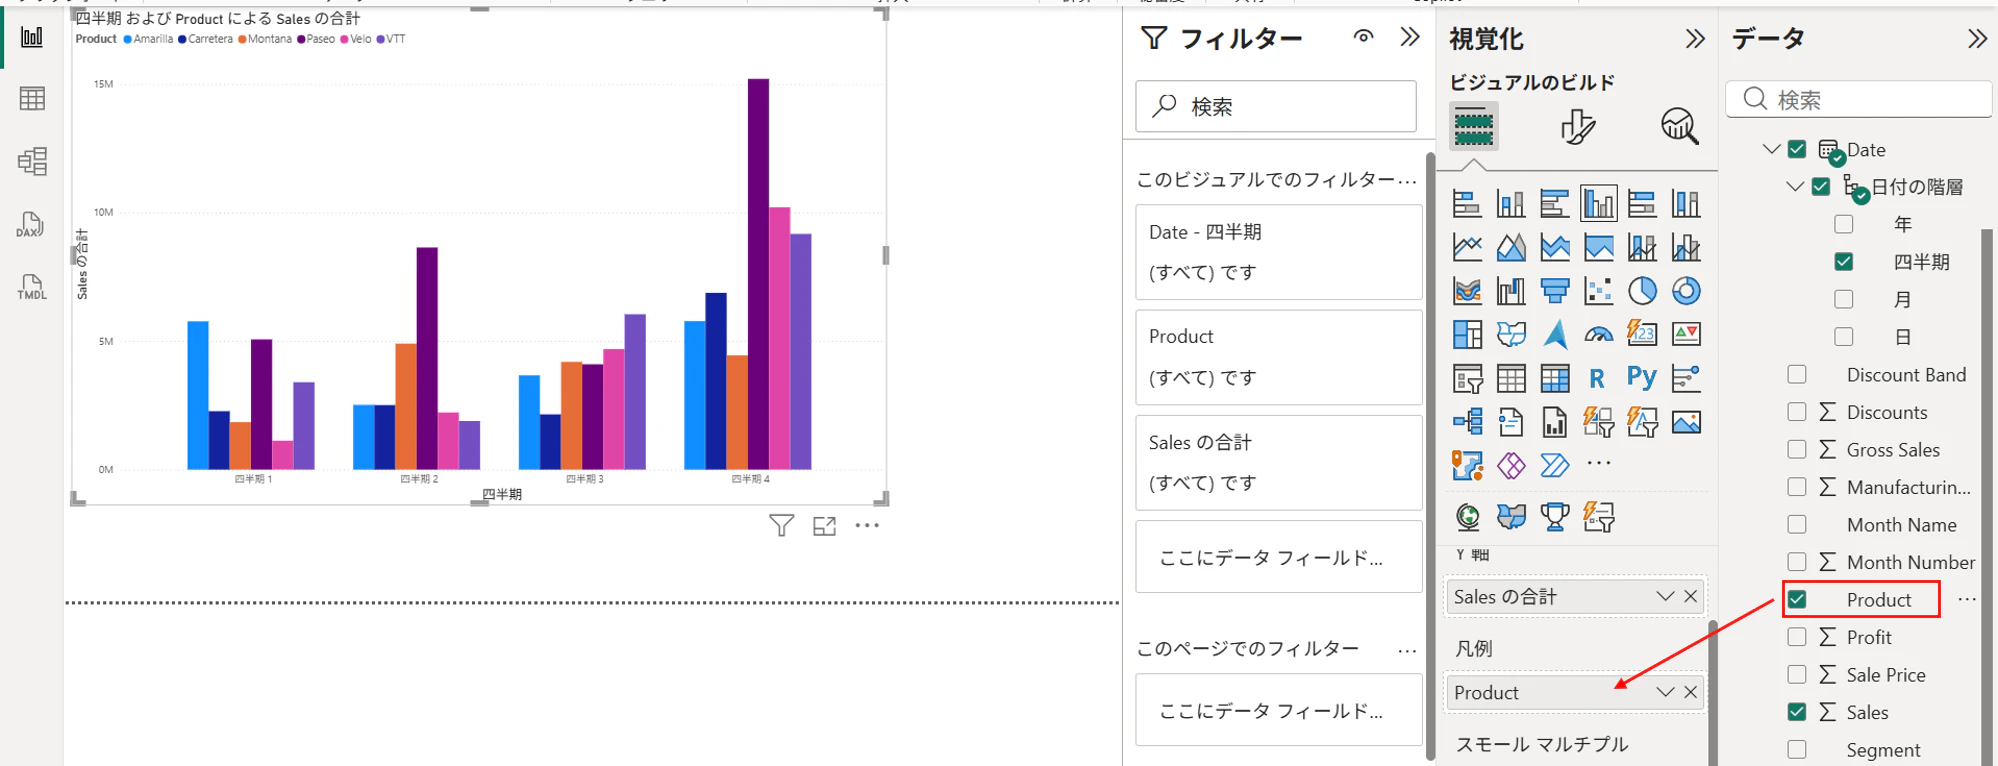
「Product」を凡例にドラッグ&ドロップ
image.png

一旦凡例の「Product」を削除して、「Profit」をY軸にドラッグ&ドロップ
2つのメジャーが並んで表示されるが、数値のレベル感が違うので見にくい
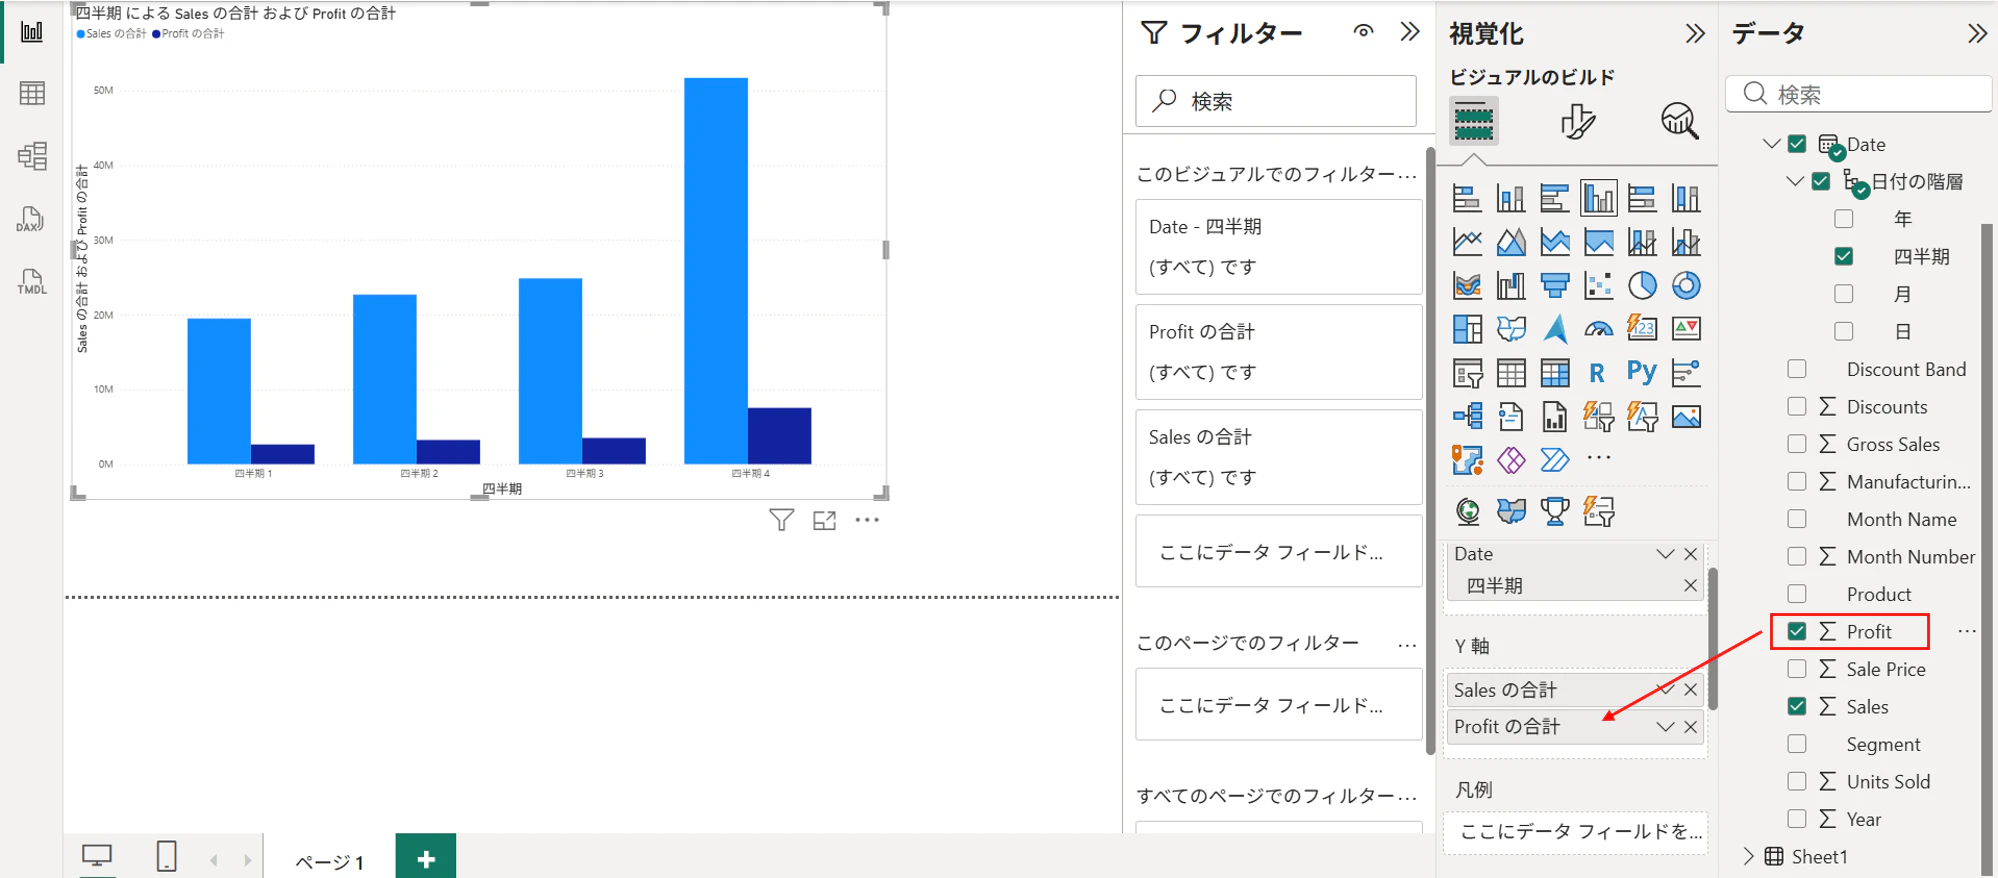
image.png

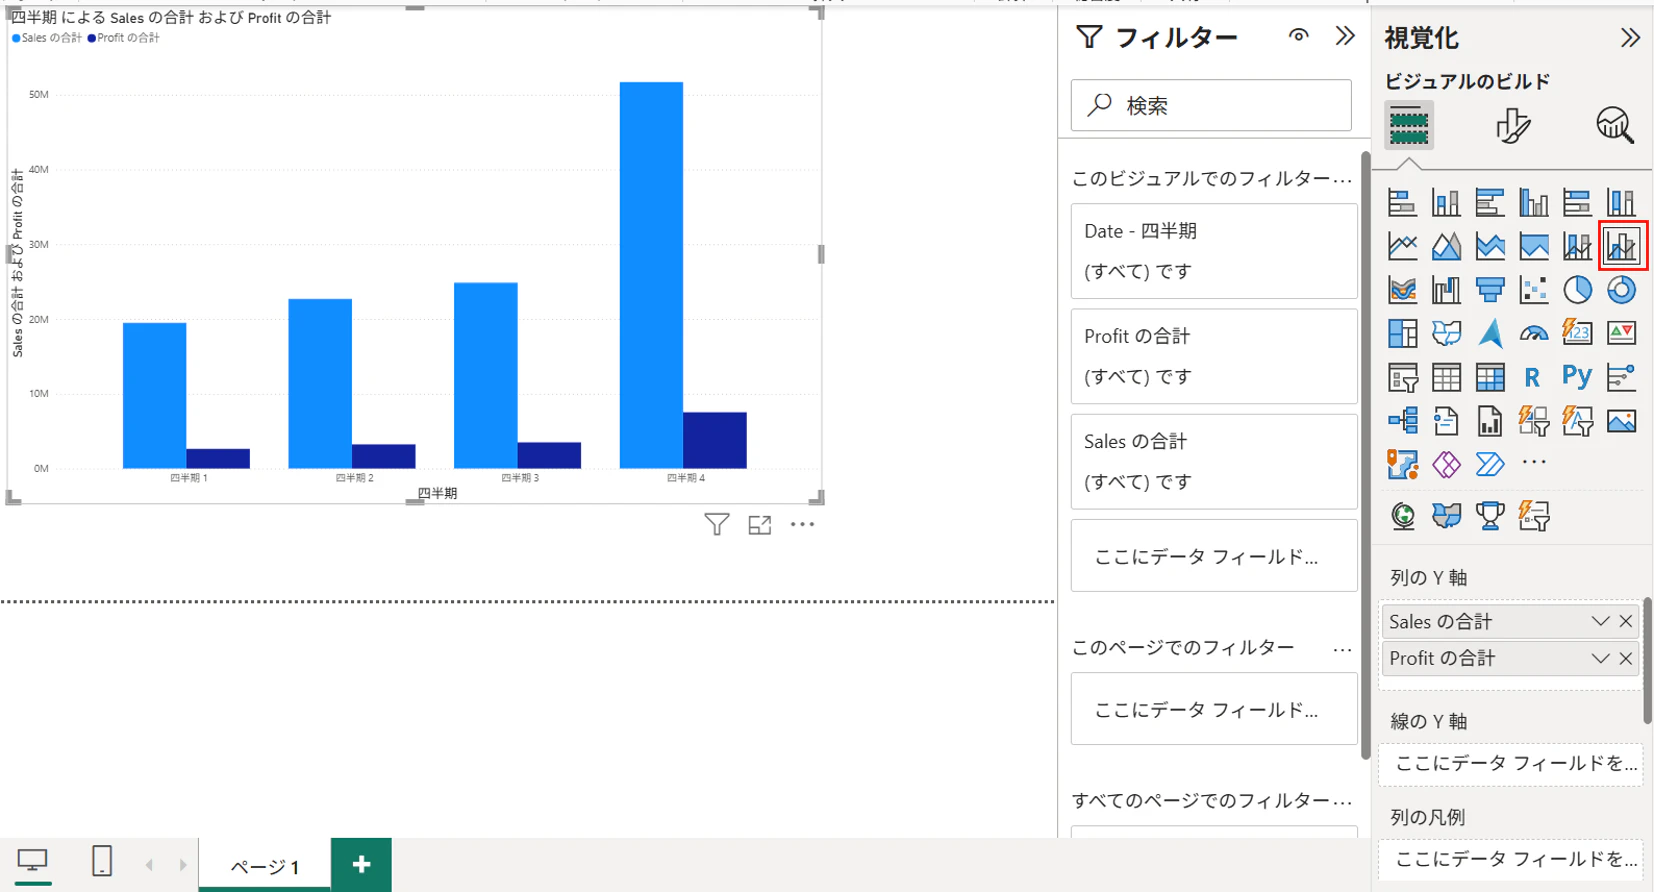
「折れ線および集合縦棒グラフ」アイコンを選択
image.png

「Profitの合計」を線のY軸にドラッグ&ドロップで移動
Profitが折れ線グラフで表示される
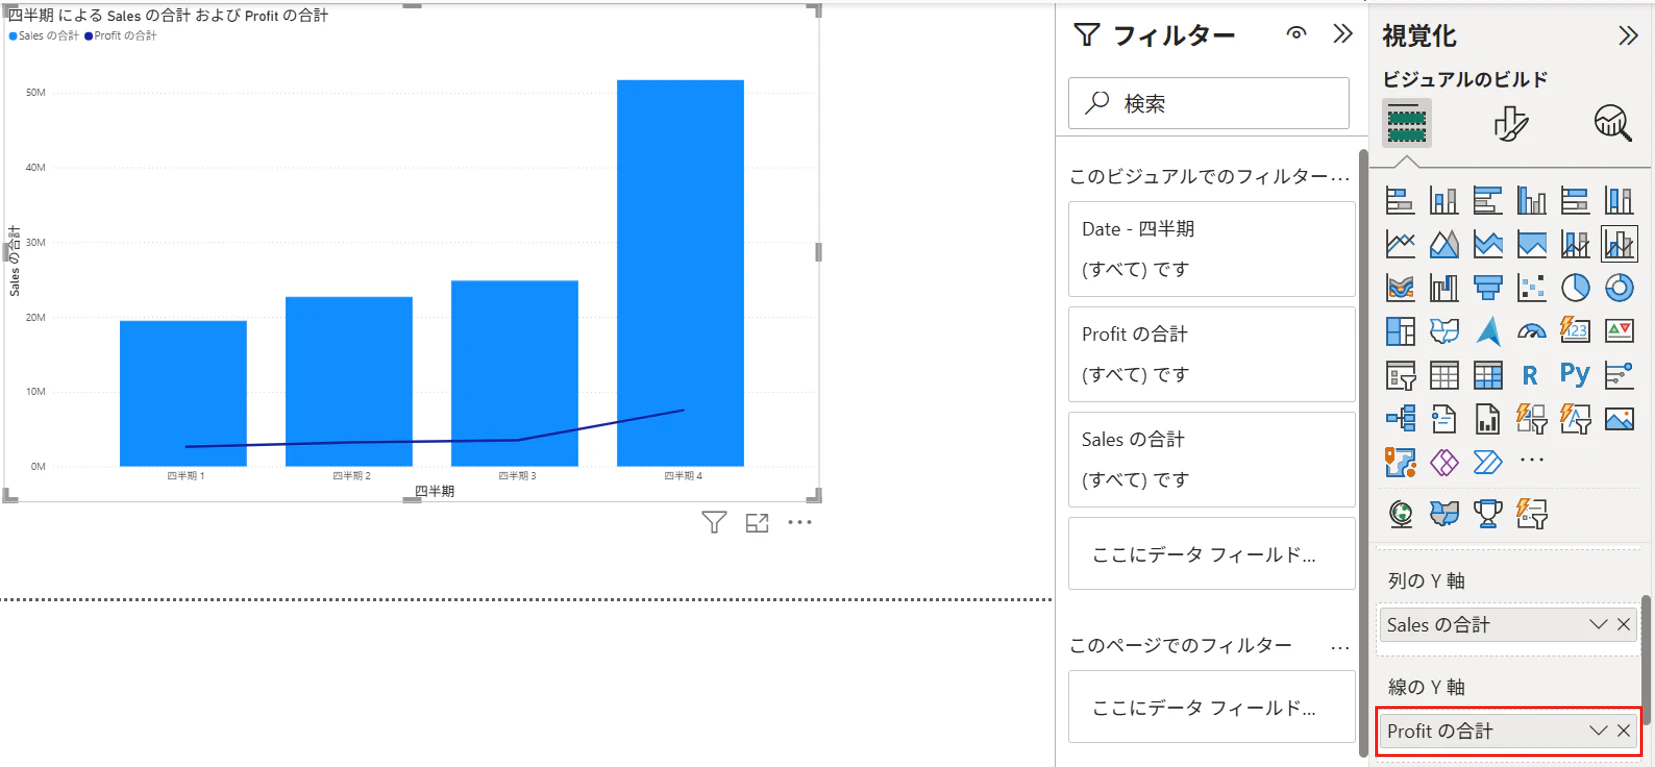
image.png

「ビジュアルの書式設定」の「第2Y軸」の「値」をONにすると、Y2軸が表示される
また折れ線グラフもY2軸のスケールに合わせた表示となる
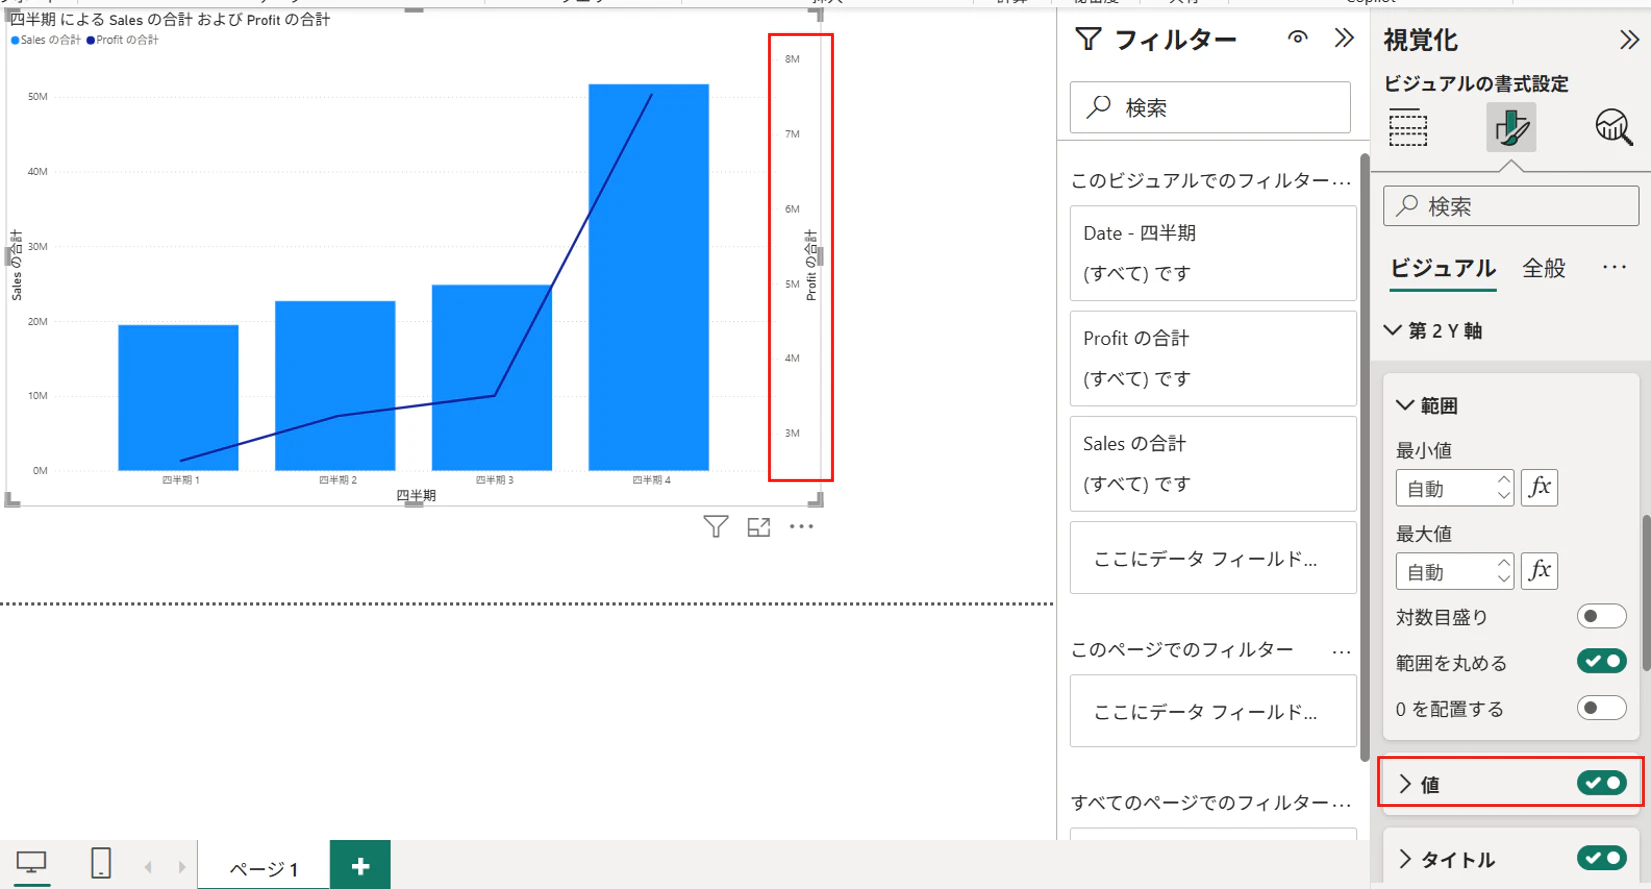
image.png

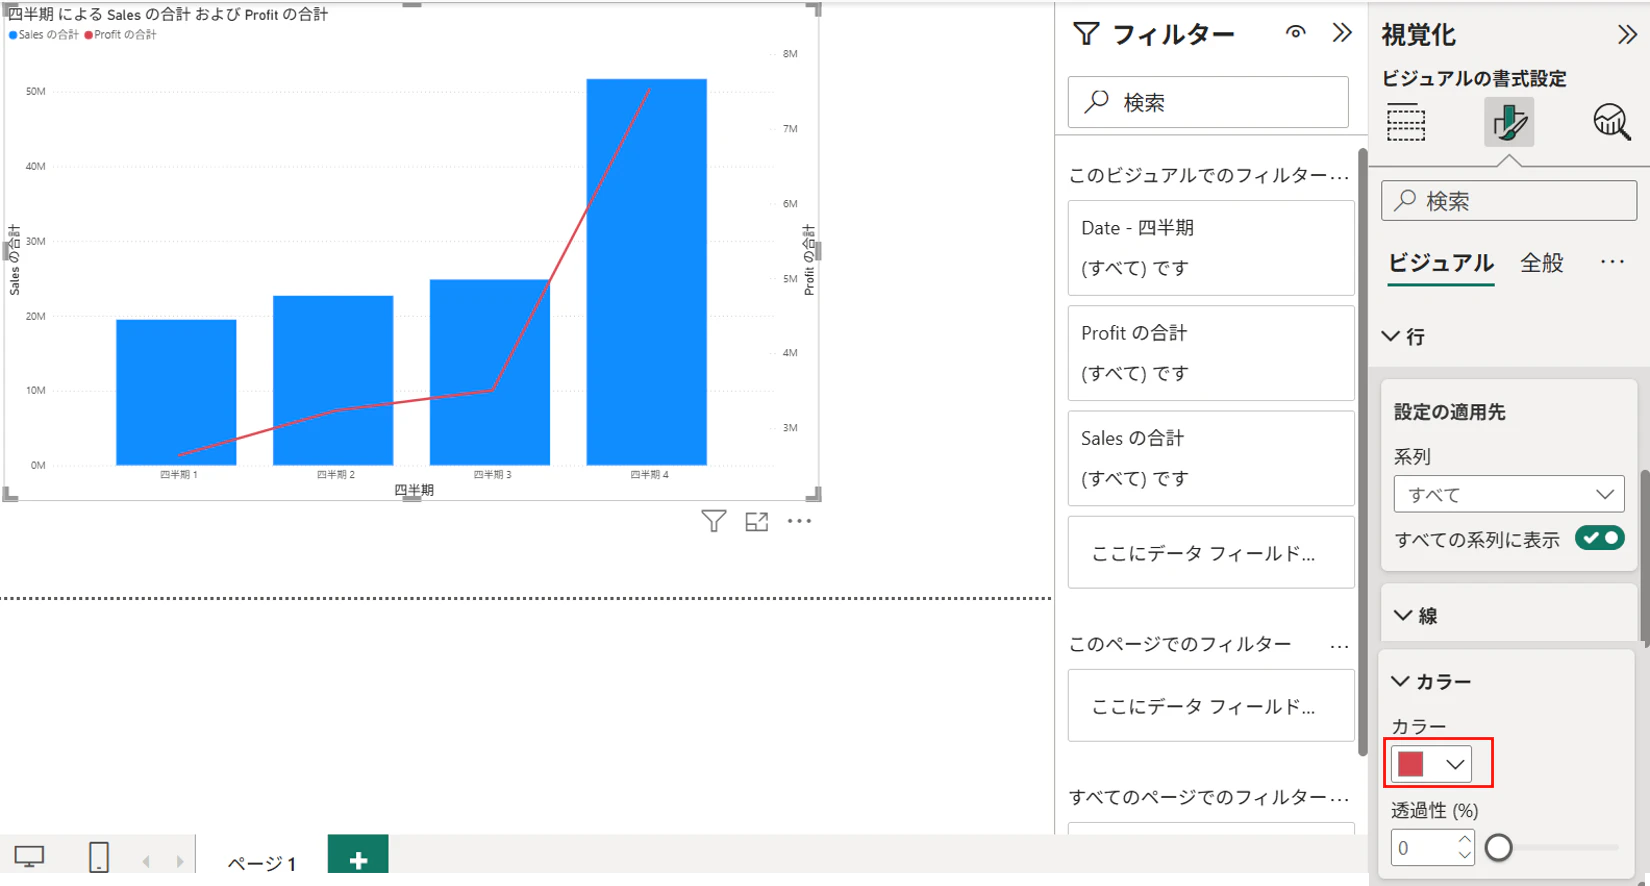
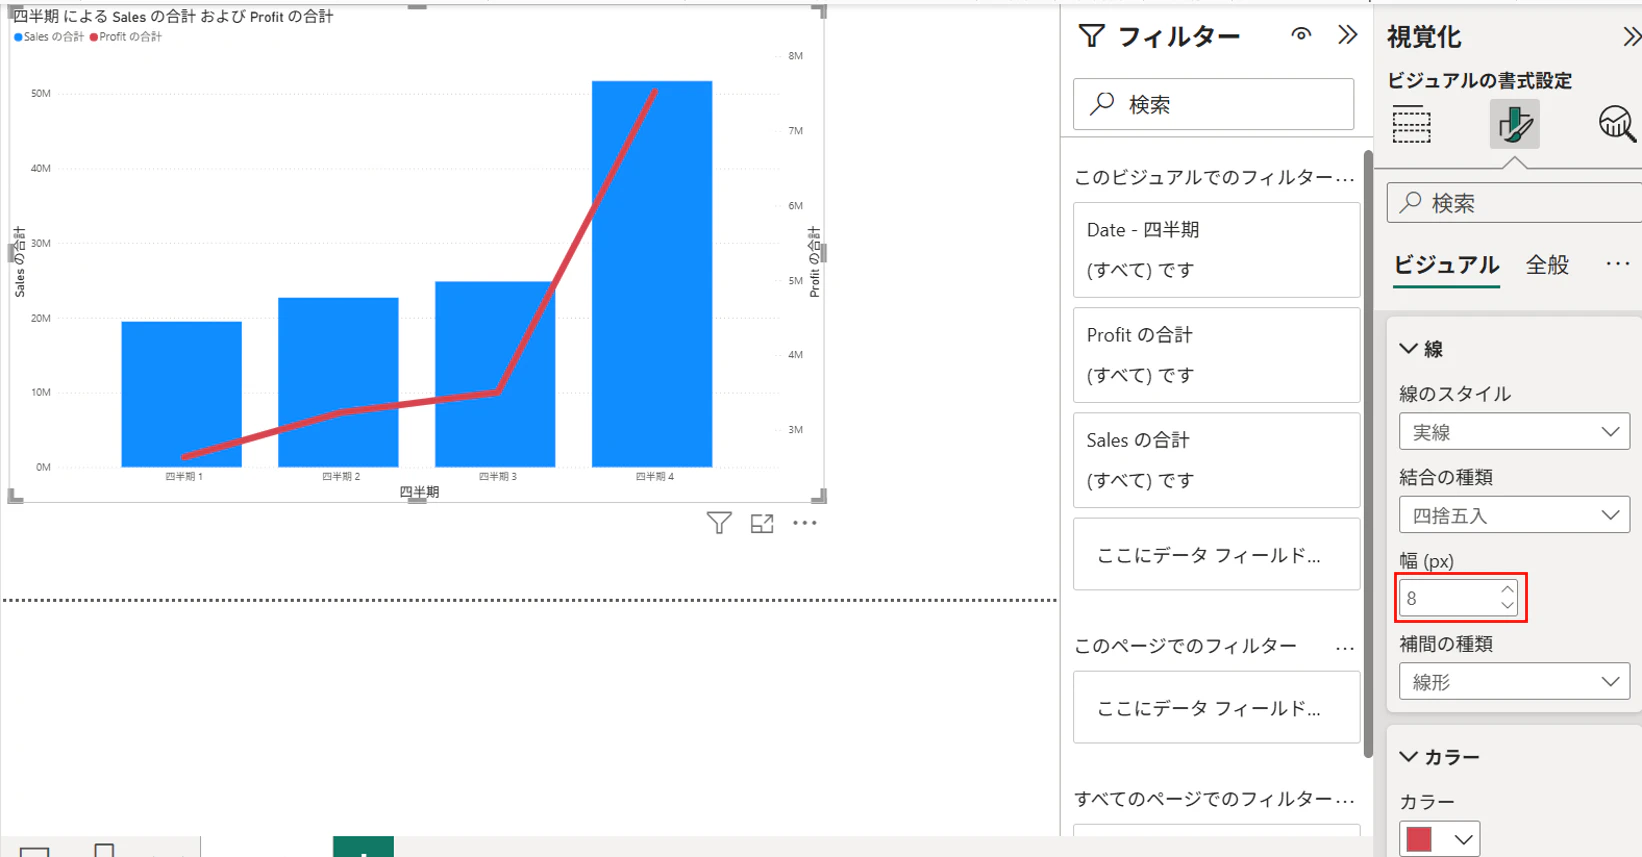
「行」の「線」の「カラー」を変更すると折れ線グラフの色が変更できる
image.png

「行」の「線」の「幅」を調整すると折れ線グラフの線の太さが変更できる
image.png

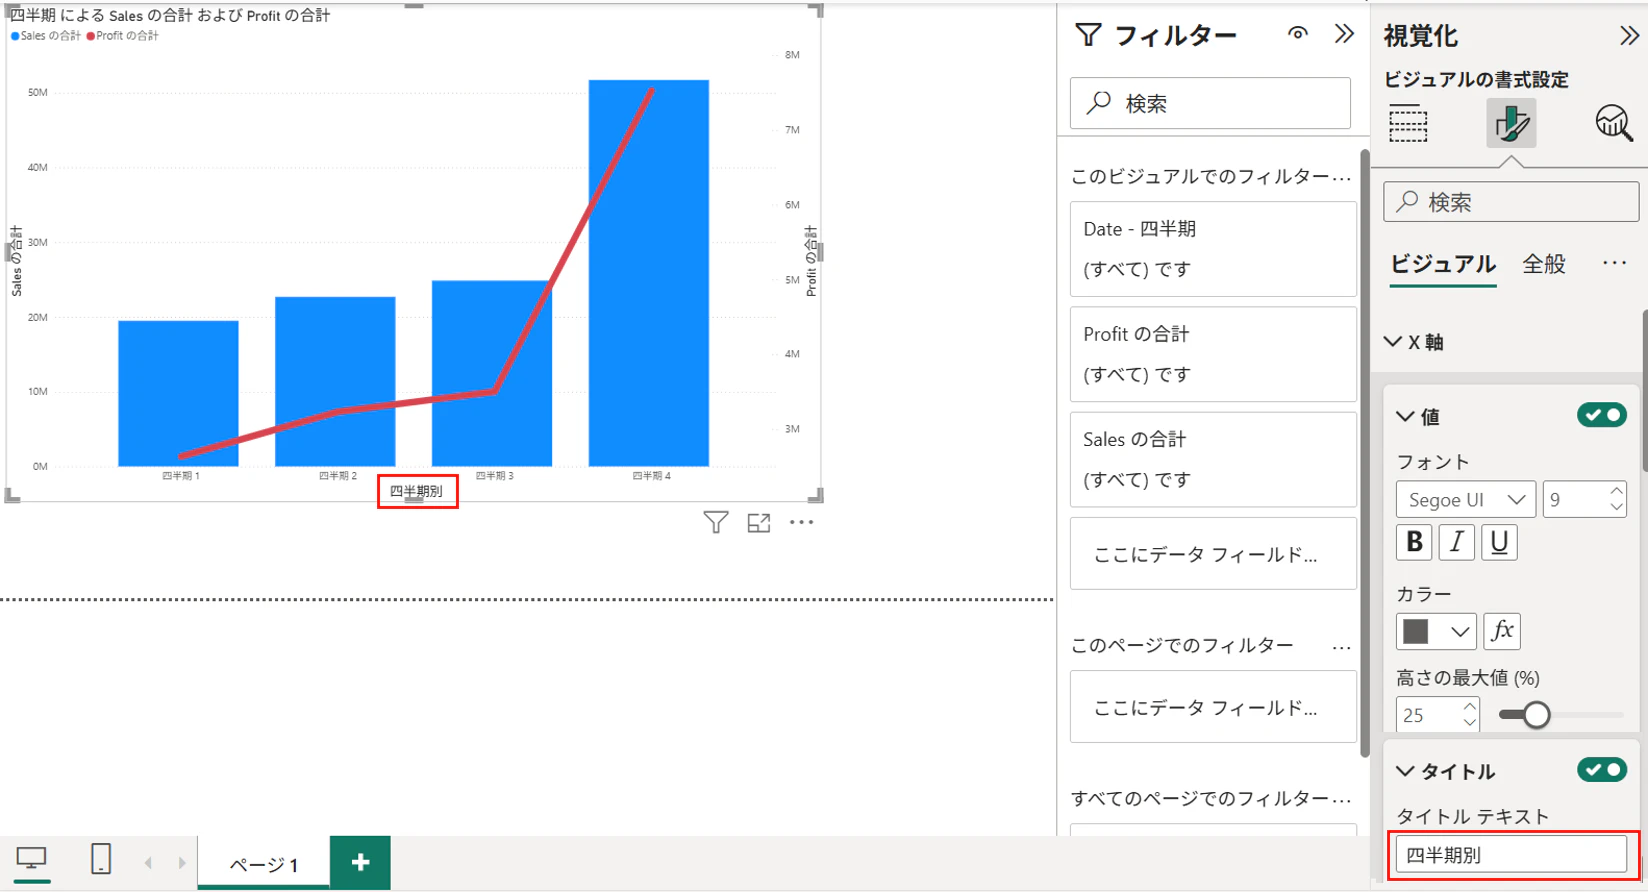
「X軸」の「タイトル」の「タイトルテキスト」からX軸タイトルの変更が可能
image.png

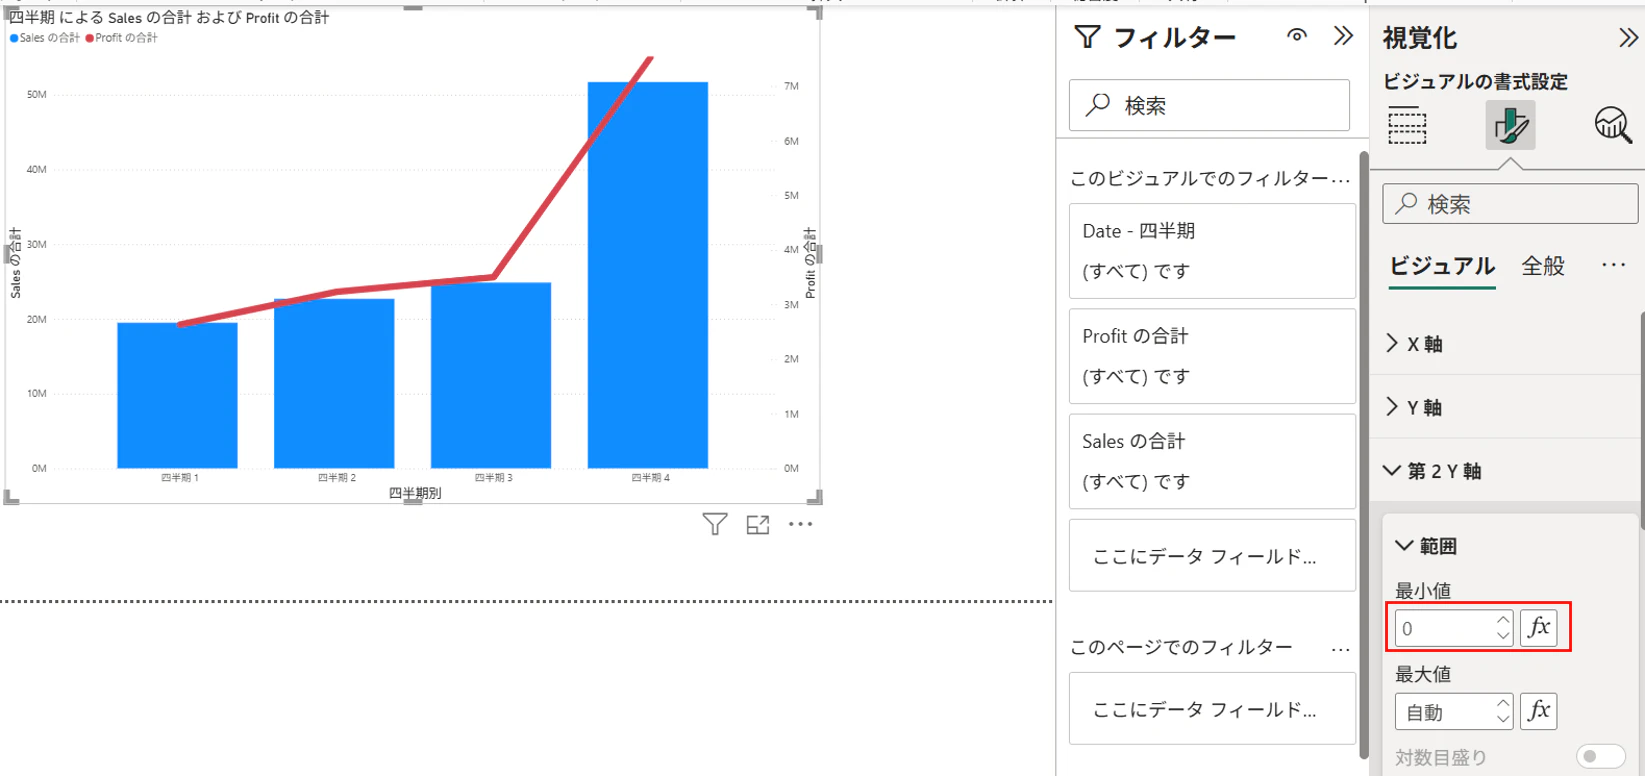
「第Y2軸」の「範囲」の「最小値」でY2軸目盛の基点の値を変更できる
image.png

「全般」の「タイトル」の設定を調整する事で、グラフのタイトルの変更が可能
image.png

0
0
0

Register as a new user and use Qiita more conveniently

  1. You get articles that match your needs
  2. You can efficiently read back useful information
  3. You can use dark theme
What you can do with signing up
0
0

Delete article

Deleted articles cannot be recovered.

Draft of this article would be also deleted.

Are you sure you want to delete this article?