0
1

Delete article

Deleted articles cannot be recovered.

Draft of this article would be also deleted.

Are you sure you want to delete this article?

Power BI のカスタム・ビジュアルのサンプルを使用する

0
Last updated at Posted at 2026-10-01

概要

Power BIの標準に無いビジュアライゼーションを自作して、Power BI Desktopで使用する事ができます。
カスタム・ビジュアルという機能になります。
Power BI Desktopのカスタム・ビジュアルのサンプルを取り込み使用する手順を紹介します。
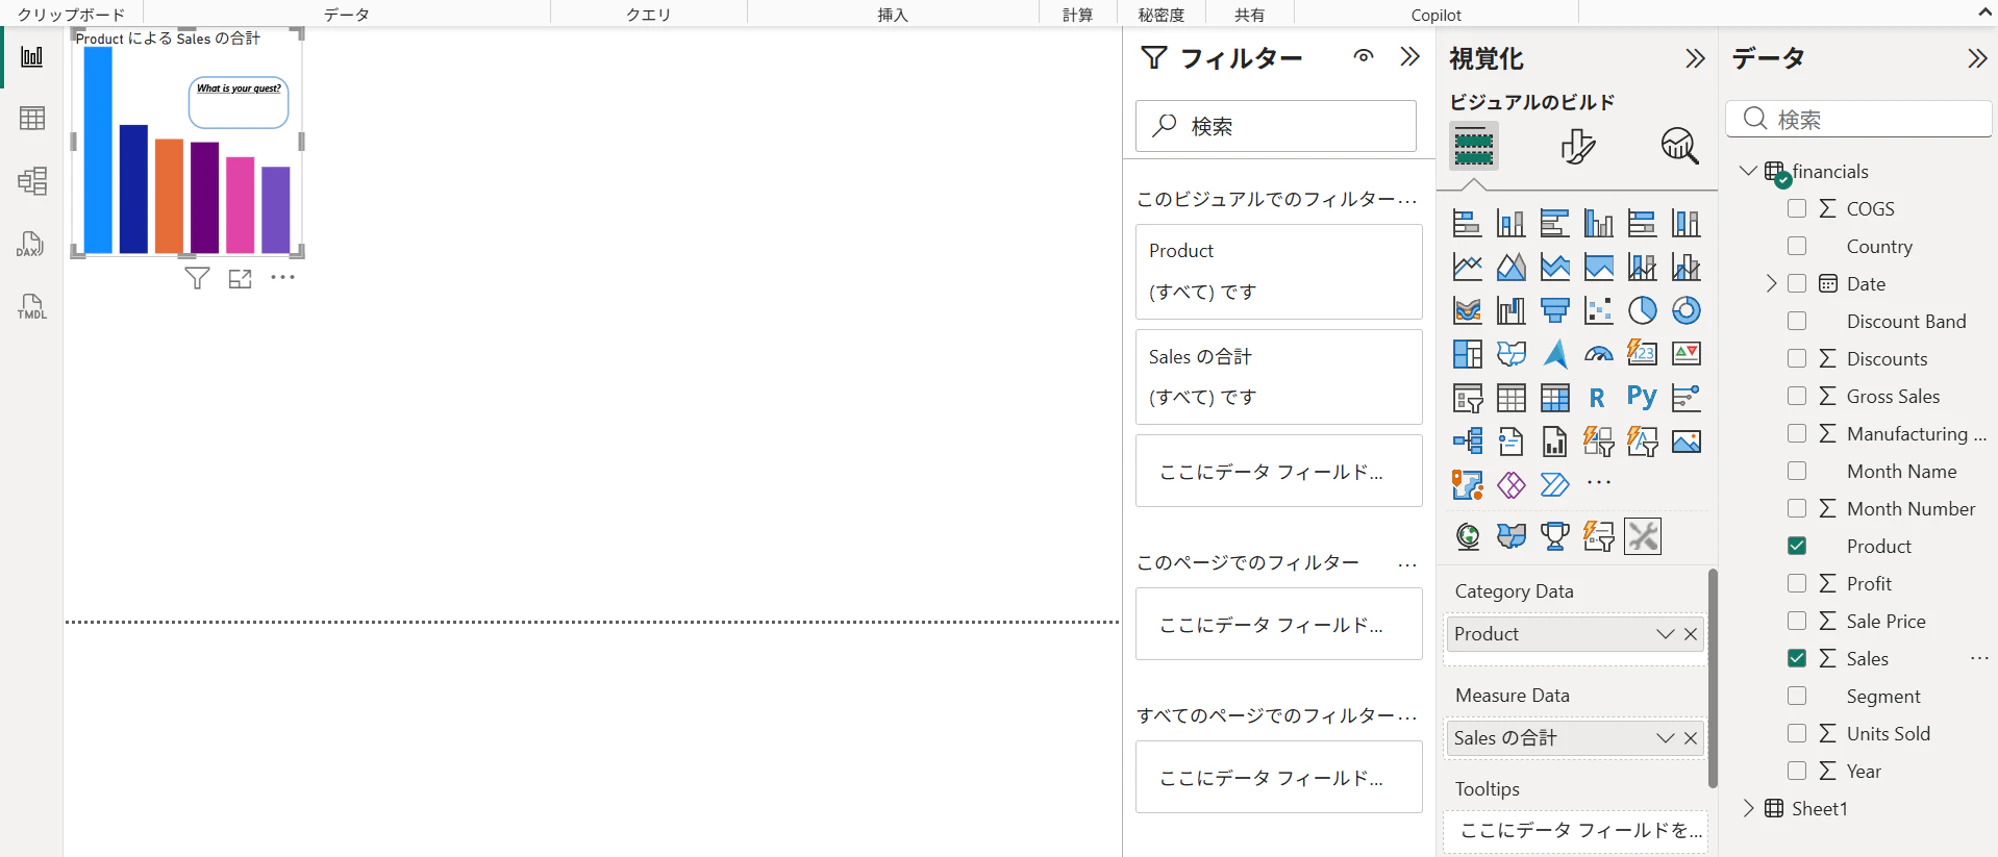
下記は、サンプルのBarグラフを使用した例です。
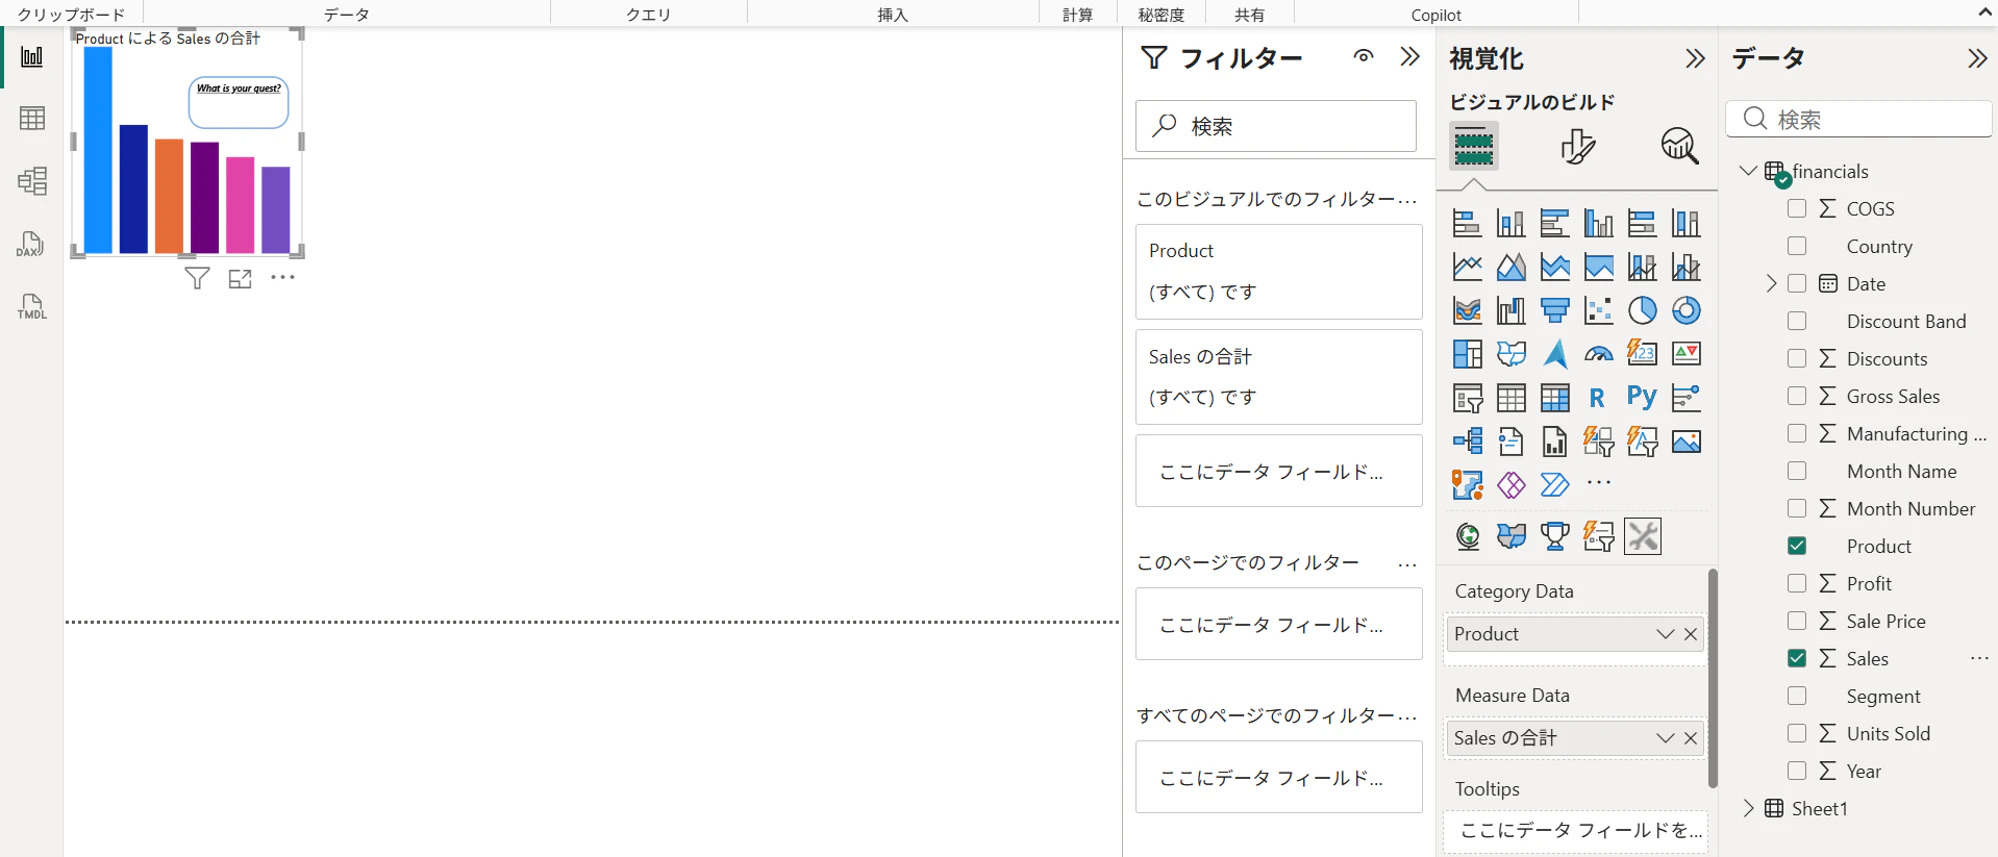
image.png

手順

GitBushから以下のコマンドでBarチャートのサンプルを取得します。

git clone https://github.com/microsoft/PowerBI-visuals-sampleBarChart.git
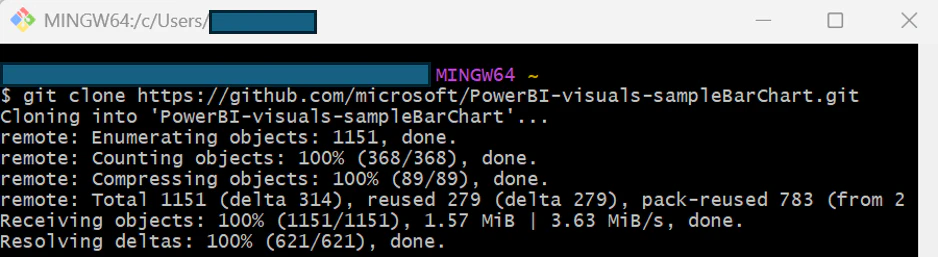
image.png

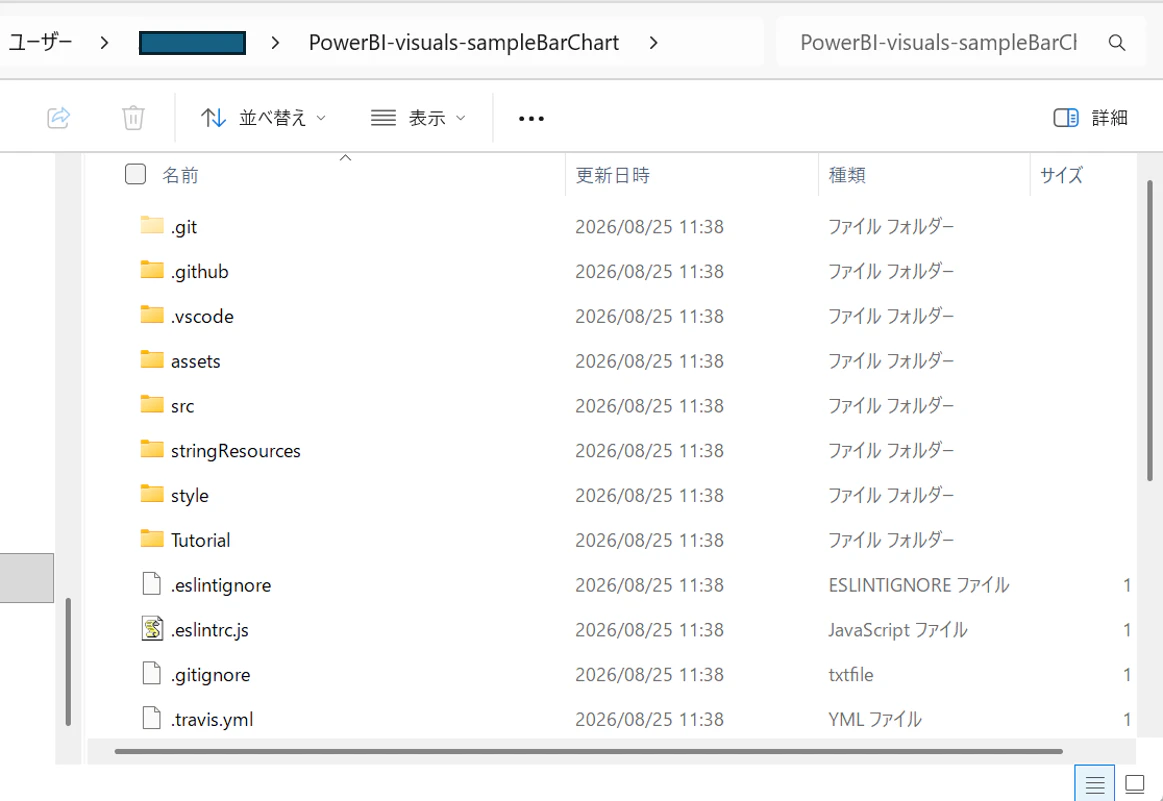
以下のフォルダに展開されます。
image.png

続けて以下のコマンドを実行します。

cd PowerBI-visuals-sampleBarChart
npm install

powerbi-visuals-toolsをインストールします。

npm install -g powerbi-visuals-tools
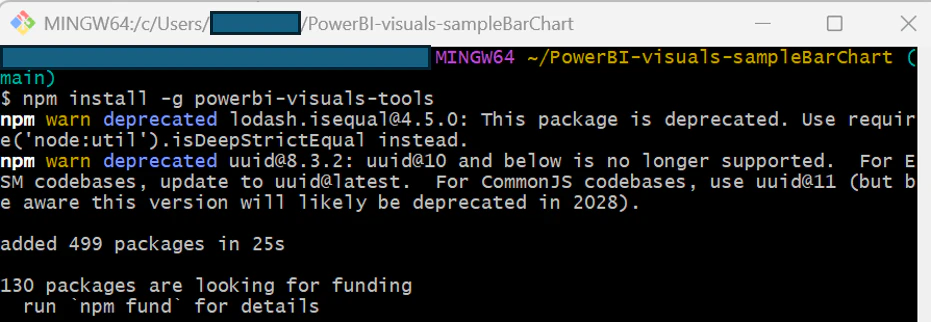
image.png

ダウンロードしたBarチャートのサンプルをパッケージ化します。

pbiviz package
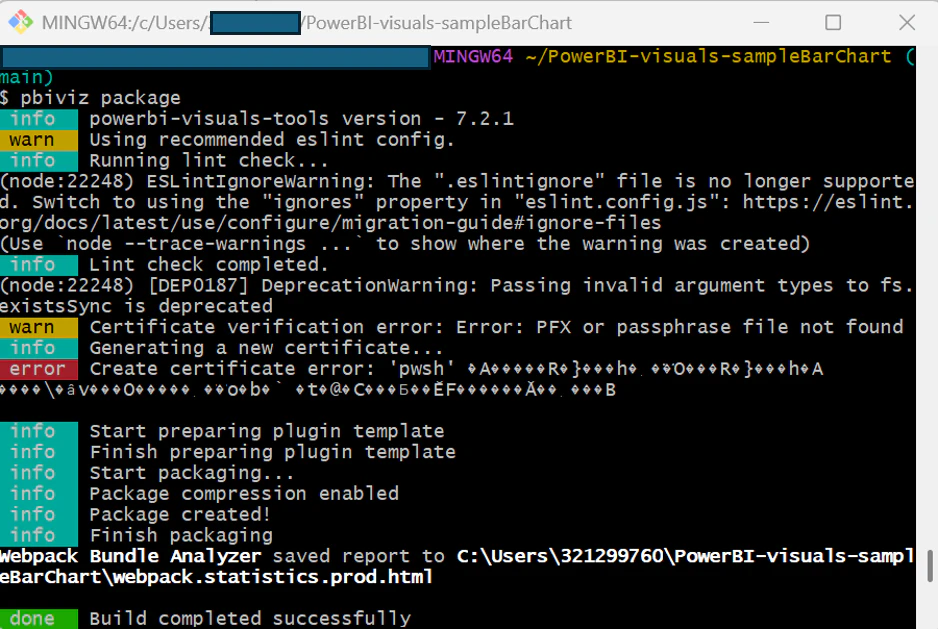
image.png

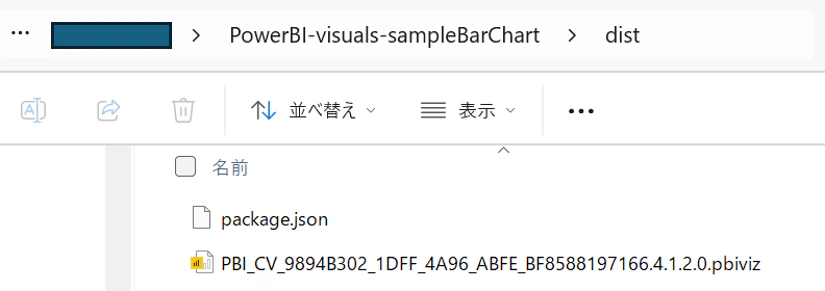
「dist」フォルダ配下にパッケージが作成されます。
image.png

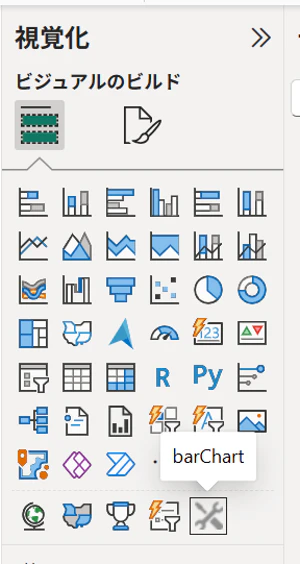
Power BI Desktopを開き「ビジュアルをファイルからインポート」
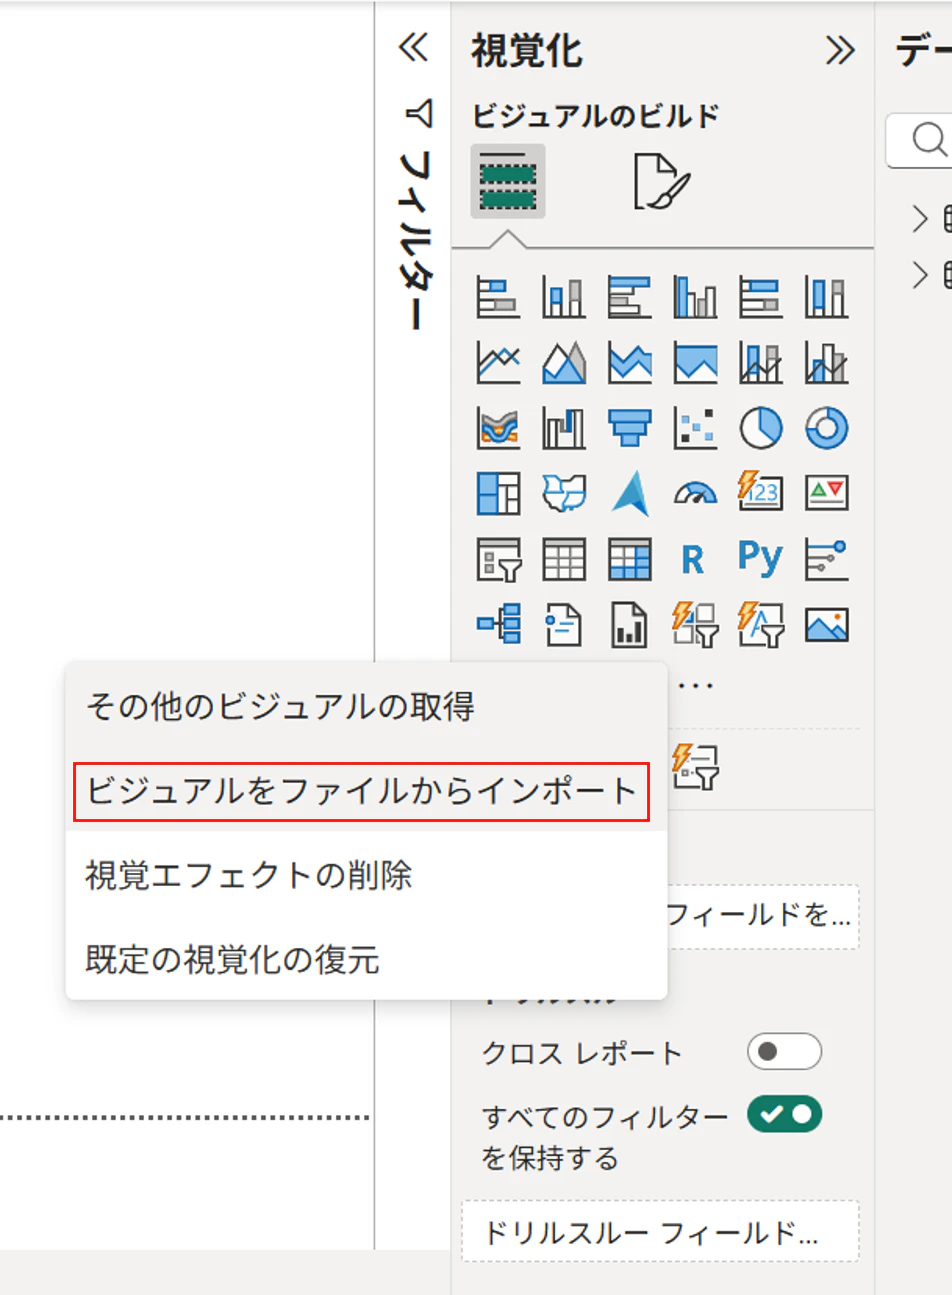
image.png

取り込んだBarチャートサンプルが使用可能となります。
image.png

通常のグラフと同様にデータアイテムを配置して使用できます。
image.png

0
1
0

Register as a new user and use Qiita more conveniently

  1. You get articles that match your needs
  2. You can efficiently read back useful information
  3. You can use dark theme
What you can do with signing up
0
1

Delete article

Deleted articles cannot be recovered.

Draft of this article would be also deleted.

Are you sure you want to delete this article?