0
0

Delete article

Deleted articles cannot be recovered.

Draft of this article would be also deleted.

Are you sure you want to delete this article?

Power BI で視覚化からのドリルスルーを実施する

0
Last updated at Posted at 2026-10-01

概要

Power BIでページをまたがる視覚化間のドリルスルーを実装します。

ソース側ページでUSAのバーを右クリックして、「ドリルスルー」から「ページ2」を選択します。
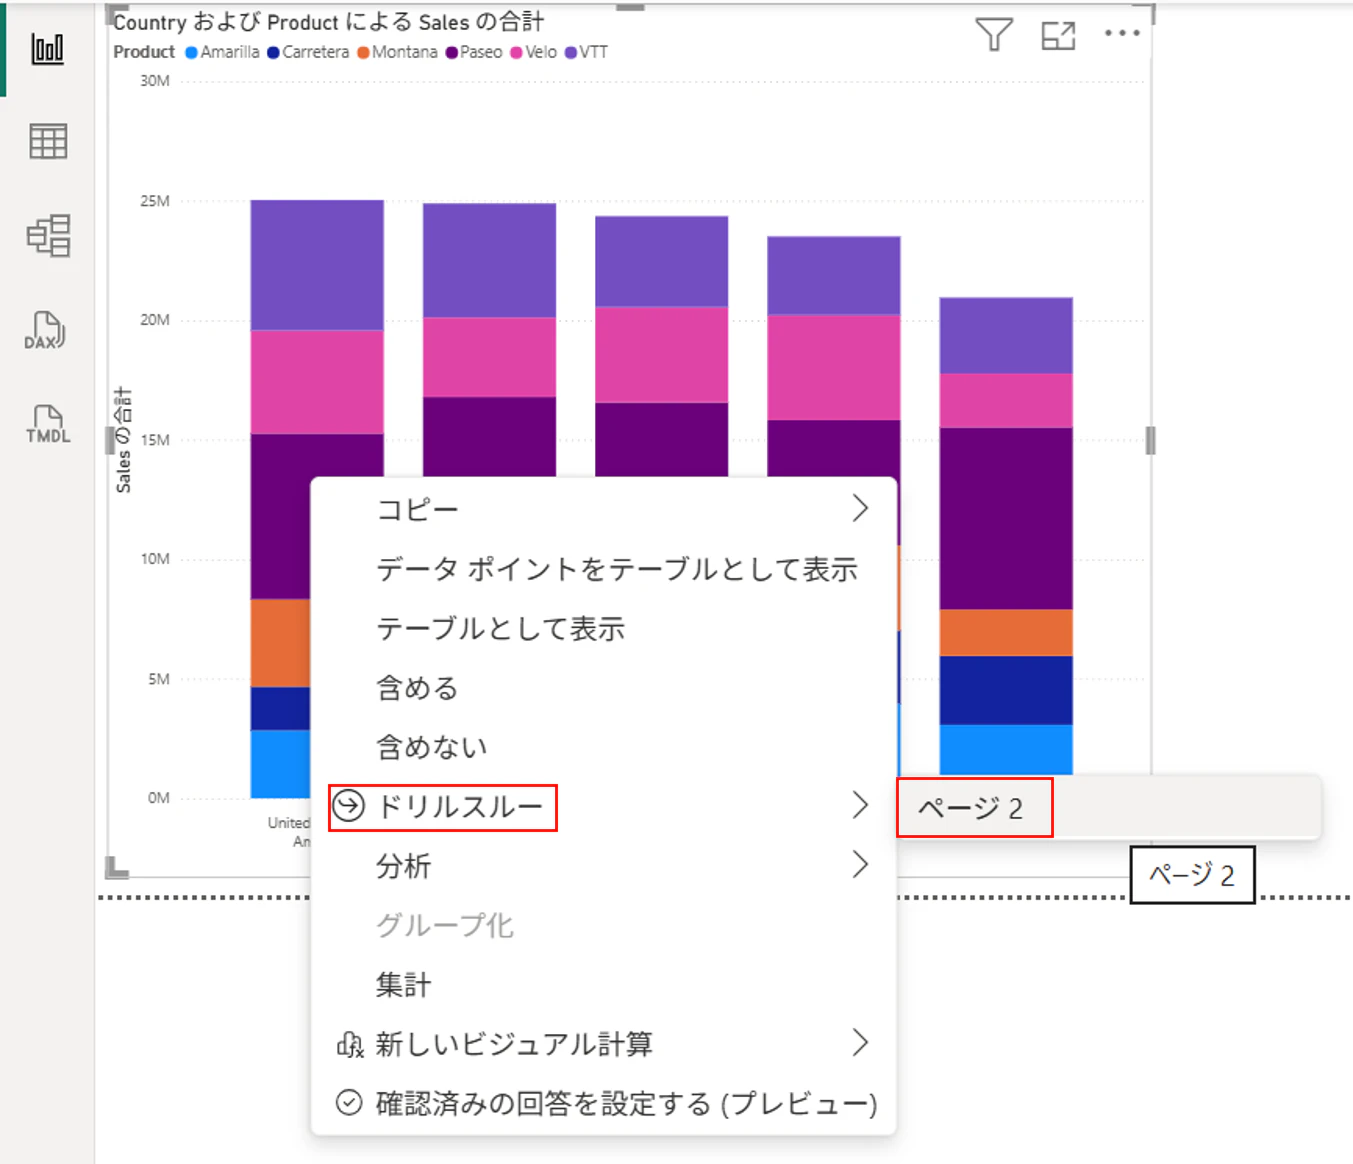
image.png

ターゲット側ページに遷移し「USA」のみにフィルターされている事がわかります。
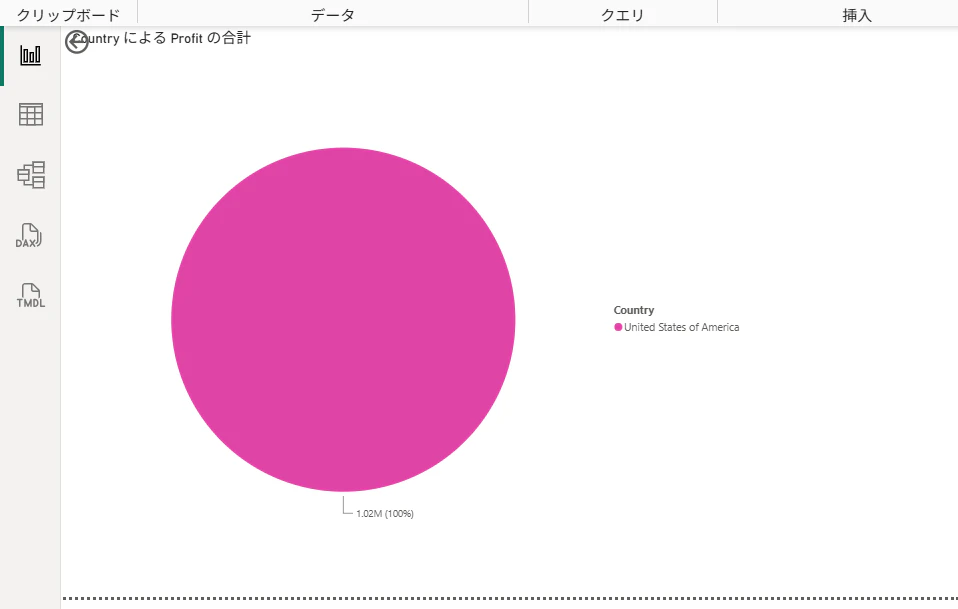
image.png

手順

Power BIでは「ページ間ドリルスルー」 という機能を使って再現します。遷移先のページ側で「どの項目を受け取るか」を設定する、という発想で設定するのが特徴です。

1ページ目に棒グラフを作成します。
X軸にCountry、Y軸にSales、凡例にProductを配置します。
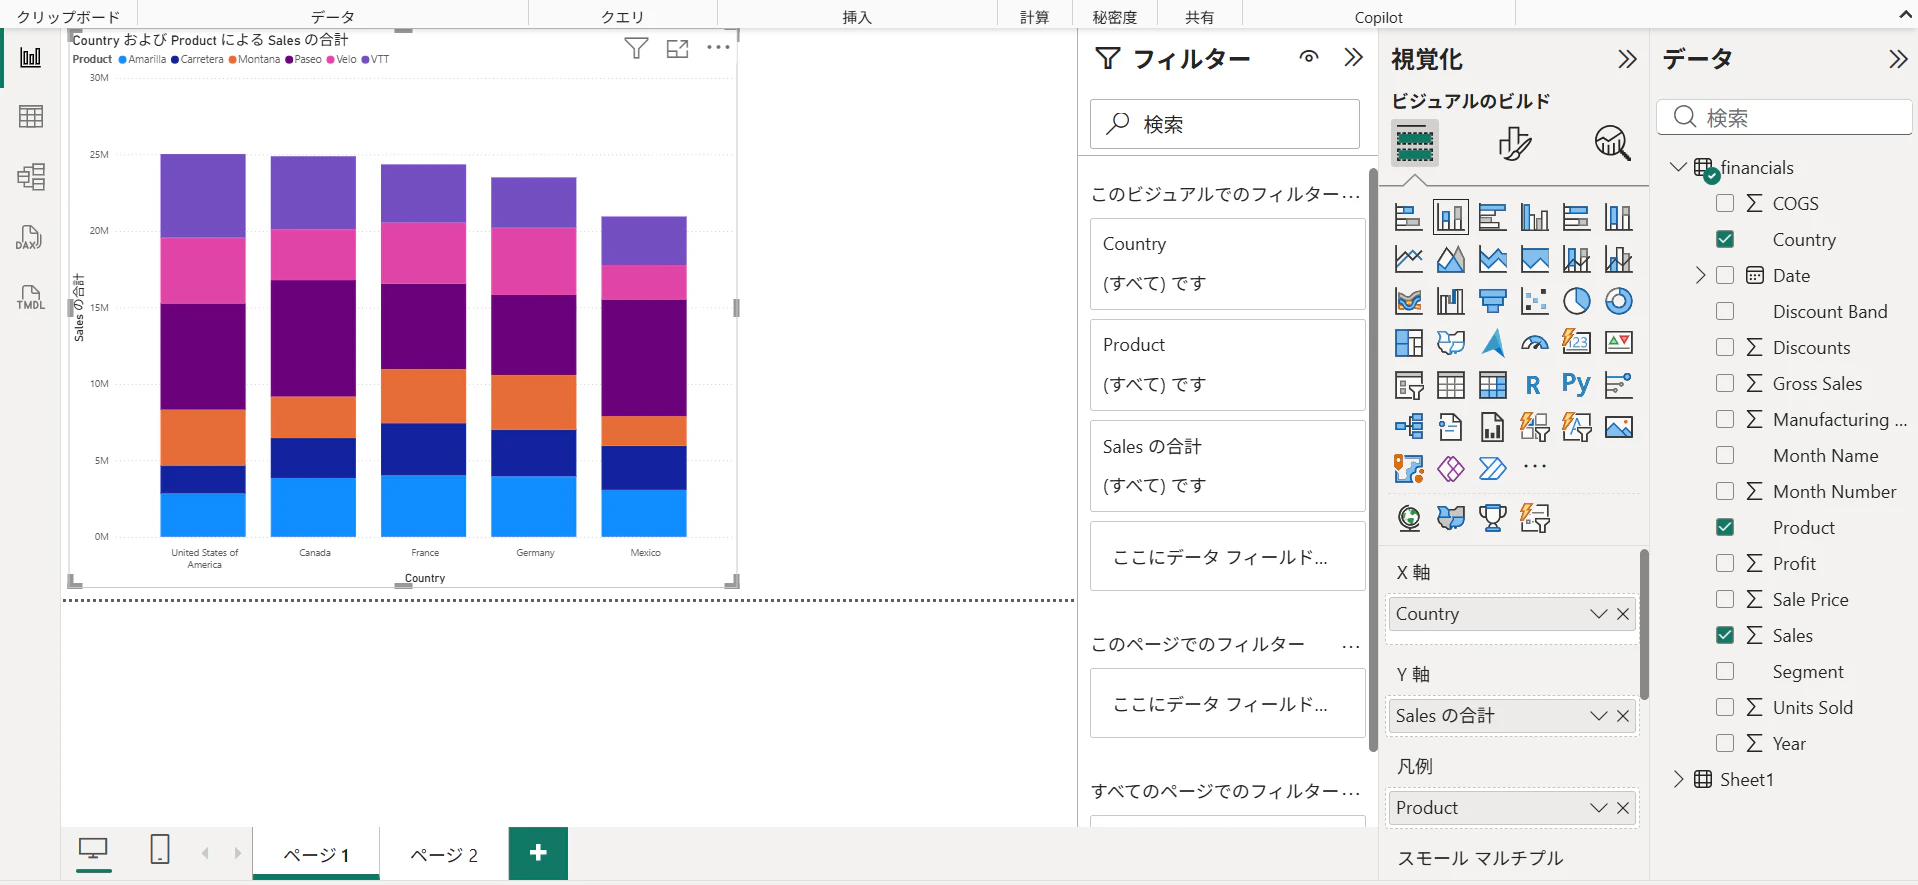
image.png

2ページ目に円グラフを作成します。
凡例にCountry、値にProfitを配置します。
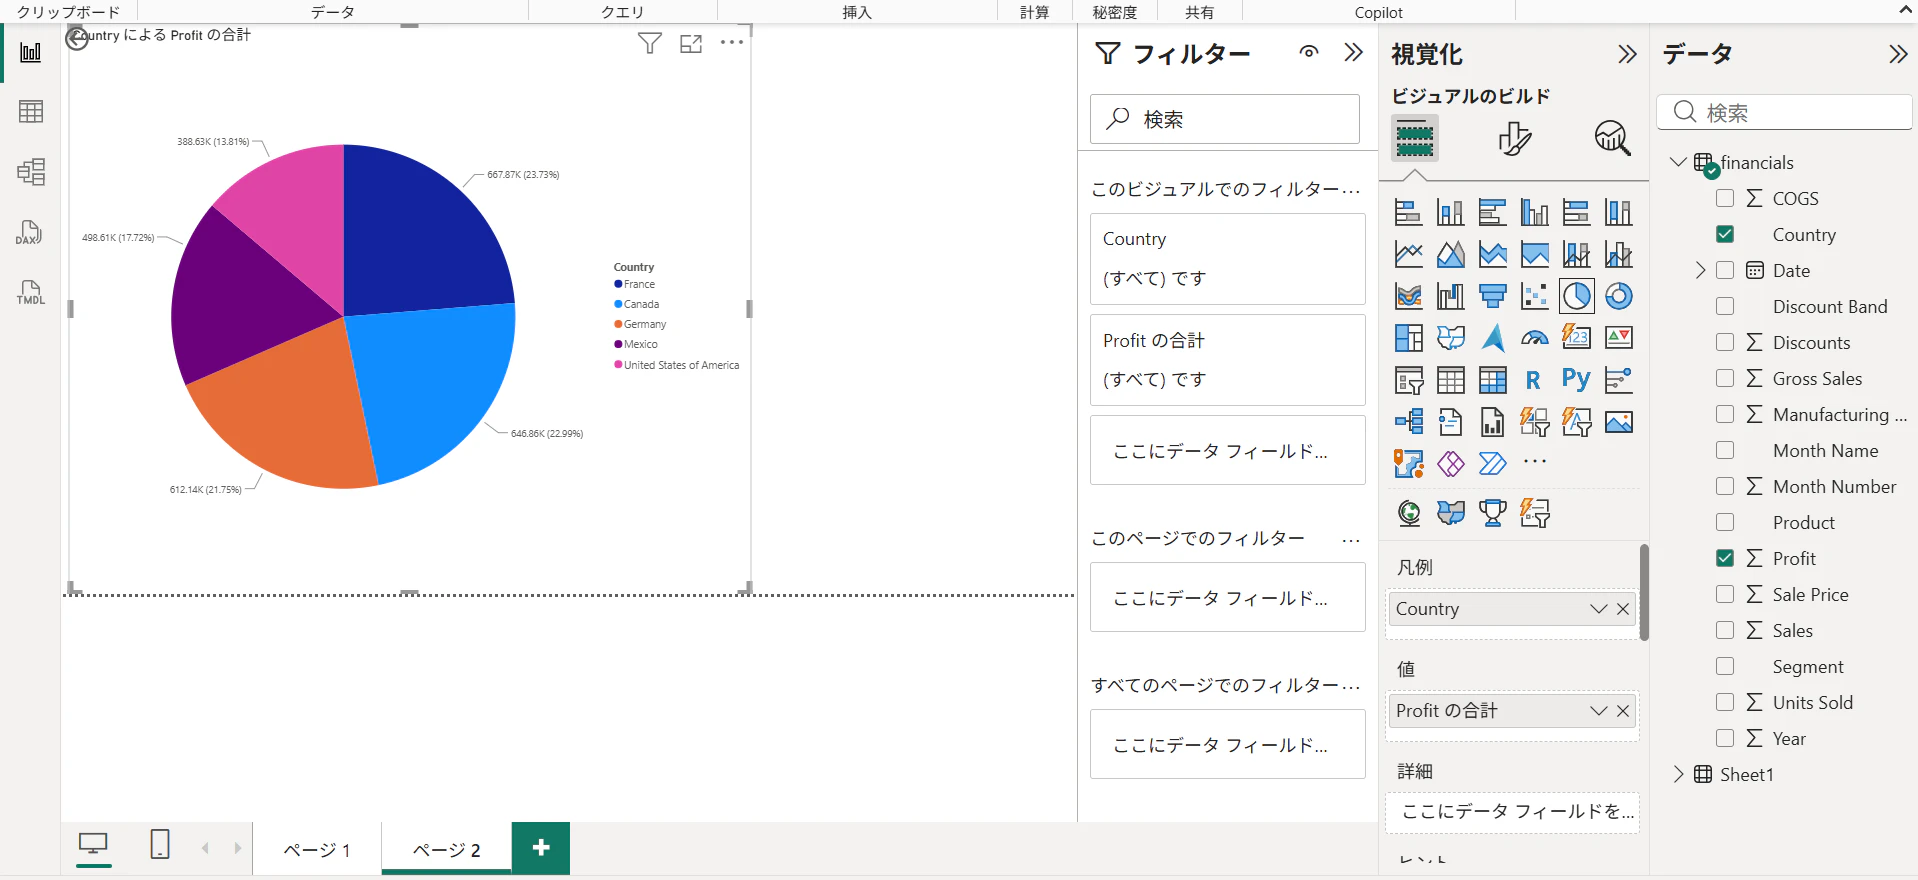
image.png

ページ2の視覚化のプロパティの下の方で、ドリルスルーの設定で以下のように「Country」を指定します。
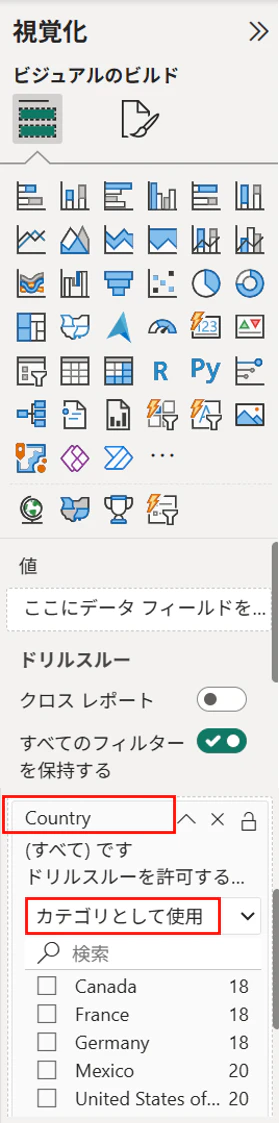
image.png

ページ1でUSAのバーを右クリックして、「ドリルスルー」から「ページ2」を選択します。
image.png

ページ2に遷移し「USA」のみにフィルターされている事がわかります。
image.png

0
0
0

Register as a new user and use Qiita more conveniently

  1. You get articles that match your needs
  2. You can efficiently read back useful information
  3. You can use dark theme
What you can do with signing up
0
0

Delete article

Deleted articles cannot be recovered.

Draft of this article would be also deleted.

Are you sure you want to delete this article?