熱伝導問題を解く
領域内の温度分布の熱伝導率依存性をパラメータースタディによって確認する。
問題設定
2次元の熱伝導問題。
幅 30,高さ 5の2次元領域内の熱伝導を解いた。
FreeFEM 公式ドキュメントのThermal Conductionの例題に従って支配方程式、境界条件を設定。
https://doc.freefem.org/tutorials/thermalConduction.html
load "iovtk"

// Parameters
func u0 = 10. + 90.*x/6.;
func k = 1.8*(y<0.5) + 0.2;
real ue = 25.;
real alpha=0.25;
real T=5.;
real dt=0.1 ;

// Mesh
mesh Th = square(30, 5, [6.*x,y]);

// Fespace
fespace Vh(Th, P1);
Vh u=u0, v, uold;

// Problem
problem thermic(u, v)
    = int2d(Th)(
          u*v/dt
        + k*(
              dx(u) * dx(v)
            + dy(u) * dy(v)
        )
    )
    + int1d(Th, 1, 3)(
          alpha*u*v
    )
    - int1d(Th, 1, 3)(
          alpha*ue*v
    )
    - int2d(Th)(
          uold*v/dt
    )
    + on(2, 4, u=u0)
    ;

// Time iterations
int[int] Order = [1];
string DataName = "u";
ofstream ff("thermic.dat");
for(real t = 0; t < T; t += dt){
    uold = u; //equivalent to u^{n-1} = u^n
    thermic; //here the thermic problem is solved
    ff << u(3., 0.5) << endl;
    plot(u);
    savevtk("u"+ t*10 +".vtu", Th, u, dataname=DataName, order=Order);
}
FreeFEMのインストール、実行方法、Paraviewでの可視化方法はこちらの記事を参照。
https://qiita.com/banapa0610/items/2453155a7ef31c05e54c
https://qiita.com/banapa0610/items/3016e4c5357671d89454
熱伝導率の定義
ソースコード内のkが熱伝導率。kの値を変えパラメータースタディを行った。
k = 1.8*(y<0.5) + 0.2;
の表記は解析領域内でyが0.5未満の場合kは 2.0
yが0.5以上の場合kは0.2となるという定義。
領域内のyの位置によって熱伝導率が異なるという境界条件。
(と認識してますが、もし違ってたらご指摘ください。)
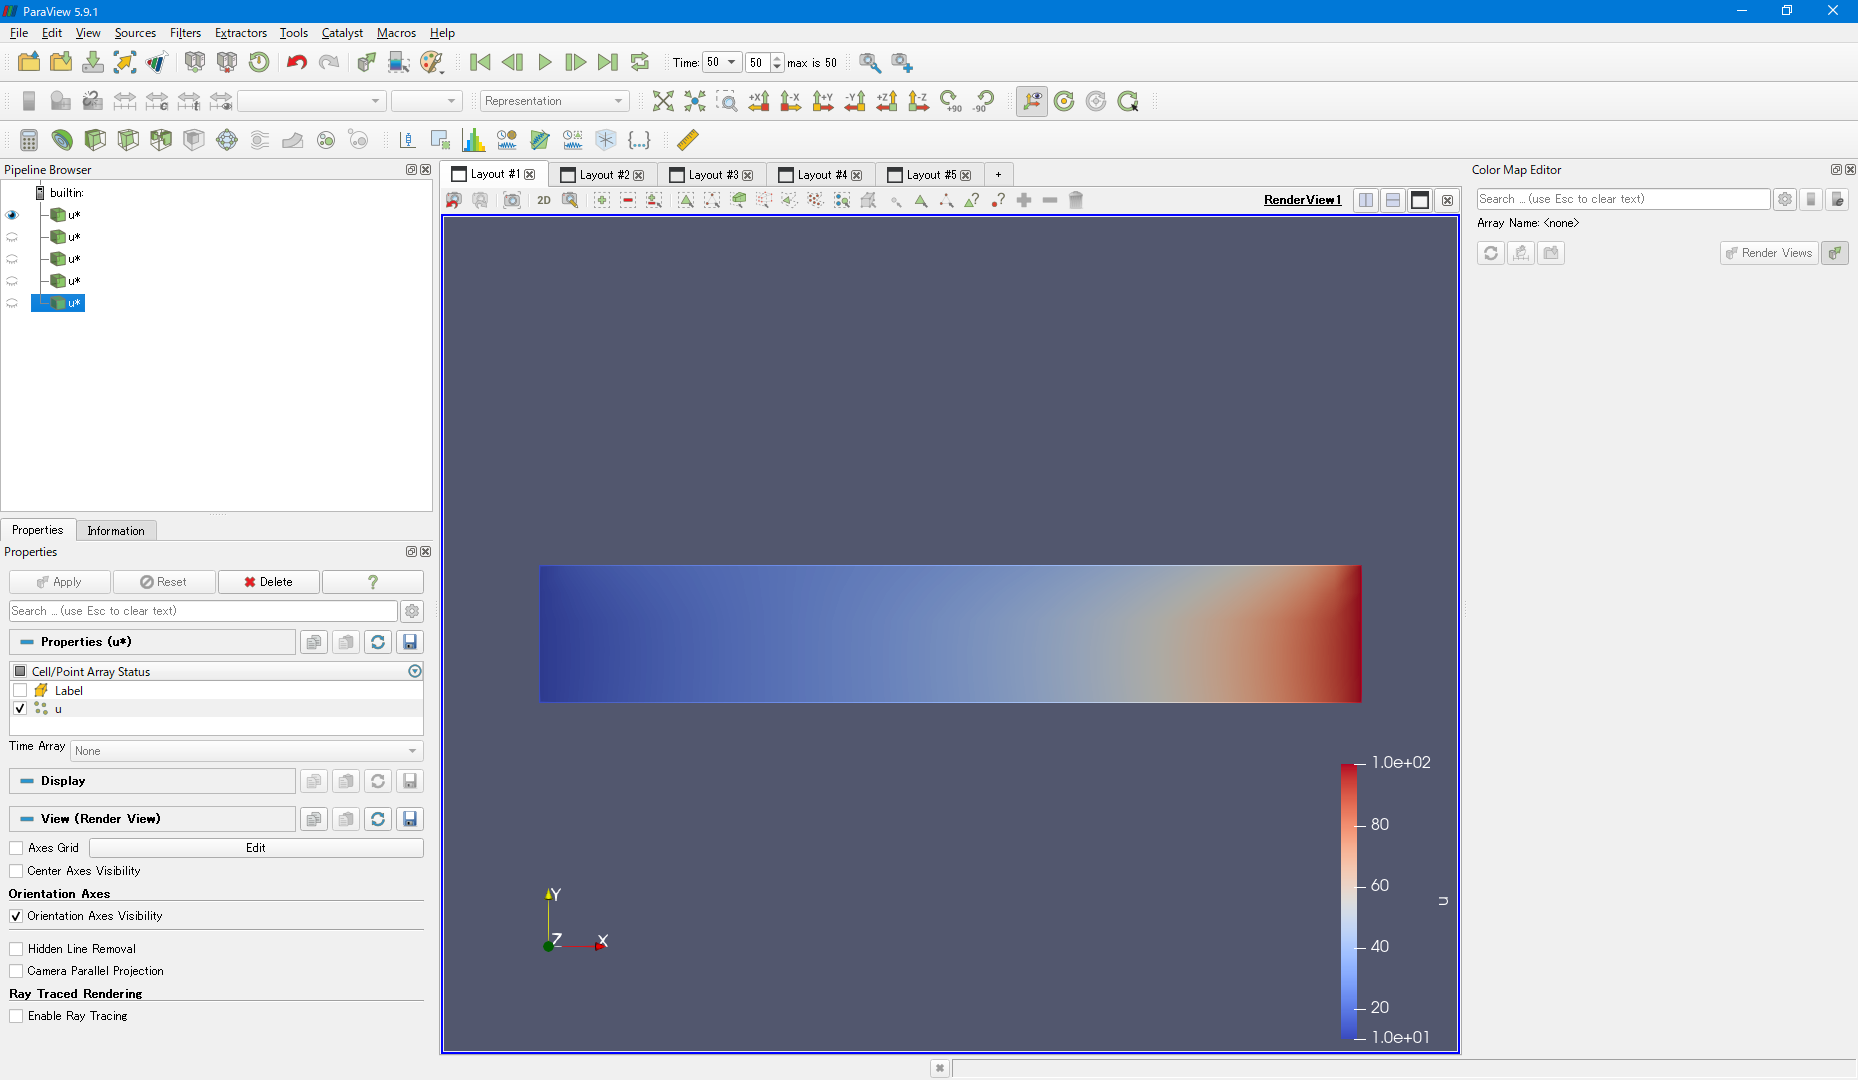
結果
初期状態から5秒後の領域の温度分布を示す。
- k = 1.8*(y<0.5) + 0.2
例題のデフォルトの数値
2)k = 0.05*(y<0.5) + 0.2;
熱伝導率を小さくした場合。熱が伝わりにくくなっている(高温の分布が狭い)ことが分かる。

3)k = 398*(y<0.5) + 0.2;
熱伝導率を大きくした場合。y<0.5の範囲で熱が伝わりやすくなっている(高温の分布が広くなっている)ことが分かる。
y=1付近では熱が伝わりにくい様子もわかる。

4)k = 200*(y<0.5) + 400;
0.5<yの熱伝導率を大きくした場合。0.5<yでも熱が伝わりやすく(高温の分布が広くなっている)y方向で温度分布が同様になっている様子が分かる。

5)k = 1500*(y<0.05) + 0.2;
y<0.05の熱伝導率を大きくした場合。3)の条件に比べ高温が分布している範囲がy方向下側にシフトしていることが分かる。
以上、WSL版FreeFEMとParaviewを使って、熱伝導問題における熱伝導率についてのパラメータースタディができた。
参考文献
FreeFEMの理解のためにこちらの記事を参考させていただきました。