WSL環境でFreeFEMを使う
wsl環境だとgnuplotでの可視化にxmingが必要だったりで、計算結果が可視化しずらかったのでParaviewで可視化した。
公式チュートリアルを解く
FreeFEMの公式ドキュメントのThermal Conductionを例題として実施する
問題設定と境界条件は公式を参照されたい。
// Parameters
func u0 = 10. + 90.*x/6.;
func k = 1.8*(y<0.5) + 0.2;
real ue = 25.;
real alpha=0.25;
real T=5.;
real dt=0.1 ;

// Mesh
mesh Th = square(30, 5, [6.*x,y]);

// Fespace
fespace Vh(Th, P1);
Vh u=u0, v, uold;

// Problem
problem thermic(u, v)
    = int2d(Th)(
          u*v/dt
        + k*(
              dx(u) * dx(v)
            + dy(u) * dy(v)
        )
    )
    + int1d(Th, 1, 3)(
          alpha*u*v
    )
    - int1d(Th, 1, 3)(
          alpha*ue*v
    )
    - int2d(Th)(
          uold*v/dt
    )
    + on(2, 4, u=u0)
    ;

// Time iterations
ofstream ff("thermic.dat");
for(real t = 0; t < T; t += dt){
    uold = u; //equivalent to u^{n-1} = u^n
    thermic; //here the thermic problem is solved
    ff << u(3., 0.5) << endl;
    plot(u);
}
Paraviewで読み込める形式で出力
Paraviewはvtkファイルでしか読み込めないので、上記のサンプルコードの結果をvtkファイル形式で書き出す。
公式チュートリアルのVisuallizationを参考に作成した。
load "iovtk"

mesh Th = square(10, 10, [2*x-1, 2*y-1]);

fespace Vh(Th, P1);
Vh u=2-x*x-y*y;

int[int] Order = [1];
string DataName = "u";
savevtk("u.vtu", Th, u, dataname=DataName, order=Order);
1行目のload文と下3行でvtkファイルに書き出しているので、その部分を先のThermal Conductionに追加する。
load "iovtk" //追記

// Parameters
func u0 = 10. + 90.*x/6.;
func k = 1.8*(y<0.5) + 0.2;
real ue = 25.;
real alpha=0.25;
real T=5.;
real dt=0.1 ;

// Mesh
mesh Th = square(30, 5, [6.*x,y]);

// Fespace
fespace Vh(Th, P1);
Vh u=u0, v, uold;

// Problem
problem thermic(u, v)
    = int2d(Th)(
          u*v/dt
        + k*(
              dx(u) * dx(v)
            + dy(u) * dy(v)
        )
    )
    + int1d(Th, 1, 3)(
          alpha*u*v
    )
    - int1d(Th, 1, 3)(
          alpha*ue*v
    )
    - int2d(Th)(
          uold*v/dt
    )
    + on(2, 4, u=u0)
    ;

// Time iterations
int[int] Order = [1];  //追記
string DataName = "u";  //追記
ofstream ff("thermic.dat");
for(real t = 0; t < T; t += dt){
    uold = u; //equivalent to u^{n-1} = u^n
    thermic; //here the thermic problem is solved
    ff << u(3., 0.5) << endl;
    plot(u);
    savevtk("u"+ t*10 +".vtu", Th, u, dataname=DataName, order=Order); //追記
}
savevtkの第一引数は書き出すファイル名。
paraviewで時系列の結果を表示するため、for文中で各時間の結果を書き出した。
paraviewで読み込む際にグループファイルとして認識される。
for文では時間刻み0.5秒で計算しているが、parviewで表示の時間刻みが1ステップ単位のため、経過時間をそのままファイル名とするとうまく表示できなかったため、経過時間を10倍したを数値をファイル名に着けたし書き出した。
可視化
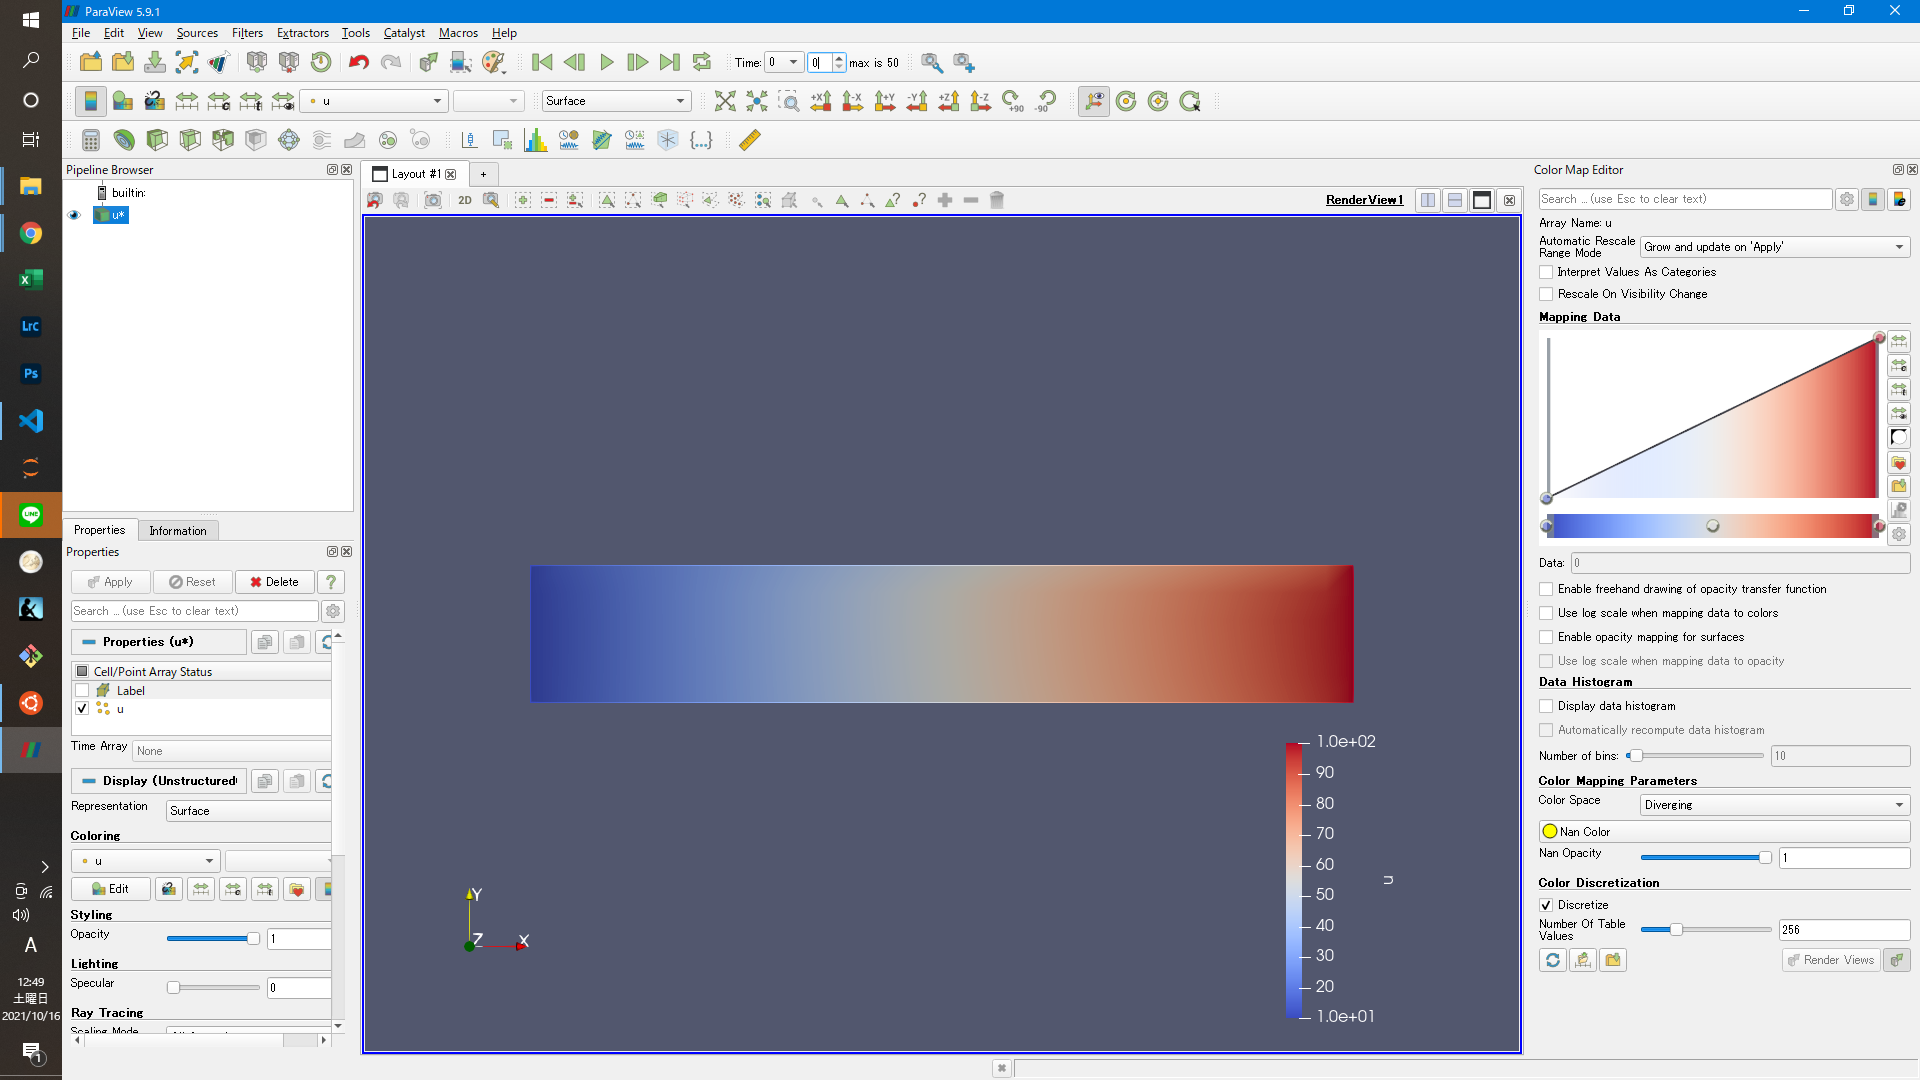
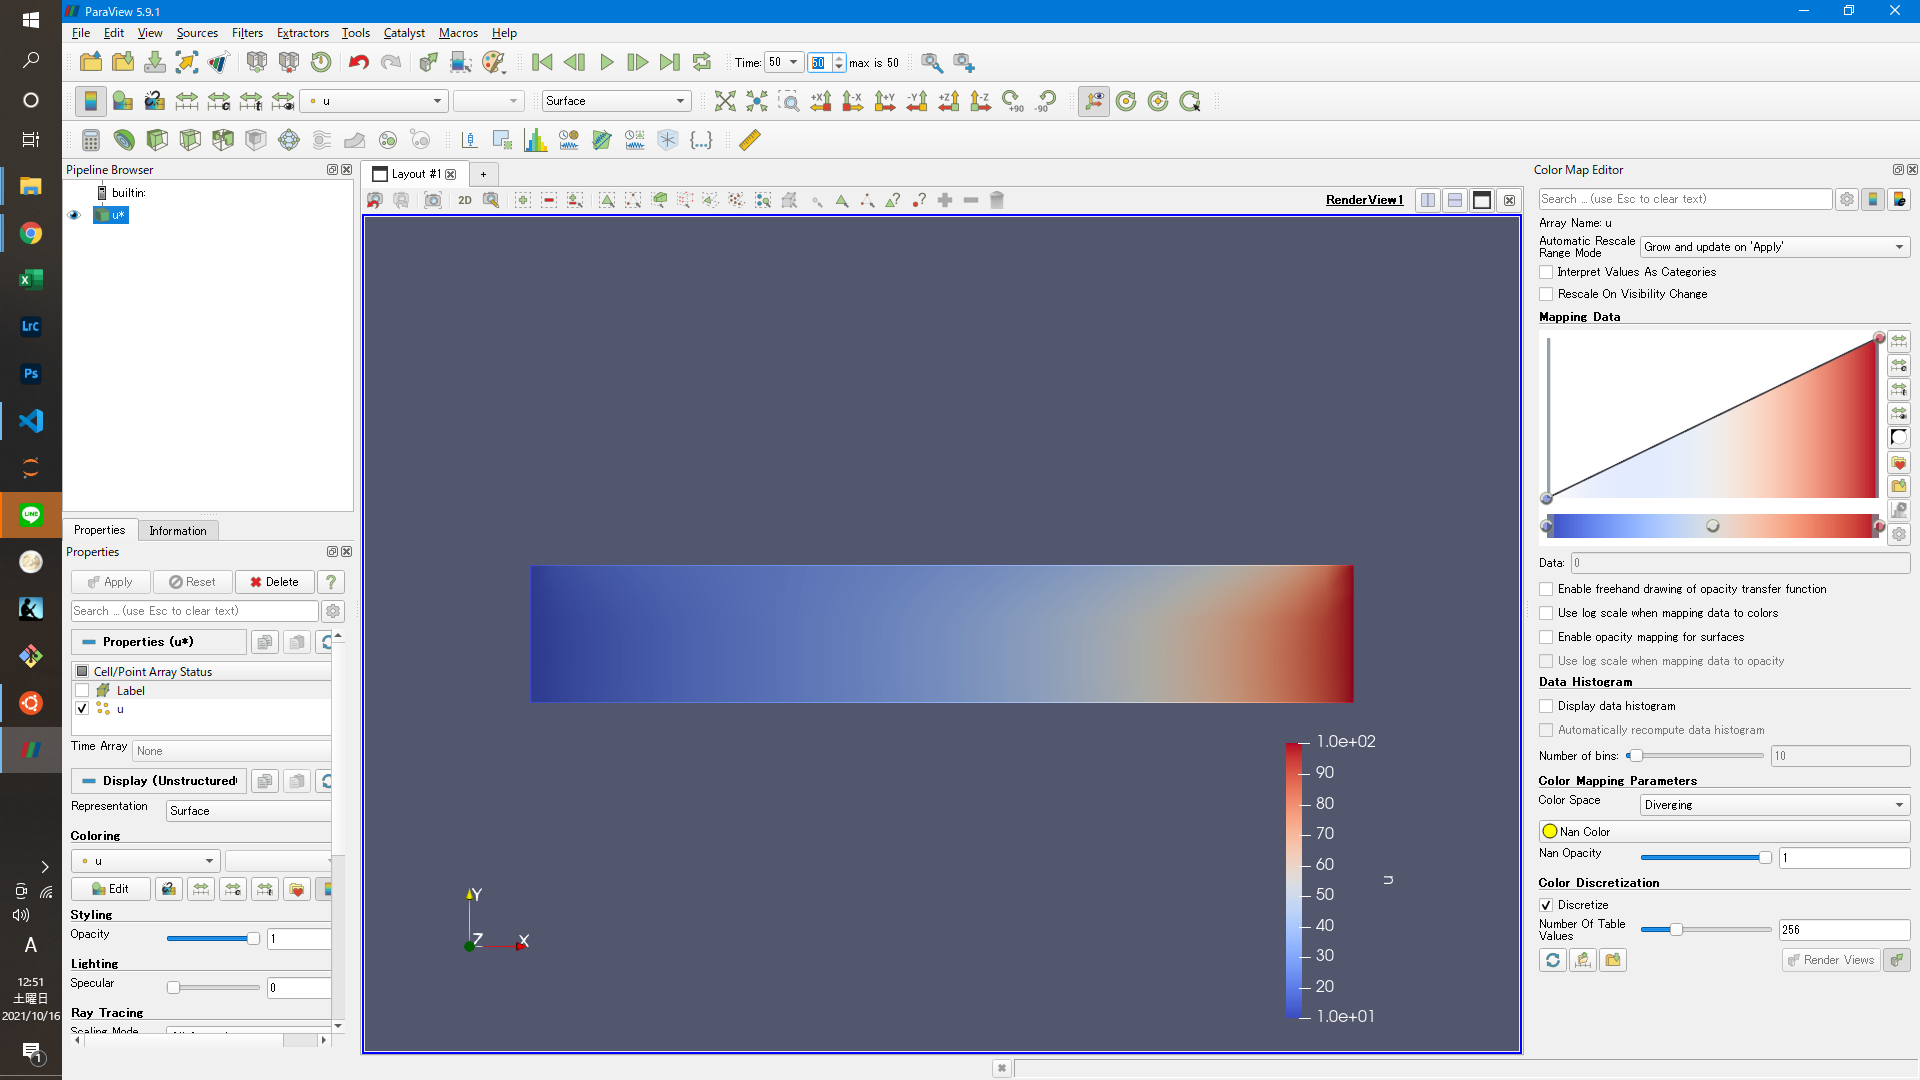
書き出したvtkファイルをParaviewで読み込んで、コンターでuの分布を表示することができた。
以上、Ubuntu版FreeFEMをWSLで回し、Paraviewで結果を可視化できた。

