Pythonによる気象・気候データ解析I: Pythonの基礎・気候値と偏差・回帰相関分析
の章末問題を一つずつ解いていきます。
A
- 最も今日的テーマのドル円為替
import pandas as pd
import numpy as np
import matplotlib.pyplot as plt
!pip install japanize-matplotlib > /dev/null
import japanize_matplotlib

df = pd.read_csv('drive/MyDrive/quote.csv', skiprows=2, encoding='cp932') #不要なヘッダーを無視
df = df.iloc[:, 0:2] #必要な列のみに
df = df.rename(columns={'Unnamed: 0': 'Date'}) # 日付列名の変更
df['Date'] = pd.to_datetime(df['Date']) # 日付型にしておくとPlot時などに便利
plt.figure()
plt.plot(df['Date'], df['USD'])
plt.grid()
plt.title('米ドル円為替')
plt.show()
df['Serial'] = list(map(lambda x: x.timestamp() / 86400, df['Date'])) # トレンド計算用に日付の連続値(シリアル値に日にち換算)の列を作成
[a, b] = np.polyfit(df['Serial'], df['USD'], 1)
print(a, b)
0.0022581206101386156 73.80668677629727
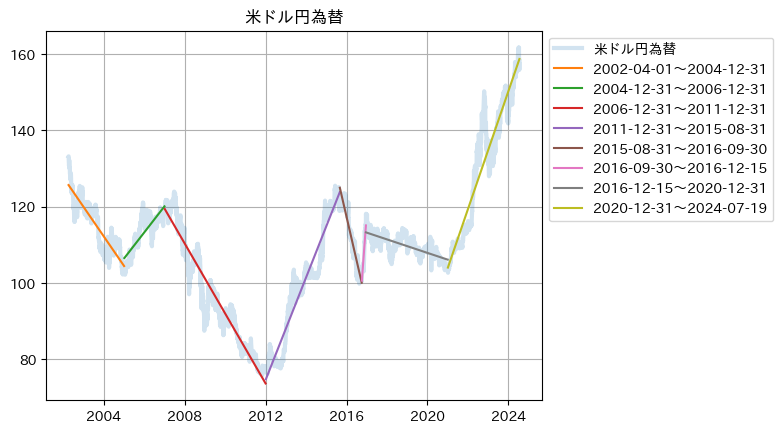
- 上下のトレンド変化がありそうなところを区切って(特に経済・金融的に意味のある機関ではない)描いてみた。
li_change = ['2002-04-01', '2004-12-31', '2006-12-31', '2011-12-31', '2015-08-31', '2016-09-30', '2016-12-15', '2020-12-31', '2024-07-19']

plt.figure()
plt.plot(df['Date'], df['USD'], lw=3, alpha=0.2, label="米ドル円為替")

for i in range(len(li_change) - 1):
  df_tmp = df[(df['Date'] > li_change[i]) & (df['Date'] <= li_change[i+1])]
  [a, b] = np.polyfit(df_tmp['Serial'], df_tmp['USD'], 1)
  print(a, b)
  plt.plot(df_tmp['Date'], df_tmp['Serial'] * a + b, label=str(li_change[i]) + '~' + str(li_change[i+1]))

plt.grid()
plt.title('米ドル円為替')
plt.legend(loc='upper left', bbox_to_anchor=(1, 1))
plt.show()
-0.021164450282521712 374.96499941159783
0.018712067709634385 -132.73159726004195
-0.02511237632551709 458.8255091370521
0.03674203445629151 -488.9693951593955
-0.06303304167403673 1176.3020789152717
0.1982723966767926 -3285.279010727606
-0.004841149210411785 196.29489755269853
0.04232352523966017 -684.4912195805477
B
import numpy as np
import matplotlib.pyplot as plt
import japanize_matplotlib
from matplotlib.colors import Normalize

loadfile = 'drive/MyDrive/t2ma_erai.npz'
t2ma_dataset = np.load(loadfile)
t2ma_dataset.files
t2ma = t2ma_dataset['t2ma']
lon2 = t2ma_dataset['lon2']
lat2 = t2ma_dataset['lat2']
y = t2ma_dataset['y']
m = t2ma_dataset['m']
[imt, jmt, tmt] = t2ma.shape

a_t2ma = np.zeros((imt, jmt))
b_t2ma = np.zeros((imt, jmt))
daetrended_t2ma = np.zeros((imt, jmt, tmt))

mon = np.arange(1979, 2019, 1/12)

is_land_grids_3D = (np.isnan(t2ma)==True)
t2ma[is_land_grids_3D] = 0

for ii in range(0, imt):
  for jj in range(0, jmt):
    [a_t2ma[ii, jj], b_t2ma[ii, jj]] = np.polyfit(mon, t2ma[ii, jj, :], 1)
    daetrended_t2ma[ii, jj, :] = t2ma[ii, jj, :] - (a_t2ma[ii, jj]*mon + b_t2ma[ii, jj])

  if (ii % 30 == 0):
    print(ii)

is_land_grids_2D = np.squeeze(is_land_grids_3D[:, :, 0])
a_t2ma[is_land_grids_2D] = np.nan
b_t2ma[is_land_grids_2D] = np.nan
daetrended_t2ma[is_land_grids_2D] = np.nan
- スケール確認のためのヒストグラム
plt.hist(a_t2ma.flatten(), bins=50)
plt.show()
vmin = -0.15
vmax = 0.15
vint = 0.01

plt.figure()
cm = plt.get_cmap('seismic')
cs = plt.contourf(lon2, lat2, a_t2ma,
                    cmap=cm, norm=Normalize(vmin=vmin, vmax=vmax),
                    levels=np.arange(vmin, vmax + vint, vint), extend='both')
plt.colorbar(cs)
plt.xlabel('Longitude')
plt.ylabel('Latitude')
title = 'T2MA trend'
plt.title(title)
plt.xlim(0, 360)
plt.ylim(-90, 90)
plt.show()
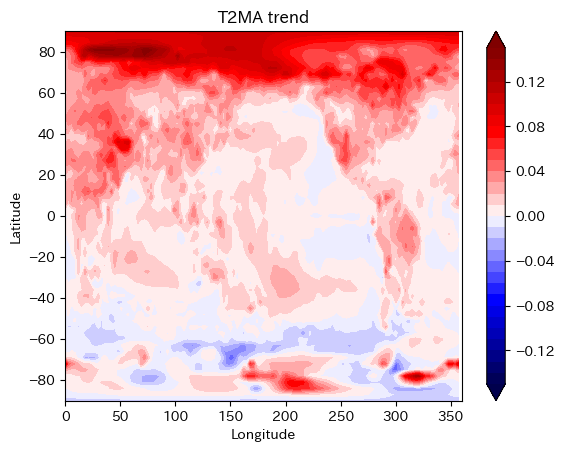
- この図だとどちらが「速い」かわ分からないが
- 北半球の温暖化が強い。
- 陸地と北極海が温暖化が強い。
C
- テキスト通り下記からデータ取得
C1
import pandas as pd
import numpy as np
import matplotlib.pyplot as plt
import japanize_matplotlib

df = pd.read_csv('drive/MyDrive/nikkei_stock_average_monthly_jp.csv', encoding='cp932')
df = df.iloc[0:128, :] # 128行目が不要なコメント行なので削除
df['データ日付'] = pd.to_datetime(df['データ日付'])
df['Serial'] = list(map(lambda x: x.timestamp() / 86400, df['データ日付']))
[a, b] = np.polyfit(df['Serial'], df['終値'], 1)
print(a, b)
4.969787419890192 -65926.67481189099
plt.plot(df['データ日付'], df['終値'], label='月末終値')
plt.plot(df['データ日付'], df['Serial'] * a + b, label='トレンド')
plt.title('日経平均株価')
plt.legend()
plt.grid()
plt.show()
C2
detrended_stock_price = df['終値'] - (df['Serial'] * a + b)

plt.plot(df['データ日付'], detrended_stock_price)
plt.title('日経平均株価トレンド除去')
plt.grid()
plt.show()
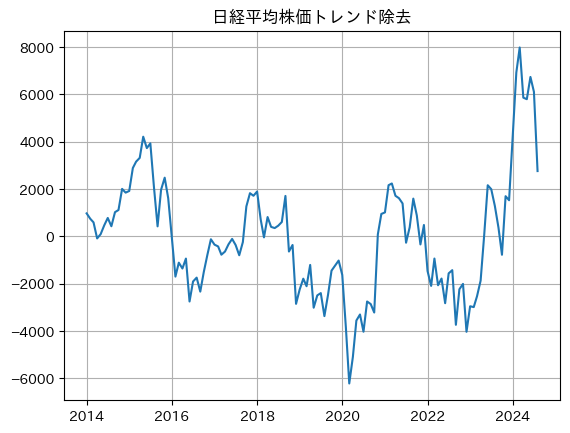
- 高騰と暴落、特に「暴落」は言葉が強すぎるかと思うのでここでは「上昇」「下落」としました。
- 2014 上昇 金融緩和
- 2015 下落 チャイナショック
- 2016-2017 上昇 世界経済回復
- 2018 下落 米中貿易戦争
- 2020 下落からの上昇 コロナショックと大規模金融緩和
- 2022 下落 ウクライナ侵攻やインフレ懸念
- 2023 上昇 インフレ鎮静化、中国経済安定化
D
- テキスト通り下記データを用いた
import pandas as pd

df_nh = pd.read_excel('drive/MyDrive/Sea_Ice_Index_Monthly_Data_by_Year_G02135_v3.0.xlsx', sheet_name='NH-Area')
df_sh = pd.read_excel('drive/MyDrive/Sea_Ice_Index_Monthly_Data_by_Year_G02135_v3.0.xlsx', sheet_name='SH-Area')

df_nh = df_nh.rename(columns={'Unnamed: 0': 'Year'})
df_sh = df_sh.rename(columns={'Unnamed: 0': 'Year'})

li_nh = []
li_sh = []
for i in range(len(df_nh)):
  li_nh = li_nh + list(df_nh.loc[i, 'January': 'December'])
  li_sh = li_sh + list(df_sh.loc[i, 'January': 'December'])

df = pd.DataFrame(columns=['Date', 'NH', 'SH'], data=zip(pd.date_range(start='1978-01-01', end='2024-12-01', freq='MS'), li_nh, li_sh))
df['Serial'] = list(map(lambda x: x.timestamp() / 86400, df['Date']))

df2 = df.dropna()
[a_nh, b_nh] = np.polyfit(df2['Serial'], df2['NH'], 1)
[a_sh, b_sh] = np.polyfit(df2['Serial'], df2['SH'], 1)
print(a_nh, b_nh)
print(a_sh, b_sh)

plt.plot(df['Date'], df['NH'], label='North Pole', color='skyblue', alpha=0.7)
plt.plot(df['Date'], df['SH'], label='South Pole', color='pink', alpha=0.7)
plt.plot(df['Date'], a_nh*df['Serial'] + b_nh, label='North Pole trend', color='blue', linewidth=3)
plt.plot(df['Date'], a_sh*df['Serial'] + b_sh, label='South Pole trend', color='red', linewidth=3)
plt.legend()
plt.show()
-6.422824680314493e-05 10.01962814362234
-3.376169333939824e-06 8.74119549448934
- 北極海の方が海氷の減りが大きい。


