

Building a Startup Analytics Stack: From GA4 to Activation Metrics
A startup analytics stack is the small set of tools and habits a young company uses to see what its users actually do, from the first visit to the moment they become active customers. It is not a dashboard full of charts. It is a working system that answers three questions every week: where do users come from, what do they do first, and how many of them come back.
Most early teams collect data by accident. They install an analytics tool, glance at a traffic number, and move on. That is not a stack. A stack connects the numbers to decisions, so the team knows which channel to keep, which onboarding step to fix, and which feature deserves the next sprint.
What is a startup analytics stack?
A startup analytics stack is the combination of tools, events, and review habits that turns raw user behaviour into decisions a small team can act on. It covers the full journey from acquisition to activation to retention, and it keeps every number tied to a named owner who checks it on a schedule.
The stack has three layers: collection, the tools that record visits, signups, and product events; definition, the agreed meaning of an activated user and the events that mark each step toward it; and review, a short weekly session where the team looks at the same numbers, asks what changed, and picks one action. Without the third layer, the first two are decoration.
A startup analytics stack is also one part of a wider set of growth navigate startup tools that cover how a young company finds customers, runs its team, measures traction, and controls cash. The analytics piece is the one that tells the team whether the rest of the stack is working.
Why do startups need an analytics stack before they scale?
Startups need an analytics stack early because the decisions made before scale are the ones that decide what scale looks like. A team that waits until it has thousands of users to start measuring has already spent its earliest budget blind, and the patterns it could have learned from its first hundred users are gone.
The early stack does not need to be large. A young company typically needs one analytics tool, one definition of activation, and one weekly review. That is enough to catch the problems that matter most at this stage: a signup flow that loses people at one step, a channel that brings visitors who never activate, or a feature that new users never reach. These are the problems that are cheap to fix with fifty users and expensive to fix with five thousand.
A stack built from the start grows with the team instead of being fitted onto habits that already exist. The events defined in week one become the funnel the team reads in month six.
Which tools belong in a startup analytics stack?
The tools in a startup analytics stack fall into four groups: web analytics, product analytics, data storage, and reporting. A young company does not need one tool from every group on day one. It needs enough coverage to see the full journey, and it should add tools only when a question appears that the current set cannot answer.
Web analytics is the starting point. GA4 is the common choice for early teams because it records traffic sources, pages, and basic conversion events, and it is the analytics tool named in the typical early stack alongside a startup CRM such as HubSpot, Slack for team chat, Notion as a shared workspace, and Zapier for automation.
Product analytics comes next. This is the tool that records what users do inside the product: which features they open, where they stop, and how often they return. For many teams the same GA4 setup can carry this load at first, with events sent from the product as well as the site. When the team needs to follow individual user journeys or compare cohorts, a dedicated product analytics tool becomes worth adding.
Data storage and reporting can wait. At the start, storage can be the analytics tool itself, and reporting can be a shared document that holds the weekly numbers. As the team grows, a warehouse and a reporting tool earn their place by letting the team join product data with CRM data and answer questions such as which acquisition channel produces the users who stay longest.
How should a startup set up GA4 for activation tracking?
A startup should set up GA4 for activation tracking by defining one activation event, instrumenting the funnel that leads to it, and checking that the numbers match reality before trusting them. GA4 on its own records page views and sessions. Activation tracking needs deliberate events, because activation is a product behaviour, not a page view.
The first step is to define activation in one sentence. For a software product, activation might be the moment a new user completes the core action the product exists for, such as creating a first project, sending a first message, or finishing setup. The definition should be specific enough that a developer can name the exact event to fire, and simple enough that the whole team can repeat it. If two people on the team define activation differently, the stack is already broken.
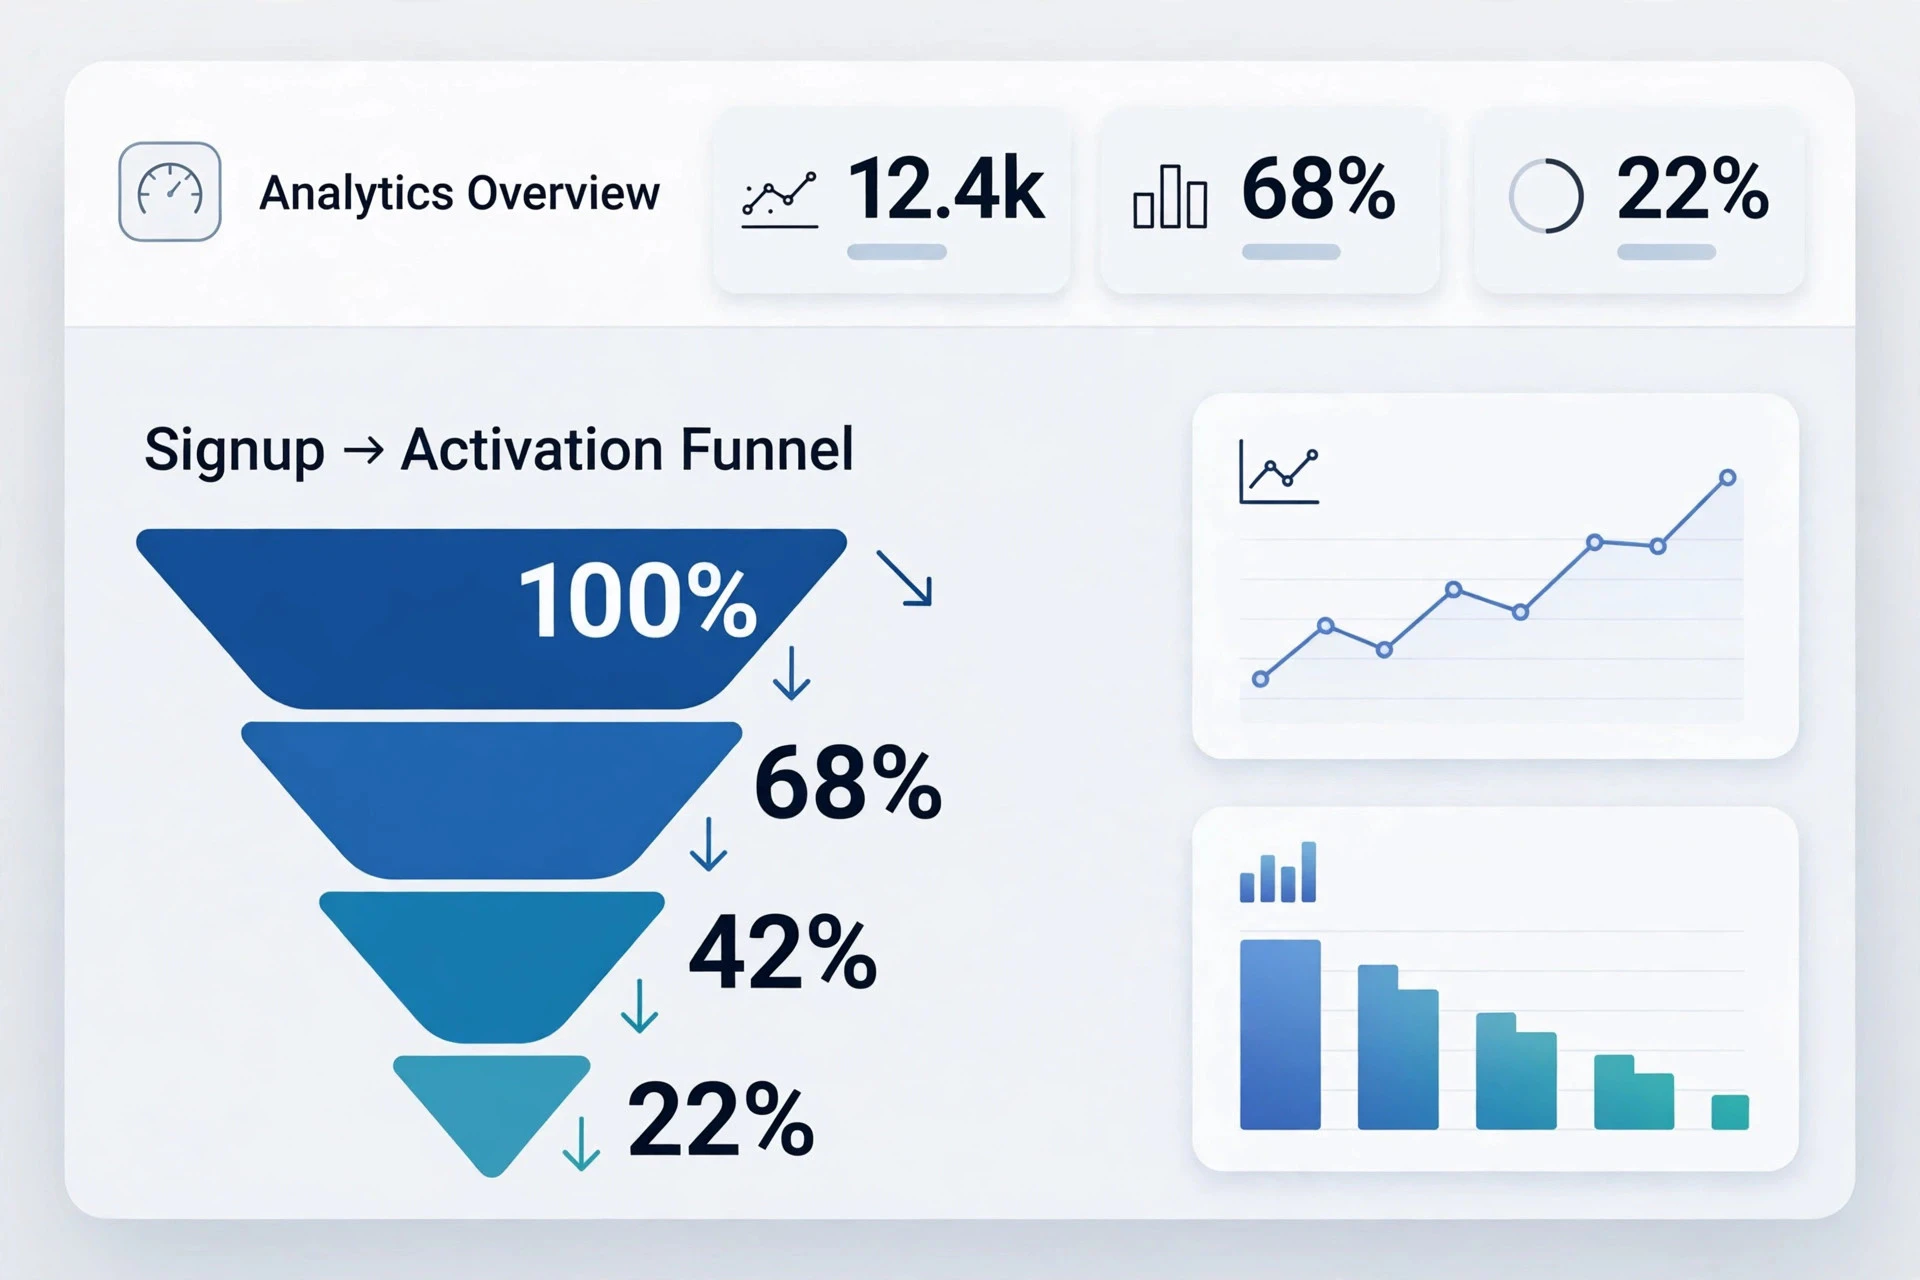
The second step is to instrument the funnel. The team lists the steps between signup and activation, usually three to five, and fires an event for each one. Each event should carry the information needed to split the funnel later, such as the signup source and the user type. Without funnel events, the team can see that activation is low but cannot see where users are lost.
The third step is verification. Before the team acts on any number, someone should complete the journey as a real user and confirm that every event fires in the right order with the right values. Test traffic, internal team usage, and bot visits all distort early numbers.
What are activation and retention metrics, and how do you track them weekly?
Activation metrics measure how many new users reach the core value of the product, and retention metrics measure how many of them come back. Activation is a rate: activated users divided by new signups over the same period. Retention is a curve: the share of a signup cohort still active after a day, a week, and a month. Together they show whether the product is winning users and keeping them.
Weekly tracking works because it is frequent enough to catch problems early and slow enough to show real change. A daily check reacts to noise, and a monthly check finds problems too late. The weekly review should look at the same small set of numbers every time: new signups, activation rate, the funnel step with the largest drop, and retention for the most recent cohorts. Four numbers are enough. A review that tracks twenty metrics tracks none of them properly.
The review itself should be short and structured. The team opens the funnel, names the biggest drop, and asks why it happened. Then it picks one change to test before the next review. The numbers exist to produce one decision a week, not to fill a report.

How do analytics, collaboration, and productivity tools work together?
Analytics, collaboration, and productivity tools work together when the numbers, the conversation about them, and the work that follows all live in one loop. The analytics tool produces a number, the team discusses it in its communication tool, and the resulting task lands in the shared workspace where it gets done. If any link in that loop is missing, the stack leaks.
The collaboration layer matters because analytics is a team activity, not a solo one. A funnel drop means different things to a developer, a marketer, and a founder, and the right reading usually comes from the conversation between them. That is why team collaboration tools sit next to analytics in a working stack: the chat channel where the weekly numbers are posted is where the interpretation happens, and the shared workspace is where the follow-up task is recorded with an owner and a date.
The productivity layer matters because a stack that creates work without tracking it creates noise. When the weekly review produces a task, such as fixing a broken onboarding step, that task needs an owner and a deadline, or it will be forgotten by the next review. Good productivity tools make this loop visible: the task, its owner, and its result are all in the same place the team already works.

What mistakes do startups make with their analytics stack?
Startups make four common mistakes with their analytics stack: tracking everything, defining nothing, reviewing never, and trusting numbers they have not verified. Each mistake is easy to make and each one quietly removes the value of the tools.
Tracking everything is the first mistake. A team that fires an event for every click ends up with data nobody can read. The fix is to track only the events that answer a decision: the funnel steps toward activation, the core actions inside the product, and the return visits that show retention.
Defining nothing is the second mistake. Teams that never agree on what activation means will argue about the numbers instead of acting on them. The fix is one written definition, owned by one person, reviewed when it changes.
Reviewing never is the third mistake. A stack without a weekly review is a recording device, not a decision tool. The fix is a short recurring meeting with a fixed agenda and a rule that it ends with one action.
Trusting unverified numbers is the fourth mistake. Early data is full of test accounts, team usage, and bots. The fix is a manual walkthrough of the journey after every instrumentation change, and a habit of asking whether a surprising number is real before acting on it.
How do you build the stack step by step?
A startup builds its analytics stack step by step by starting with one tool, one definition, and one review, then adding only what a real question demands. The order matters more than the tools, because a stack built in the wrong order measures the wrong things.
First, write down the journey. The team lists the steps a new user takes from first visit to activation, and agrees on the activation event. This is a conversation, not a configuration task, and it should involve the people who build the product and the people who talk to users.
Second, instrument GA4 for that journey. The team fires an event for each funnel step and for the activation event itself, then verifies the events with a real walkthrough. At this point the stack is already useful: the team can see the funnel and name its biggest drop.
Third, start the weekly review. The team meets for a short session, looks at signups, activation rate, the largest funnel drop, and retention, and picks one action. This step is the one most teams skip, and it is the one that makes the rest of the work pay.
Fourth, connect the loop. The numbers go into the team chat, the action goes into the shared workspace, and the result is checked at the next review. The stack is now a system, not a set of tools.
Fifth, add tools only when a question appears. If the team cannot follow individual user journeys, it adds product analytics. If it cannot join product data with CRM data, it adds storage and reporting. Each addition has a reason written next to it, so the stack stays small enough to understand.
Conclusion
A startup analytics stack is a small system, not a large purchase. One analytics tool, one definition of activation, a funnel with three to five steps, and a weekly review that ends with one action will carry a team further than a shelf of tools nobody opens. GA4 covers the top of the funnel, product events cover the journey inside the product, and the weekly review turns both into decisions. Build it in that order, keep it small, verify every number before acting on it, and the stack will show a young company what its users actually do.
FAQs
What is the simplest startup analytics stack?
The simplest startup analytics stack is one analytics tool such as GA4, one written definition of activation, a funnel of three to five events, and a short weekly review. That set answers the questions that matter most early on: where users come from, where they drop off, and how many come back.
How is activation different from a signup?
A signup is the moment a user creates an account. Activation is the moment that user reaches the core value of the product, such as completing setup or finishing a first key action. Many users sign up and never activate, which is why activation rate is a more useful number than signup count.
How often should a startup review its analytics?
A startup should review its analytics weekly. A weekly cadence catches problems early without reacting to daily noise, and it gives each change a full week to show an effect before the team judges it.
When should a startup add a product analytics tool?
A startup should add a product analytics tool when it has a question the current setup cannot answer, such as following individual user journeys or comparing cohorts. The addition should be tied to a specific question.