この記事では、PRMLの第11章で述べられている、マルコフ連鎖モンテカルロ(以下、MCMC)、具体的にはMetropolis algorithmをpythonで実装します。
対応するjupyter notebookは筆者のgithubリポジトリにあります。連載全体の方針や、PRMLの他のアルゴリズムの実装については、連載のまとめページをご覧いただければと思います。
前回の10章の記事とはうってかわって、今回は理論も実装もあっさりした記事になっています1。
1 理論のおさらい
1.1 設定
集合2$X$上の確率分布(確率密度関数)$p$が与えられているとします。
後の便宜のために、確率分布(確率密度関数)$p$は、$p(x) = \tilde{p}(x)/Z_p$と書けるとします。ここで、$\tilde{p}(x)$は既知であるものの、規格化定数$Z_p$は未知でも良いとします3。
MCMC(に限らずPRML11章で述べられているサンプリングアルゴリズム)の目標は、$p$に従った$X$の点のサンプルを生成することです。
MCMCでは、マルコフ連鎖を用いてこのようなサンプルたちを生成します。
1.2 Metropolis-Hastings algorithm
この記事ではまず、MCMCの手法の1つ、Metropolis-Hastings algorithmについて述べたいと思います。
まず、提案分布$q$を決めておきます。$q(x|x')$は、現状の状態が$x'$であるとき、$x$を次の状態の候補として得る確率を表します。$q(\cdot|x')$は容易にサンプルできるとします。また、$x, x'$について対称でないときは、その確率(確率密度)$q(x|x')$の値を容易に評価することができると仮定します。
この前提の下で、Metropolis-Hastings algorithmは以下のような操作を行います:
- 現在の状態$x^{current}$(最初のタイムステップであれば、外から与えた初期状態$x^{ini}$)に対して、次の状態の候補$x^{tmp}$を$q(\cdot | x^{current})$に従って生成する4。
- 次の状態$x^{next}$を次のように定める
$$
\begin{align}
x^{next} =
\begin{cases}
x^{tmp} & (\mbox{with probability } A(x^{tmp}, x^{current})) \\
x^{current} & (\mbox{with probability } 1 - A(x^{tmp}, x^{current}))
\end{cases},
\end{align}
$$
ただし、
$$
\begin{align}
A(x,y) := \min\left( 1, \ \frac{\tilde{p}(x)}{\tilde{p}(y)}\cdot \frac{q(y|x)}{q(x|y)} \right)
\end{align}
$$
であり、現在の状態が$y$のときに、次の状態の候補$x$を受理する確率を表す5。
このようにマルコフ連鎖を定義すると、$p$が不変分布になります。このことは、詳細釣り合いが成り立つことから言えます6。
(近似的に)独立なサンプルがほしい場合には、こうやって得られるサンプルの系列$x^{(0)}, x^{(1)}, \dots$から、ある程度の間隔をあけたサンプルを記録することになります7。
理論編は以上です!
2 数式からコードへ
さて、数式をコードに起こしていきましょう。とはいっても、こちらも今回はあっさりです。
この節では、MetropolisSamplerクラスを実装していきます。
以下では$X$は$D$次元ユークリッド空間と仮定し、提案分布としては共分散$\Sigma$の$D$次元Gauss分布
$$
\begin{align}
q(x|y) = \frac{1}{(2\pi)^{D/2} \sqrt{\det \Sigma}} \exp\left[ -\frac{1}{2}(x-y)^T \Sigma^{-1} (x-y) \right]
\end{align}
$$
を用いることにします。
なお、$q(x|y)$は$x, y$の入れ替えについて対称なので、この場合、受理確率$A$は次のようにより簡潔に書くことができます:
$$
\begin{align}
A(x,y) := \min\left( 1, \ \frac{\tilde{p}(x)}{\tilde{p}(y)} \right)
\end{align}
$$
2.1 データ属性とメソッド
MetropolisSamplerクラスには、以下のデータ属性とメソッドを持たせることにします。
2.1.1 データ属性
-
D: $D$. i.e., 考える空間$X$の次元。 -
sigma: $\Sigma$, i.e., 提案分布の共分散行列。 -
p: $\tilde{p}$, サンプルを取りたい確率を表す、(規格化されているとは限らない)確率密度関数。
2.1.2 メソッド
-
_A: $A$、受理確率を計算する関数。 -
sample: Metropolis algorithmに従ってサンプリングを行い、サンプルを返す関数。「何個ごとにサンプルを記録するか」を指定することができるようにしておきます。
2.2 コード
class MetropolisSampler:
    def __init__(self, D, sigma, p):
        self.D = D # the dimension of the output space
        self.sigma = sigma # the covariance matrix of the proporsal kernel
        self.p = p # the density function of the target distribution

    def _A(self, x, y):
        '''
        The method which returns the acceptance probability,
        depending on the current state y and the candidate state x

        Parameters
        ----------
        x : 1D numpy array
            1D numpy array representing the candidate state
        y : 1D numpy array
            1D numpy array representing the current state
        Returns
        ----------
        A : float
            The acceptance probability A(x, y),
            where y is the current state, and x is the candidate state.
        '''
        denom = self.p(y)  # for avoiding zero division error
        if denom == 0:
            return 1.0
        else:
            return min( 1.0, self.p(x) / denom )

    def sample(self, xini, N, stride):
        '''
        The method that performs sampling using Metropolis algorithm, and returns the samples

        Parameters
        ----------
        xini : 1D numpy array
            1D numpy array representing the initial point
        N : int
            An integer representing the number of samples required.
        stride : int
            An integer representing how frequent samples are recorded.
            More specifically, we only record sample once in `stride` steps

        Returns
        ----------
        X : 2D array
            (N, self.D) array representing the obtained samples, where X[n] is the n-th sample.
        '''
        X = np.zeros((N, self.D))  # array for recording the sample
        x = xini
        cnt = 0
        for i in range((N-1) * stride + 1):
            xtmp = np.random.multivariate_normal(x, self.sigma)  # sample from the proporsal kernel (gaussian )
            tmprand = random.random()
            if tmprand < self._A(xtmp, x):
                x = xtmp
            if i % stride == 0:
                X[cnt] = x
                cnt += 1
        return X
3 実験
では、このMetropolisSamplerを使って実際にサンプルを生成してみましょう。得られるヒストグラムや平均/分散の値を、確率密度のグラフや(解析的に求めた)平均/分散と比較してみましょう。
ここでは、具体的には以下の2種類の分布を考えます。
- ガンマ分布(1次元)
- 2次元正規分布
3.1 ガンマ分布
$$
\begin{align}
& p(x) = \frac{1}{\Gamma(k) \theta^k} x^{k-1} e^{-\frac{x}{\theta}} \
& \mbox{mean} : k \theta \
& \mbox{variance} : k \theta^2
\end{align}
$$
実験では、$k=3, \theta=1$を考えることにします。
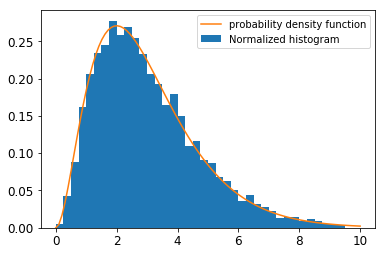
sigma=np.array([[1.0]]), xini=np.array([1.0]), N=5000, stride=10としたとき、以下のような結果が得られました:
sample mean : 3.0866187342766973
sample variance : 3.284016881941356
3.2 2次元Gauss分布
$$
\begin{align}
& p(x) = \frac{1}{2 \pi \sqrt{\det \Sigma}} \exp\left( -\frac{1}{2} x^T \Sigma^{-1} x \right) \
& \Sigma^{-1} = \begin{pmatrix}
10 & -6 \
-6 & 10
\end{pmatrix} \
& \Sigma =
\frac{1}{32}
\begin{pmatrix}
5 & 3 \
3 & 5
\end{pmatrix}
= \begin{pmatrix}
0.15625 & 0.09375 \
0.09375 & 0.15625
\end{pmatrix}
\end{align}
$$
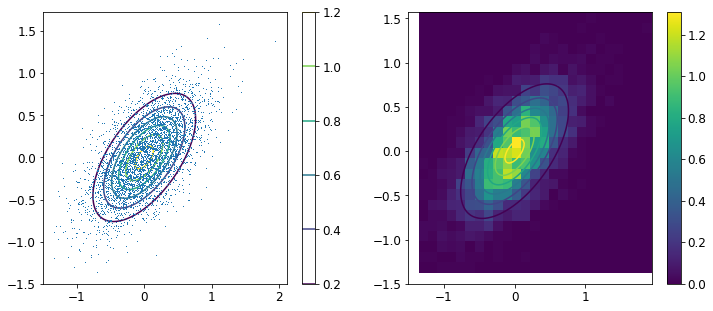
sample mean : [0.0088419  0.00923985]
sample covariance : [[0.16297775 0.09611609]
 [0.09611609 0.15594885]]
4 まとめ
この記事では、Metropolis-Hastings algorithmを整理し、Metropolis algorithmに基づいたsamplingを実装しました。
実験の結果、サンプルのヒストグラムと確率密度は目で見た範囲では多きな矛盾もなく、平均/分散も理論で得られるものと大きなずれはないことを確かめられました。
ただ、サンプリング法については、アルゴリズムを実装すること自体は話のほんの一部で、それよりも実践的な部分が難しいのではないかと感じています。
ぱっと思いつくだけでも
- 平均や分散の正しい値が分からないとき、誤差をどのように評価すべきか?
- サンプル数を大きくしたとき、誤差はどのように振舞うのか?
- サンプルの間に空けるステップを大きくしたとき、サンプル間の相関はどのように振舞うのか?
- より複雑なモデルで走らせたとき、どのような振る舞いが見られるのか?
などなど。このような点については、筆者は理解しておらず、この記事では触れることができませんでした。これらについては、今後の勉強の課題としたいと思います。
-
ただ、私の現状の理解では掘り下げが足りないところが原因だったりもします。詳しくはまとめの節を参照。 ↩
-
正確には適切な$\sigma$代数が定義された可測空間(恐らく)。 ↩
-
典型的な例としては、パラメーターの事後分布を考えるときかと思います: パラメーターを$\theta$、データを$\mathcal{D}$と書き、尤度関数$p(\mathcal{D}|\theta)$と事前分布$p(\theta)$が与えられているとします。このモデルの下では、データを観測したときのパラメーターの事後分布は$p(\theta|\mathcal{D}) = p(\mathcal{D}|\theta)p(\theta)/p(\mathcal{D})$となります。分子$p(\mathcal{D}|\theta)p(\theta)$はモデルから容易に分かりますが、分母$p(\mathcal{D})$は多くの場合計算が困難です。 ↩
-
ここで、「$q(\cdot|x)$から容易にサンプルできる」という仮定が効きます。 ↩
-
$A$を計算する部分で、「$q(x|x')$が容易に計算できる」という仮定が効きます。ただし、$q$が2つの引数について対称なら分母分子で相殺するので、この仮定は不要です。 ↩
-
PRMLの(11.45)の計算だけでは不十分かと思いますが。。。というのも、「候補のサンプルが受理されなかったときに、前の状態がそのまま次の状態となる」という過程が抜けているからです。この過程も含めると、遷移確率は($z$が連続と仮定すると)$T(z, z') = q(z'|z) A(z', z) + \delta(z- z')\int dz'' q(z''|z) \left[ 1 - A(z'', z)\right]$と表せます。この遷移確率と$p$について、詳細釣り合いが成り立つことが容易に示せます。 ↩
-
どれだけ間を空ければよいのか、などが気になるところですが、今後の課題としたいと思います。直感的には、より高次のモーメントを計算したいときほど、間を大きく空ける必要があるとは思うのですが、定量的にどうなるかは調べていません。 ↩

