この記事では、ファイナンス機械学習で解説されたCPCVをPythonで実行するためのコードを作成していきます。
今回使用するのはskfolioのCombinatorialPurgedCVです。公式ページを載せておきます。
CPCVの動作確認
さっそくCPCV(CombinatorialPurgedCV)を動かしてみましょう。ここでは特徴量の仮データとして下記のように乱数を使って特徴量行列Xを作成しています。実際には各自で用意した特徴量に置き換えて使用します。
import numpy as np
import pandas as pd
from skfolio.model_selection import CombinatorialPurgedCV

# 100行×5列の特徴量行列X仮データ
np.random.seed(42)
X = pd.DataFrame(
    np.random.randn(100, 5),
    index=pd.date_range(start='2020-01-01', periods=100, freq='D')
)

# CPCV
cpcv = CombinatorialPurgedCV(n_folds=10, n_test_folds=2, purged_size=0, embargo_size=0)
引数のn_folds, n_test_foldsは、ファイナンス機械学習:第12章の説明でいうCPCVのパラメータ(N, k)に該当します。Nは分割数、kはテストデータの数です。
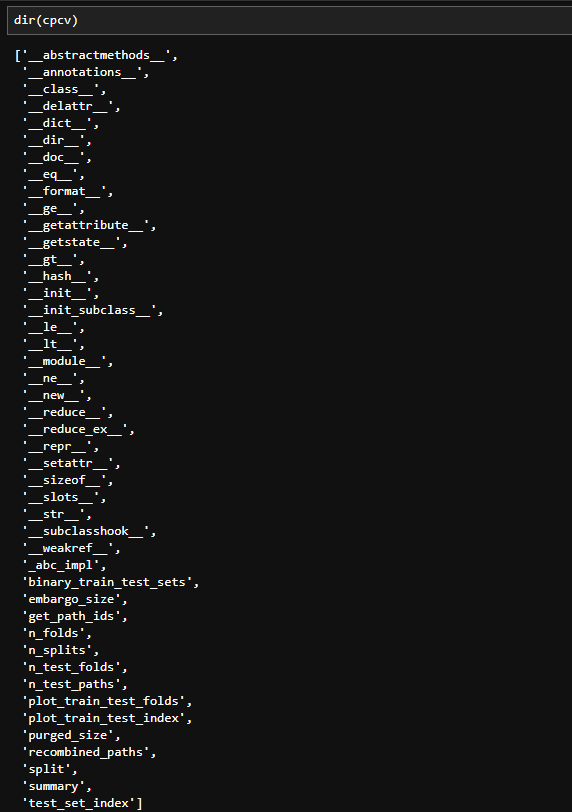
これを単に実行しても何も結果はないので、戻り値を入れたcpcvがどんなデータかを見てみましょう。dir(cpcv)で属性・メソッドの一覧を確認することができます。
dir(cpcv)
では試しに、plot_train_test_folds()を実行してみましょう。
cpcv.plot_train_test_folds()
これを実行すると以下のようなテストデータと学習データの配置が図として出力されます。(以下の画像は静止画ですが実際にはスクロールできます。)
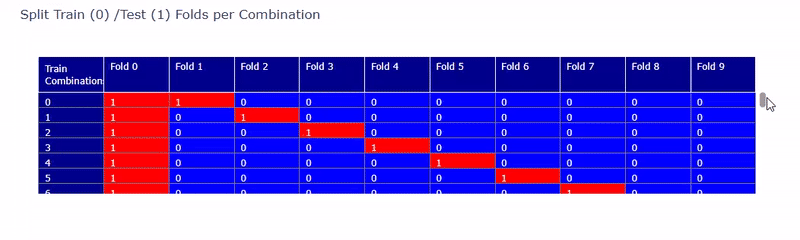
Fold0 ~ Fold9までの10分割で赤がテストデータ、青が学習データに割り当てられていることが確認できます。
次にテストデータの経路の情報を見てみます。
cpcv.get_path_ids()
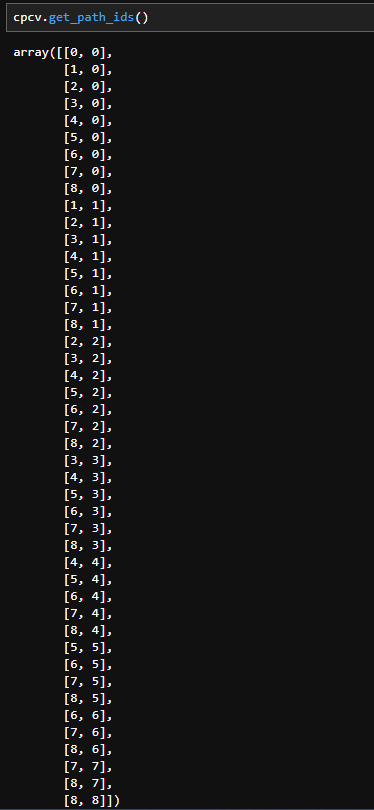
今回の例ではN=10, k=2のCPCVを試しているので、毎回2つのテストデータが作成されます。get_path_ids()では上記のように、各分割時に2つのテストデータが、どの経路に該当するのかを示した配列が返されます。
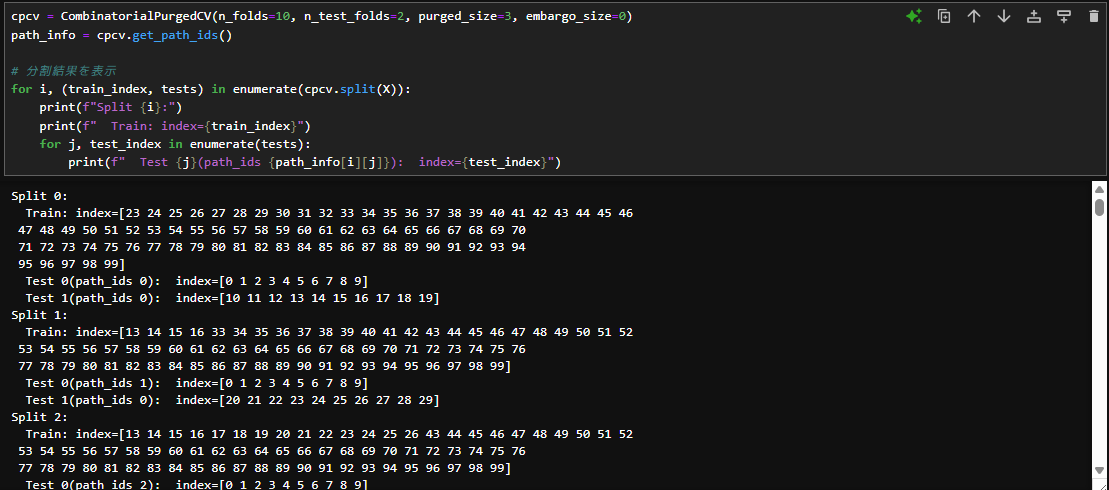
特徴量をCPCVで分割する
いよいよ分割結果を表示してみます。
path_info = cpcv.get_path_ids()

# 分割結果を表示
for i, (train_index, tests) in enumerate(cpcv.split(X)):
    print(f"Split {i}:")
    print(f"  Train: index={train_index}")
    for j, test_index in enumerate(tests):
        print(f"  Test {j}(path_ids {path_info[i][j]}):  index={test_index}")
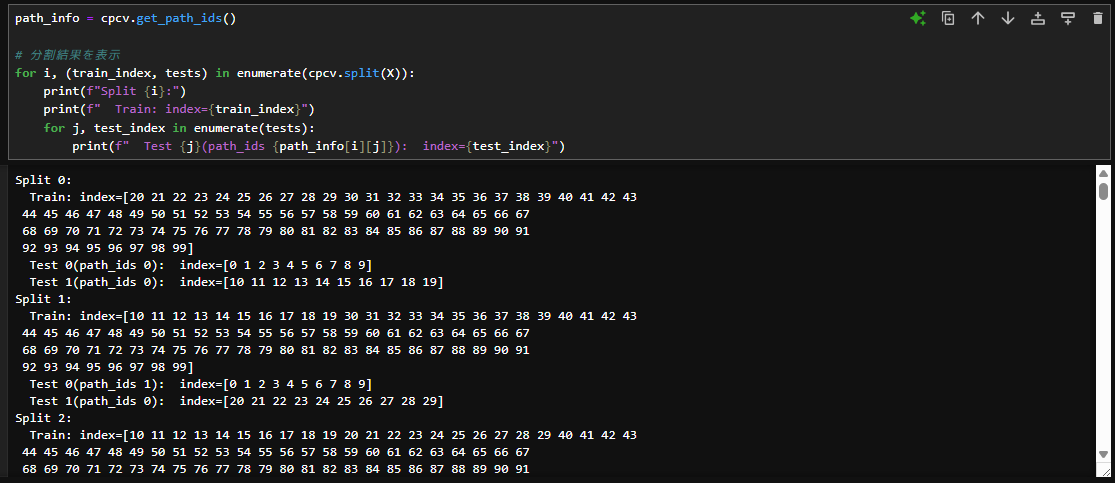
上記のコードを実行することで、各分割ごとの
- 分割回数(Split {i})
- 学習データのインデックス(Train: index={train_index})
- テストデータ(Test {j})
- 各テストデータに該当する経路番号(path_ids {path_info[i][j]})
- テストデータのインデックス(index={test_index})
を表示することができます。
実際に使用する際にはこのfor文の中に、各々のやりたいこと(モデルの学習や予測、ハイパーパラメータ最適化など)を書き込んでいくことになります。
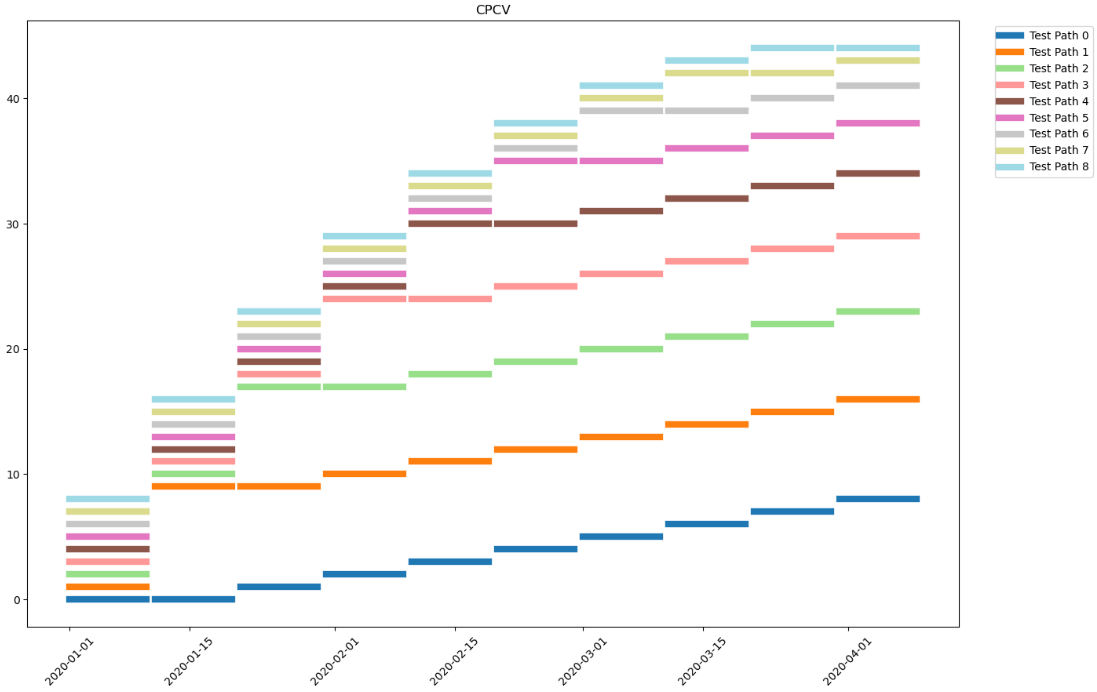
可視化
正しく分割できているかを確認するため、結果を可視化してみましょう。
path_info = cpcv.get_path_ids()

n_paths = cpcv.n_test_paths
cmap = cm.get_cmap("tab20", n_paths)

used_labels = set()

plt.figure(figsize=(14, 9))

for i, (train_idx, test_sets) in enumerate(cpcv.split(X)):
    for j, test_idx in enumerate(test_sets):
        path_id = path_info[i][j]
        test_dates = X.index[test_idx]

        if path_id not in used_labels:
            plt.plot(test_dates, [i] * len(test_dates), lw=6, color=cmap(path_id), label=f"Test Path {path_id}")
            used_labels.add(path_id)
        else:
            plt.plot(test_dates, [i] * len(test_dates), lw=6, color=cmap(path_id))

plt.title("CPCV")

handles, labels = plt.gca().get_legend_handles_labels()
by_label = dict(zip(labels, handles))
plt.legend(by_label.values(), by_label.keys(), loc="upper right", bbox_to_anchor=(1.15, 1))

plt.xticks(rotation=45)
plt.tight_layout()
plt.show()
パージとエンバーゴ
CombinatorialPurgedCVにはパージとエンバーゴを設定できる引数が用意されているので、必要に応じで数値を入れます。(初期値はどちらも0)
このスクショではパージを3にして同じコードを実行しています。2つテストデータが連続しているところは隙間が空かずに、テストデータと学習データが隣接している箇所だけ、3つだけ隙間が空いています。パージとして設定した数値分だけ学習データが少なくなっていることが確認できます。
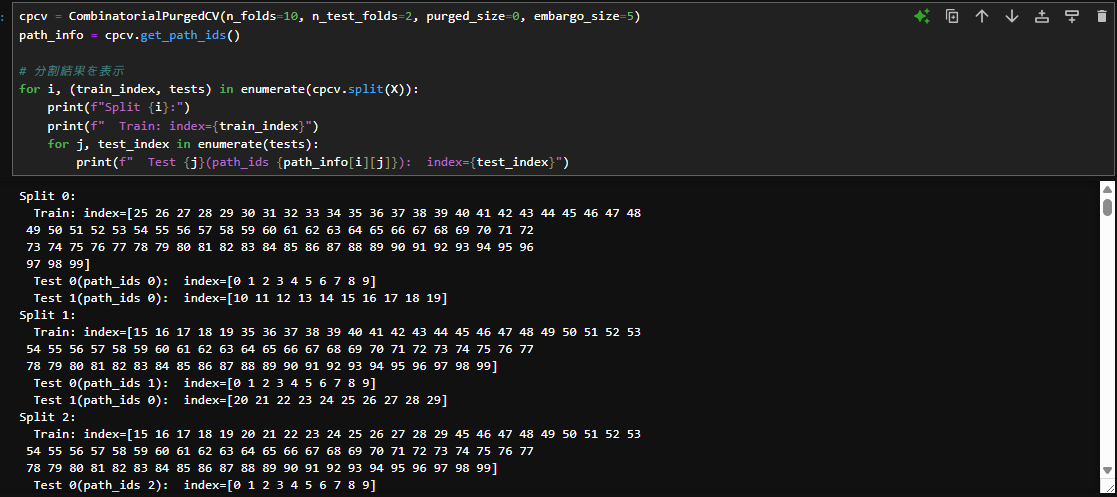
次はエンバーゴを5に設定してみました。テストデータの後にくる学習データは5つ分の隙間が空いていますが、テストデータの前の学習データには隙間が空いていません。
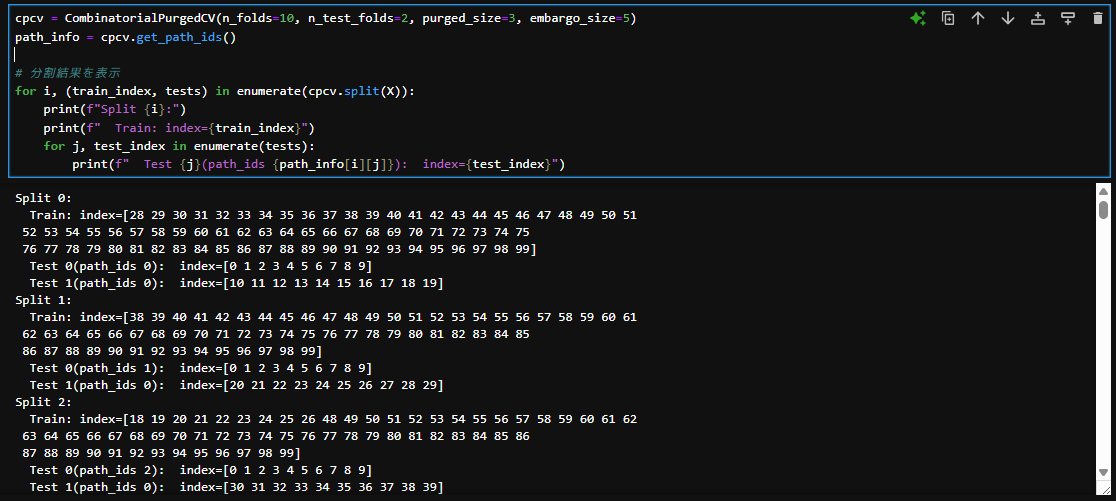
最後にパージとエンバーゴを両方設定しています。テストデータの後にくる学習データは3+5分の隙間をあけて、テストデータの前の学習データには3の隙間が空いています。