NumpyでHarisのコーナー検出を実装してみます。
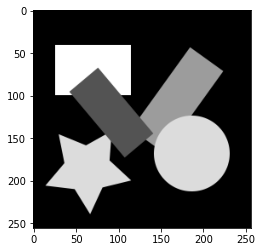
コーナーを検出する画像を読み込みます。
import numpy as np
import matplotlib.pyplot as plt

original_image = plt.imread(image_name)
if np.issubdtype(original_image.dtype, np.integer):
  original_image = original_image / np.iinfo(original_image.dtype).max
gray_image = 0.2116 * original_image[:,:,0] + 0.7152 * original_image[:,:,1] + 0.0722 * original_image[:,:,2]
plt.imshow(gray_image, cmap='gray')
画像にフィルターを畳み込む関数を定義します。詳細は以下の記事を参照してください。
【画像処理】Numpyで空間フィルタリング(畳み込み演算) - Qiita
def _convolve2d(image, kernel):
  shape = (image.shape[0] - kernel.shape[0] + 1, image.shape[1] - kernel.shape[1] + 1) + kernel.shape
  strides = image.strides * 2
  strided_image = np.lib.stride_tricks.as_strided(image, shape, strides)
  return np.einsum('kl,ijkl->ij', kernel, strided_image)

def _convolve2d_multichannel(image, kernel):
  convolved_image = np.empty((image.shape[0] - kernel.shape[0] + 1, image.shape[1] - kernel.shape[1] + 1, image.shape[2]))
  for i in range(image.shape[2]):
    convolved_image[:,:,i] = _convolve2d(image[:,:,i], kernel)
  return convolved_image

def _pad_singlechannel_image(image, kernel_shape, boundary):
  return np.pad(image, ((int(kernel_shape[0] / 2),), (int(kernel_shape[1] / 2),)), boundary)

def _pad_multichannel_image(image, kernel_shape, boundary):
  return  np.pad(image, ((int(kernel_shape[0] / 2),), (int(kernel_shape[1] / 2),), (0,)), boundary)

def convolve2d(image, kernel, boundary='edge'):
  if image.ndim == 2:
    pad_image = _pad_singlechannel_image(image, kernel.shape, boundary) if boundary is not None else image
    return _convolve2d(pad_image, kernel)
  elif image.ndim == 3:
    pad_image = _pad_multichannel_image(image, kernel.shape, boundary) if boundary is not None else image
    return _convolve2d_multichannel(pad_image, kernel)
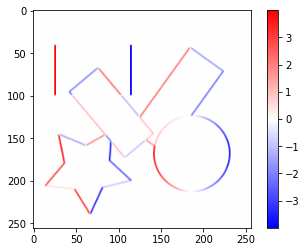
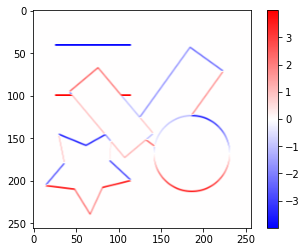
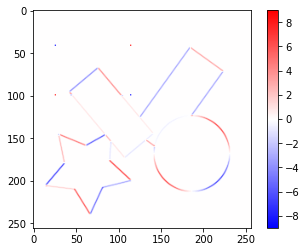
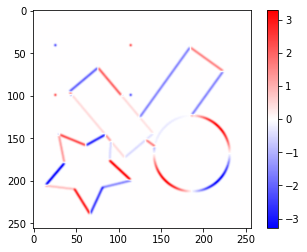
Sobelフィルターで横方向、縦方向の勾配画像$I_x$、$I_y$をそれぞれ作成します。
sobel_x_kernel = np.array([[-1, 0, 1],
                           [-2, 0, 2],
                           [-1, 0, 1]])
sobel_x_image = convolve2d(gray_image, sobel_x_kernel)
value_range = max(abs(sobel_x_image.min()), abs(sobel_x_image.max()))
plt.imshow(sobel_x_image, cmap='bwr', vmin=-value_range, vmax=value_range)
plt.colorbar()
sobel_y_kernel = np.array(([[1, 2, 1],
                            [0, 0, 0],
                            [-1, -2, -1]]))
sobel_y_image = convolve2d(gray_image, sobel_y_kernel)
value_range = max(abs(sobel_y_image.min()), abs(sobel_y_image.max()))
plt.imshow(sobel_y_image, cmap='bwr', vmin=-value_range, vmax=value_range)
plt.colorbar()
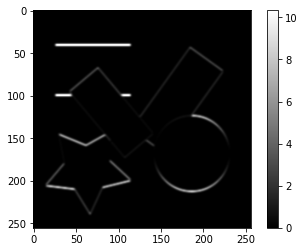
勾配画像から$I_{xx}=I_x\cdot I_x$、$I_{yy}=I_y\cdot I_y$、$I_{xy}=I_x\cdot I_y$を求めます。
sobel_x2_image = sobel_x_image ** 2
plt.imshow(sobel_x2_image, cmap='gray')
plt.colorbar()

sobel_y2_image = sobel_y_image ** 2
plt.imshow(sobel_y2_image, cmap='gray')
plt.colorbar()
sobel_xy_image = sobel_x_image * sobel_y_image
value_range = max(abs(sobel_xy_image.min()), abs(sobel_xy_image.max()))
plt.imshow(sobel_xy_image, cmap='bwr', vmin=-value_range, vmax=value_range)
plt.colorbar()
$I_{xx}$、$I_{yy}$、$I_{xy}$から局所領域で平均化した画像$S_{xx}$、$S_{yy}$、$S_{xy}$をそれぞれ作成します。ここではガウシアンフィルターを使用しています。ガウシアンフィルターについては以下の記事を参照してください。
【画像処理】Numpyで平滑化フィルター - Qiita
gaussian_sobel_x2_image = convolve2d(sobel_x2_image, gaussian_kernel)
plt.imshow(gaussian_sobel_x2_image, cmap='gray')
plt.colorbar()

gaussian_sobel_y2_image = convolve2d(sobel_y2_image, gaussian_kernel)
plt.imshow(gaussian_sobel_y2_image, cmap='gray')
plt.colorbar()
gaussian_sobel_xy_image = convolve2d(sobel_xy_image, gaussian_kernel)
value_range = max(abs(gaussian_sobel_xy_image.min()), abs(gaussian_sobel_xy_image.max()))
plt.imshow(gaussian_sobel_xy_image, cmap='bwr', vmin=-value_range, vmax=value_range)
plt.colorbar()
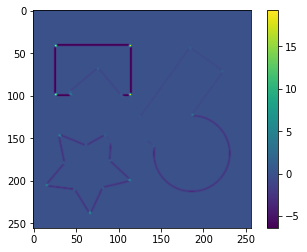
画素$(x,y)$における行列$\boldsymbol{M}$を次のように定義して$R$を求めます。この$R$が一定値以上であれば、その画素をコーナーとみなすことができます。
\boldsymbol{M}(x,y)=
\begin{bmatrix}
S_{xx}(x,y) & S_{xy}(x,y) \\
S_{xy}(x,y) & S_{yy}(x,y) \\
\end{bmatrix} \\
R=det\boldsymbol{M} - k(tr\boldsymbol{M})^2
m = np.stack([np.dstack((gaussian_sobel_x2_image, gaussian_sobel_xy_image)),
              np.dstack((gaussian_sobel_xy_image, gaussian_sobel_y2_image))], axis=-1)
det_m = np.linalg.det(m)
tr_m = np.trace(m, axis1=2, axis2=3)
k = 0.06
r = det_m - k * (tr_m ** 2)
plt.imshow(r)
plt.colorbar()
$R$が一定以上の値の箇所を抽出して、そこに円を描画します。円の描画については以下の記事を参照してください。
【画像処理】Numpyで図形描画 - Qiita
def fill_circle(image, color, center, radius):
  coord = np.fromfunction(lambda y, x: np.dstack((y + 0.5, x + 0.5)), image.shape[:2])
  dist2 = (coord[:,:,1] - center[0]) ** 2 + (coord[:,:,0] - center[1]) ** 2
  condition = dist2 <= radius ** 2
  if image.ndim == 3:
    condition = np.tile(condition.reshape(condition.shape + (1,)), (1, 1, image.shape[2]))
  return np.where(condition, color, image)

corners = np.where(r > 1.0)
corner_image = original_image
for coord in list(zip(corners[1], corners[0])):
  corner_image = fill_circle(corner_image, np.array([1.0, 0.0, 1.0]), coord, 3.0)
plt.imshow(corner_image)
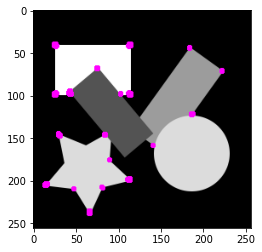
1つのコーナー付近で複数の検出があるので、$R$が局所最大となる画素のみを残します。
def is_local_maximum(image, size=(5, 5), boundary='edge'):
  pad_image = np.pad(image, ((int(size[0] / 2),), (int(size[1] / 2),)), boundary)
  areas = np.lib.stride_tricks.as_strided(pad_image, r.shape + size, pad_image.strides * 2)
  local_maximum = np.max(areas, axis=(2, 3))
  return image == local_maximum

corners = np.where(is_local_maximum(r) & (r > 1.0))
corner_image = original_image
for coord in list(zip(corners[1], corners[0])):
  corner_image = fill_circle(corner_image, np.array([1.0, 0.0, 1.0]), coord, 3.0)
plt.imshow(corner_image)
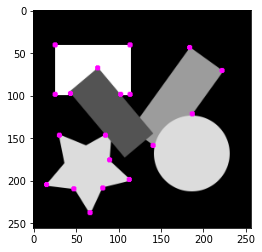
以上、Harisのコーナー検出によりコーナーを検出することができました。
これまでの操作をまとめて一つの関数にします。
def detect_corners_by_haris(image, threshold, k=0.06, gaussian_size=(5, 5), gaussian_sigma=1, local_maximum_size=(5, 5)):
  dx = convolve2d(image, np.array([[-1, 0, 1], [-2, 0, 2], [-1, 0, 1]]))
  dy = convolve2d(image, np.array(([[1, 2, 1], [0, 0, 0], [-1, -2, -1]])))
  dx2 = dx ** 2
  dy2 = dy ** 2
  dxy = dx * dy
  gauss_kernel = create_gaussian_kernel(size=gaussian_size, sigma=gaussian_sigma)
  gdx2 = convolve2d(dx2, gauss_kernel)
  gdy2 = convolve2d(dy2, gauss_kernel)
  gdxy = convolve2d(dxy, gauss_kernel)
  m = np.stack([np.dstack((gdx2, gdxy)), np.dstack((gdxy, gdy2))], axis=-1)
  det_m = np.linalg.det(m)
  tr_m = np.trace(m, axis1=2, axis2=3)
  r = det_m - k * (tr_m ** 2)
  return np.where(is_local_maximum(r, size=local_maximum_size) & (r > threshold))

def draw_circles(image, coordinates, color, radius):
  for coordinate in list(zip(coordinates[1], coordinates[0])):
    image = fill_circle(image, color, coordinate, radius)
  return image

corners = detect_corners_by_haris(gray_image, 1.0)
corner_image = draw_circles(original_image, corners, np.array([1.0, 0.0, 1.0]), 3.0)
plt.imshow(corner_image)
実装したコードはGoogle Colaboratoryに置いてあります。