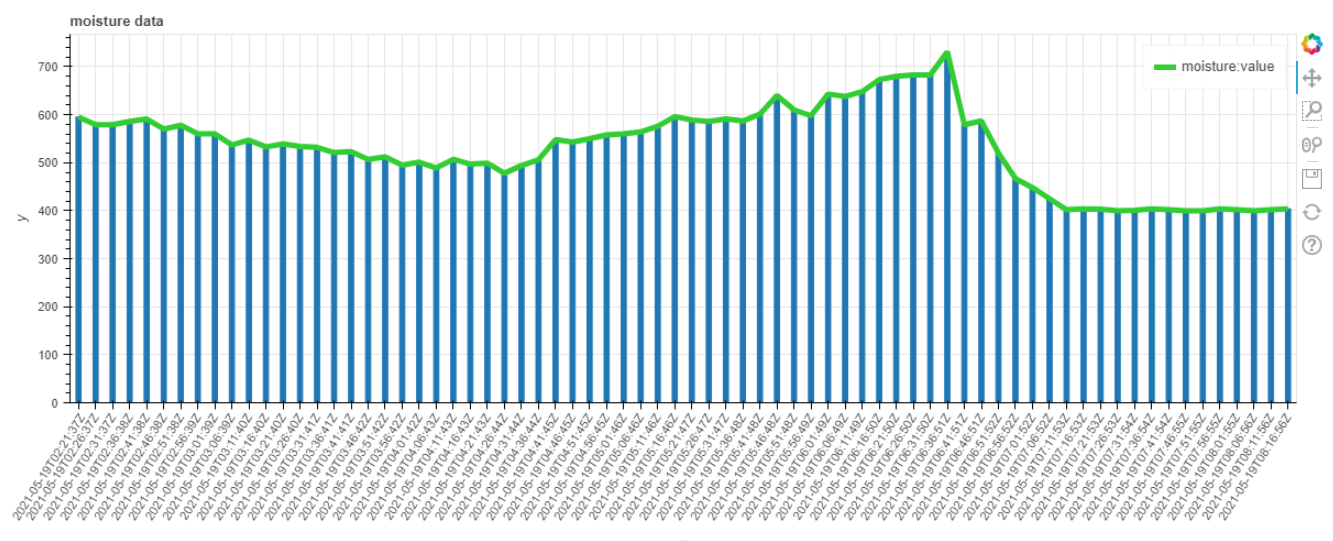
M5StackとMH-Z19Cで部屋のCO2濃度を測定をやってみましたが、自室のCO2濃度がどのように時間変化しているのか気になり、グラフで表示してみることにしました。
やってみるとこんな感じで見えます。グラフの横軸は6時間です。期間外は表示なしです。
密室の中にいると二酸化炭素濃度が上がっていき、窓を開けたりドアの隙間があると下がりました。
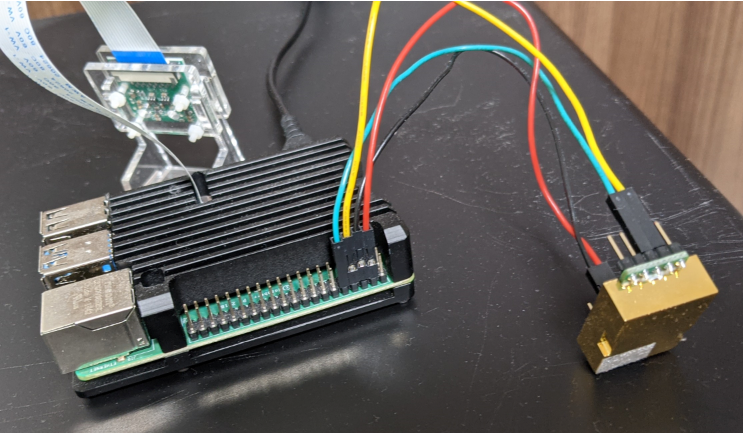
測定デバイスはこんな感じです。
やったことは次のとおりです。
- RaspberryPiとMH-Z19Cを接続してRaspberryPiでCO2濃度取得
- RaspberryPi上にPythonでグラフ表示できる環境構築
- 取得したCO2濃度をPythonでグラフ表示
独自実装なし。他サイト参照がメインです。。。
環境
- RaspberyPi
- MH-19C
- Windows PC (RaspberyPi接続用)
やったこと詳細
- RaspberryPiとMH-Z19Cを接続してRassberryPiでCO2濃度取得
- このページを参考にしました。
- RassberyPiとMH-Z19Cを接続
- RassberyPiをシリアル通信有効化
- mh-z19をインストール
⇒ mh-z19ライブラリを使ってCO2濃度が取得できることを確認。
pi@raspberrypi:~ $ python3 -m mh_z19
{"co2": 401}
-
RaspberryPi上にPythonでグラフ表示できる環境構築
- このページを参考にしました。
- SQLiteをインストール
- データベースを作成
- bokehをインストール
- Flaskをインストール
-
取得したCO2濃度をPythonでグラフ表示
- このページのプログラムを流用改造しました。
moisture_main.py(流用改造)
# ! /usr/bin/env python3
# _*_ coding: utf-8 _*_

import subprocess
from subprocess import PIPE

import datetime
import time, signal, sys

# MH-Z19Cの関数を読み込む
import mh_z19
import json

# Messaging APIのパスを通す
sys.path.append('/home/pi/.local/lib/python3.5/site-packages/')

# sqlite3をインポート
import sqlite3
import datetime

# クラスを作成
class Moisture:
    def __init__(self):
        GAIN = 1

        # クラス初期化時にCO2濃度取得し変数へ格納
        obj = mh_z19.read_all()
        print(obj)
        print(type(obj))
        co2 = obj['co2']
        self.volts = co2

    # logに書き込み
    def log_write(self):
        output_time = time.asctime()
        log_file = open("/home/pi/python/log/moisture.log","a+", encoding="UTF-8
")
        #log_file = open("/var/log/python/moisture.log","a+", encoding="UTF-8")
        log_file.write(output_time + " : " + str(self.volts) + "V" + "\n")
        log_file.close()

    # データベースに書き込み
    def sqlite_insert(self):
        dbname = '/home/pi/python/moisture.db'
        con = sqlite3.connect(dbname)
        cur = con.cursor()
        output_time = datetime.datetime.now()
        output_time = "{0:%Y-%m-%dT%H:%M:%SZ}".format(output_time)
        data = (output_time, self.volts)
        cur.execute('insert into moisture (date, volts) values (?,?)', (data))
        con.commit()
        con.close()

while True:
    # インスタンス生成
    moisture_ins = Moisture()
    # インスタンスにMH-Z19Cから取得したCO2濃度が含まれる
    volts = moisture_ins.volts

    # 閾値判定して表示ログ切り替えているが、DBへの保存は同じ
    if volts >= 1000:
       print( "State with moistured : " + str(volts) + "V" )
       moisture_ins.log_write()
       moisture_ins.sqlite_insert()
    elif volts < 1000 and volts >= 1:
       print( "Condition with reduced moisture : " + str(volts) + "V" )
       moisture_ins.log_write()
       moisture_ins.sqlite_insert()
    else:
       print( "No moisture condition : " + str(volts) + "V")
       moisture_ins.log_write()
       moisture_ins.sqlite_insert()
    time.sleep(300)
moisture_create.py(流用)
# ! /usr/bin/env python3
# _*_ coding: utf-8 _*_

# パスを通す
import sys
sys.path.append('/home/pi/.local/lib/python3.5/site-packages/')

# sqlite3、bokehをインポート
import sqlite3
import datetime
from bokeh.plotting import figure, output_file, show

# クラスを作成
class Moisture:
    x = []
    y = []

    def __init__(self):
        pass

    # データベースから取り出し
    def sqlite_select(self):
        dbname = '/home/pi/python/moisture.db'
        con = sqlite3.connect(dbname)
        cur = con.cursor()
        cur.execute('SELECT date FROM moisture order by date desc limit 72')
        self.x = ([(x[0]) for x in cur.fetchall()])
        cur.execute('SELECT volts FROM moisture order by date desc limit 72')
        self.y = ([(y[0]) for y in cur.fetchall()])
        con.close()

    # グラフ描画
    def graph_draw(self):
    # prepare some data
        x = self.x[::-1]
        y = self.y[::-1]
    # output to static HTML file
        output_file("/home/pi/python/templates/lines.html")
    # create a new plot with a title and axis labels
        p = figure(title="moisture data", plot_width=1200, plot_height=500, x_axis_label='x', y_axis_label='y', x_range=x)
        p.vbar(x=x, top=y, width=0.3)
        p.y_range.start = 0
        p.xaxis.major_label_orientation = 1
    # add a line renderer with legend and line thickness
        p.line(x, y, line_width=5,legend="moisture:value", color="limegreen")
    # show the results
        show(p)

# インスタンス生成
moisture_ins = Moisture()
moisture_ins.sqlite_select()
moisture_ins.graph_draw()
moisture_main.pyを起動すると二酸化炭素濃度のグラフ描画が始まります。
グラフを表示するには、ブラウザでRaspberryPiのポート5000にアクセスするとできます。
関数や変数すべて流用のため、チグハグ感がありますが、
とりあえず目的は達成できました。
- まとめ
- pythonのライブラリが充実していることを再認識しました。
- グラフを作ってみると、グラフの更新は手動だったり、目盛りが小さくて見づらかったりとで
もう少し受動的に状態がわかるとありがたいことに気が付きました。