0
2

Delete article

Deleted articles cannot be recovered.

Draft of this article would be also deleted.

Are you sure you want to delete this article?

More than 3 years have passed since last update.

2次元正規分布の確率密度関数を3次元グラフにプロットする

Posted at

はじめに

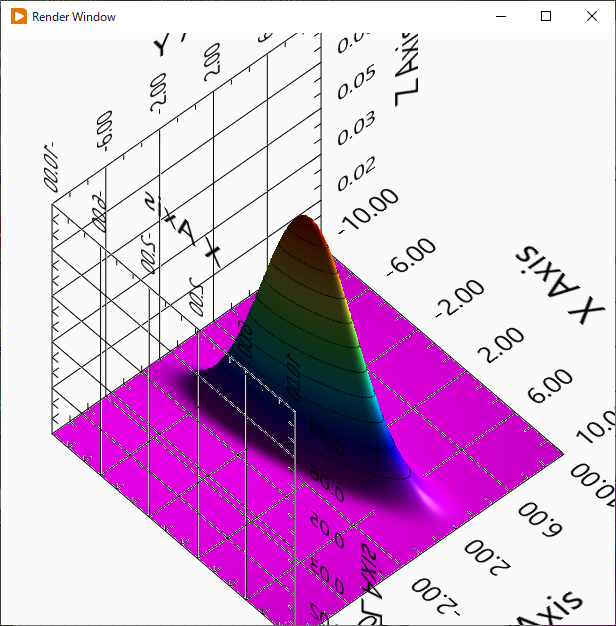
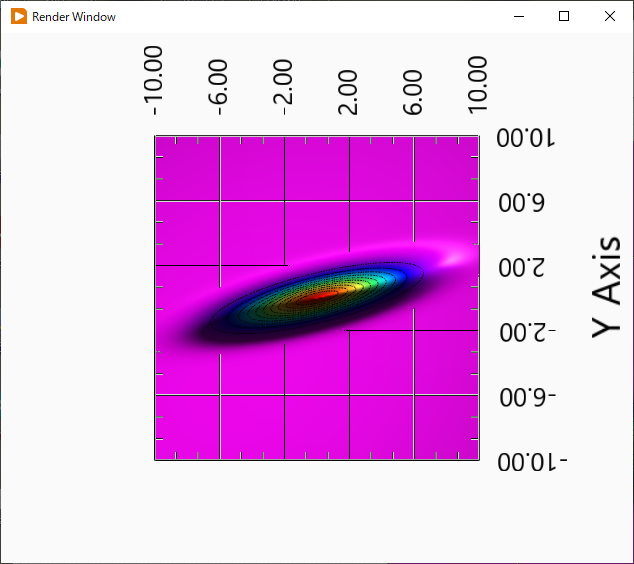
LabVIEWの3次元コンタープロット関数を使って、2次元正規分布の確率密度関数を3次元グラフ上に表示するプログラムを作成しました。
xおよびyの平均値を0とした、下記の確率密度関数を使って確率密度を計算しています。
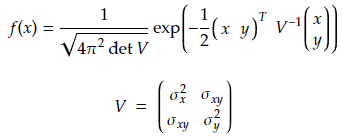
image.png

処理のながれ

  1. xおよびyの標準偏差および相関係数を設定可能とし、それらを使って共分散行列を作成します。
  2. 共分散行列の逆行列と行列式を計算します。
  3. expの指数部を計算します。
  4. 3Dコンターへプロットします。

下にあるダイアグラムをながめた方が分かりやすいかもしれません。

フロントパネルとダイアグラム

image.png

image.png

おわりに

様々な角度からグラフの形状を眺めることで、2次元正規分布の理解の一助になれば幸いです。
ちなみにですが、LabVIEWの無料版は以下リンクからダウンロードできます。

LabVIEW Community Edition
https://www.ni.com/ja-jp/shop/labview/select-edition/labview-community-edition.html
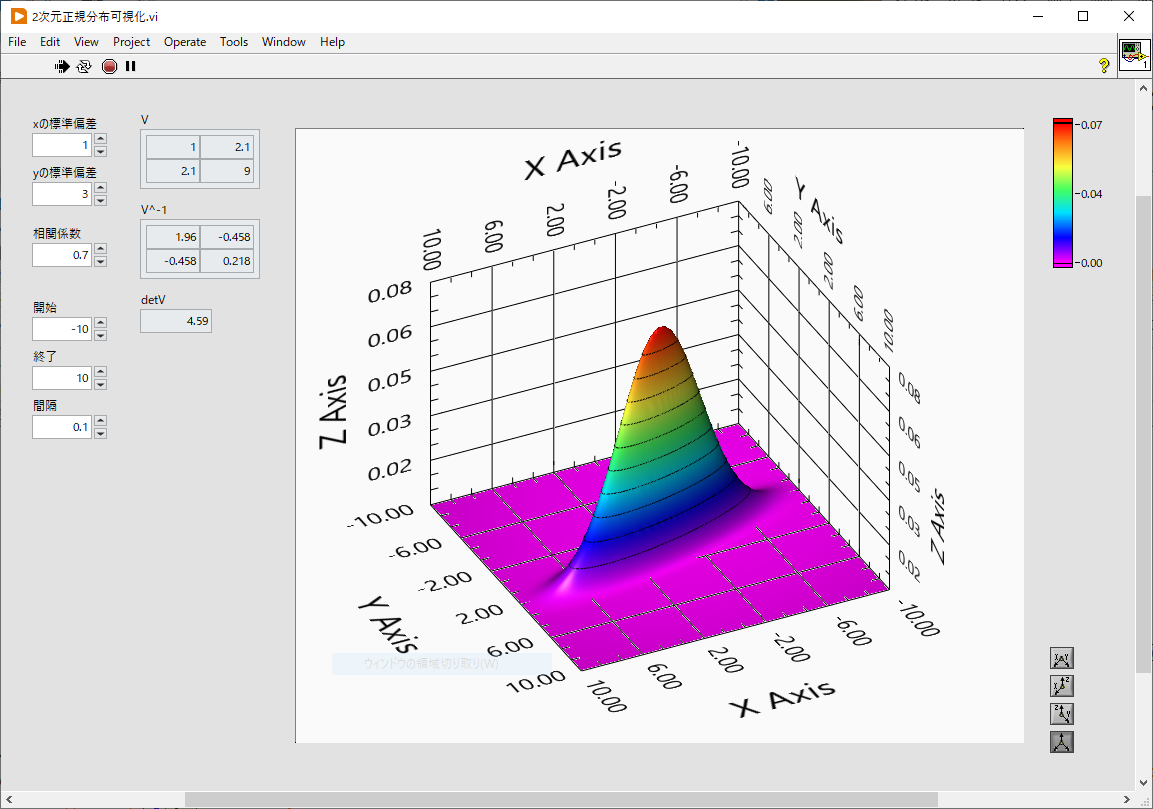
image.png

image.png

0
2
0

Register as a new user and use Qiita more conveniently

  1. You get articles that match your needs
  2. You can efficiently read back useful information
  3. You can use dark theme
What you can do with signing up
0
2

Delete article

Deleted articles cannot be recovered.

Draft of this article would be also deleted.

Are you sure you want to delete this article?