今日から4日間、svg による chart を作成します。React は svg と相性が良く、形状に沿って MouseEvent をバインドすることが出来ます。手書きの場合、デザイン・挙動の制約が無くなるので、未経験の方は是非挑戦してみてください。
code: github / $ yarn 1215
 |
 |
|---|
chart 作成にあたり必要な手順は決まっています。
- Records を元に描画領域・座標を算出
- Context Hooks に演算した値を凝集
- 各要素が useContext で値を利用
Record
まず始めに、グラフの元になる Record の型定義から始めます。
type Record = {
  color: string
  point: number
  name: string
}
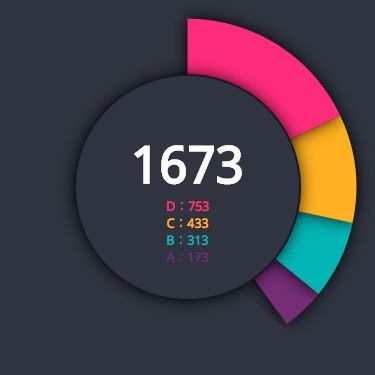
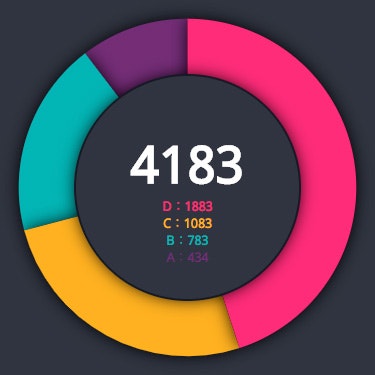
サンプルではダミーを使います。
const defaultRecords: Record[] = [
  { color: '#742d76', point: 434, name: 'A' },
  { color: '#00b5b5', point: 783, name: 'B' },
  { color: '#ffb100', point: 1083, name: 'C' },
  { color: '#ff0079', point: 1883, name: 'D' }
]
usePieChart
今回の Custom Hooks 内訳です。totalPoint は中央に表示する数値、progress はアニメーション進捗に利用します。
const usePieChart = (props: Props) => {
  const [{ records, totalPoint }] = useState(...)
  const [progress, updateProgress] = useState(...)
  const rectSize = useMemo(...)
  const padding = useMemo(...)
  const size = useMemo(...)
  const centerCircleRadius = useMemo(...)
  const handleUpdate = useCallback(...)
  useEffect(...)
  return {
    rectSize,
    size,
    padding,
    centerCircleRadius,
    records,
    totalPoint,
    progress
  }
}
表示領域は正方形なので、ref 要素の短辺を取得します。 ref は Custom Hooks で宣言せず、usePieChart を利用するコンポーネントから注入します。
const rectSize = useMemo(
  () => {
    if (props.ref.current === null) return 0
    const { width, height } = props.ref.current.getBoundingClientRect()
    return width > height ? height : width
  },
  [ props.ref.current ]
)
余白を除外した描画領域サイズを取得します。この余白が svg を書く時のコツです。svg サイズいっぱいに描画してしまうと、線が見切れたり、今回施している様なドロップシャドウが欠けてしまいます。
const padding = useMemo(
  () => {
    return rectSize * props.padding
  },
  [ rectSize, props.padding ]
)
const size = useMemo(
  () => {
    return rectSize - padding * 2
  },
  [ rectSize, padding ]
)
マウント後所定時間アニメーションするため、その進捗(progress)を保持しており、useEffect で更新を行います。
useEffect(
  () => {
    let interval: any
    if (progress !== 1) {
      interval = setInterval(handleUpdate, 8)
    }
    return () => clearInterval(interval)
  },
  [ progress ]
)
Context Hooks
型付き空 context を作成し、Provider コンポーネントで usePieChart の戻り値を注入します。
export const PieChartContext = createContext(
  {} as ReturnType<typeof usePieChart>
)
export default (props: Props) => {
  const ref = useRef(null! as HTMLDivElement)
  const value = usePieChart({
    ref,
    padding: 0.05, // 描画領域短辺の5%分余白を上下左右に設ける
    centerCircleRadius: 0.3, // 描画領域短辺の30%分半径の円を中央に設ける
  })
  return (
    <PieChartContext.Provider value={value}>
      <div ref={ref}>{props.children}</div>
    </PieChartContext.Provider>
  )
}
Chart
svg tag wrapper です。props.children で svg elements を配置します。filter 要素をここに起きますが、id名 は html内で一意である必要があるので注意してください。
const View = (props: Props) => (
  <svg
    viewBox={`0 0 ${props.rectSize} ${props.rectSize}`}
    width={props.rectSize}
    height={props.rectSize}
  >
    <filter id="drop-shadow">
      <feGaussianBlur stdDeviation="8" />
    </filter>
    {props.children}
  </svg>
)

export default (props: { children?: React.ReactNode }) => {
  const { rectSize } = useContext(PieChartContext)
  return useMemo(
    () => <View rectSize={rectSize}>{props.children}</View>,
    [rectSize]
  )
}
扇コンポーネント配列です。ドロップシャドウのために一扇につき path を2つ書きます。svg filter は負荷が高いので、低スペック環境ではレンダリングがモタつきます。パフォーマンスと表現のトレードオフですね。
const View = (props: Props) => {
  let currentDeg = 0
  return (
    <>
      {props.records
        .map((record, index) => {
          const radius = props.size * 0.5
          const value =
            (record.point / props.totalPoint) *
            99.999 *
            props.progress // アニメーションの進捗を形状に反映
          const K = (2 * Math.PI) / (100 / value)
          const x = radius - Math.cos(K) * radius
          const y = radius + Math.sin(K) * radius
          const long = value <= 50 ? 0 : 1
          const T = radius + props.padding
          const M = `${T},${T}`
          const L = `${T},${props.padding}`
          const A = `${radius},${radius}`
          const XY = `${y + props.padding},${x +
            props.padding}`
          const d = `M${M} L${L} A${A} 0 ${long},1 ${XY} z` // 形状指定文字列
          const rotd = `${currentDeg * props.progress}`
          const rotx = `${T}`
          const roty = `${T}`
          const transform = `rotate(${rotd}, ${rotx}, ${roty})` // 扇の回転角
          const path = (
            <g key={index}>
              <path
                d={d}
                transform={transform}
                filter="url(#drop-shadow)"
              /> // ドロップシャドウの扇
              <path
                d={d}
                transform={transform}
                fill={record.color}
                onClick={() => console.log(record.name)}
              />
            </g>
          )
          currentDeg +=
            (360 * record.point) / props.totalPoint
          return path
        })
        .reverse()} // 影の重ね順を反転させる
    </>
  )
}