
はじめに

Plotlyで3Dグラフを描いたとき、「軸タイトルがない」「背景が白すぎて分かりにくい」と感じたことはありませんか?
今回は、3Dグラフを"読みやすく整える"ための基本設定をまとめます。Google Colabでもそのまま動きます。
目的
- Plotlyの3Dグラフで軸タイトル・単位・背景・タイトルを設定できるようにする
- どのグラフでも再利用できるレイアウトテンプレートを理解する
- Surface/Scatter/Lineなど共通で使える設定を整理する
実装例:3D Surfaceを描く
import plotly.graph_objects as go
import numpy as np

# サンプルデータ
x = np.linspace(-2, 2, 50)
y = np.linspace(-2, 2, 50)
X, Y = np.meshgrid(x, y)
Z = np.sin(np.sqrt(X**2 + Y**2))

# 3Dサーフェス
fig = go.Figure(data=[go.Surface(x=X, y=Y, z=Z, colorscale='Viridis')])
fig.show()
これで3Dグラフは表示されますが、軸ラベルも背景もなく「どの方向かわかりにくい」状態です。

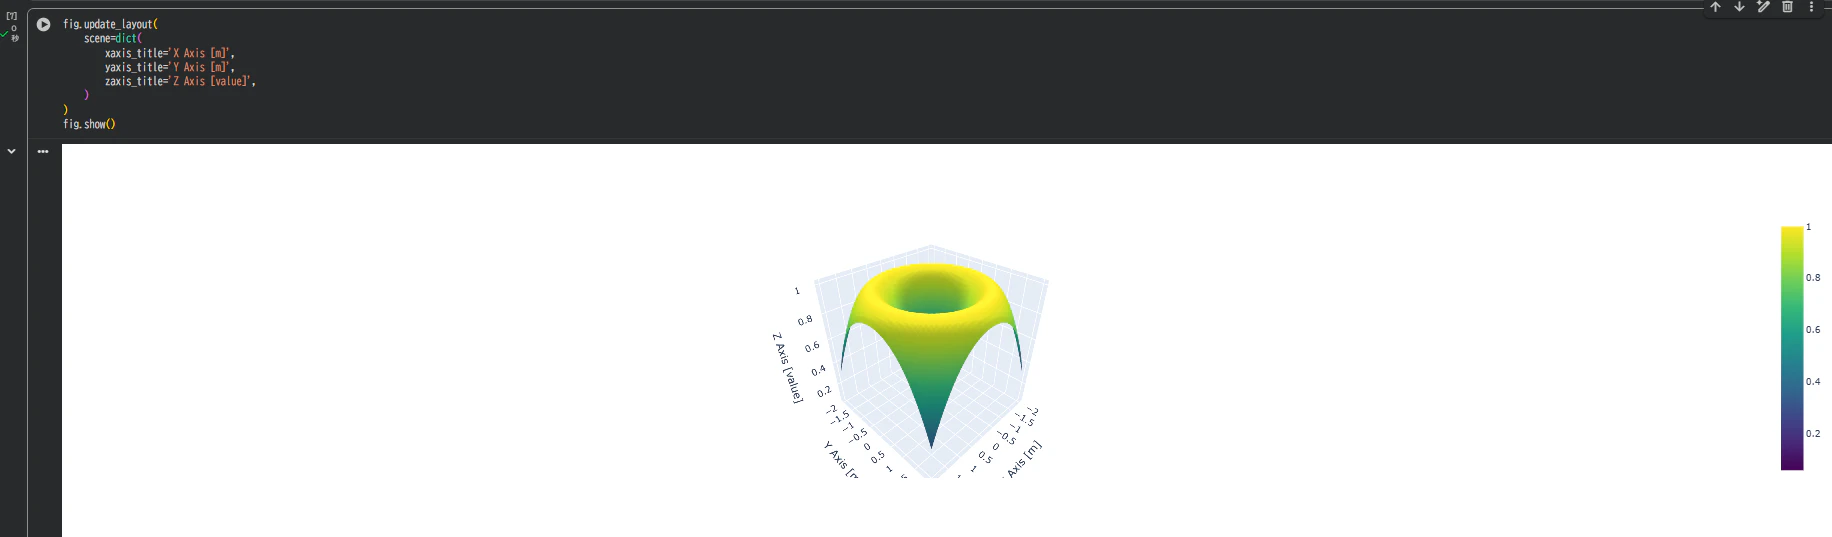
軸タイトルとラベルを設定する
fig.update_layout(
    scene=dict(
        xaxis_title='X Axis [m]',
        yaxis_title='Y Axis [m]',
        zaxis_title='Z Axis [value]',
    )
)
fig.show()
| 設定項目 | 説明 |
|---|---|
| xaxis_title, yaxis_title, zaxis_title | 各軸のタイトル文字列 |
| [m], [°C] など | 単位を明示すると見やすい |
| scene | 3D空間全体の設定ブロック |
軸タイトルをつけるだけで、グラフの「意味」がわかりやすくなります。
軸スタイルと背景を整える
fig.update_layout(
    scene=dict(
        xaxis=dict(
            backgroundcolor='rgb(240,240,240)',
            gridcolor='white',
            showbackground=True,
            zerolinecolor='black',
        ),
        yaxis=dict(
            backgroundcolor='rgb(240,240,240)',
            gridcolor='white',
            showbackground=True,
            zerolinecolor='black',
        ),
        zaxis=dict(
            backgroundcolor='rgb(240,240,240)',
            gridcolor='white',
            showbackground=True,
            zerolinecolor='black',
        ),
    )
)
fig.show()
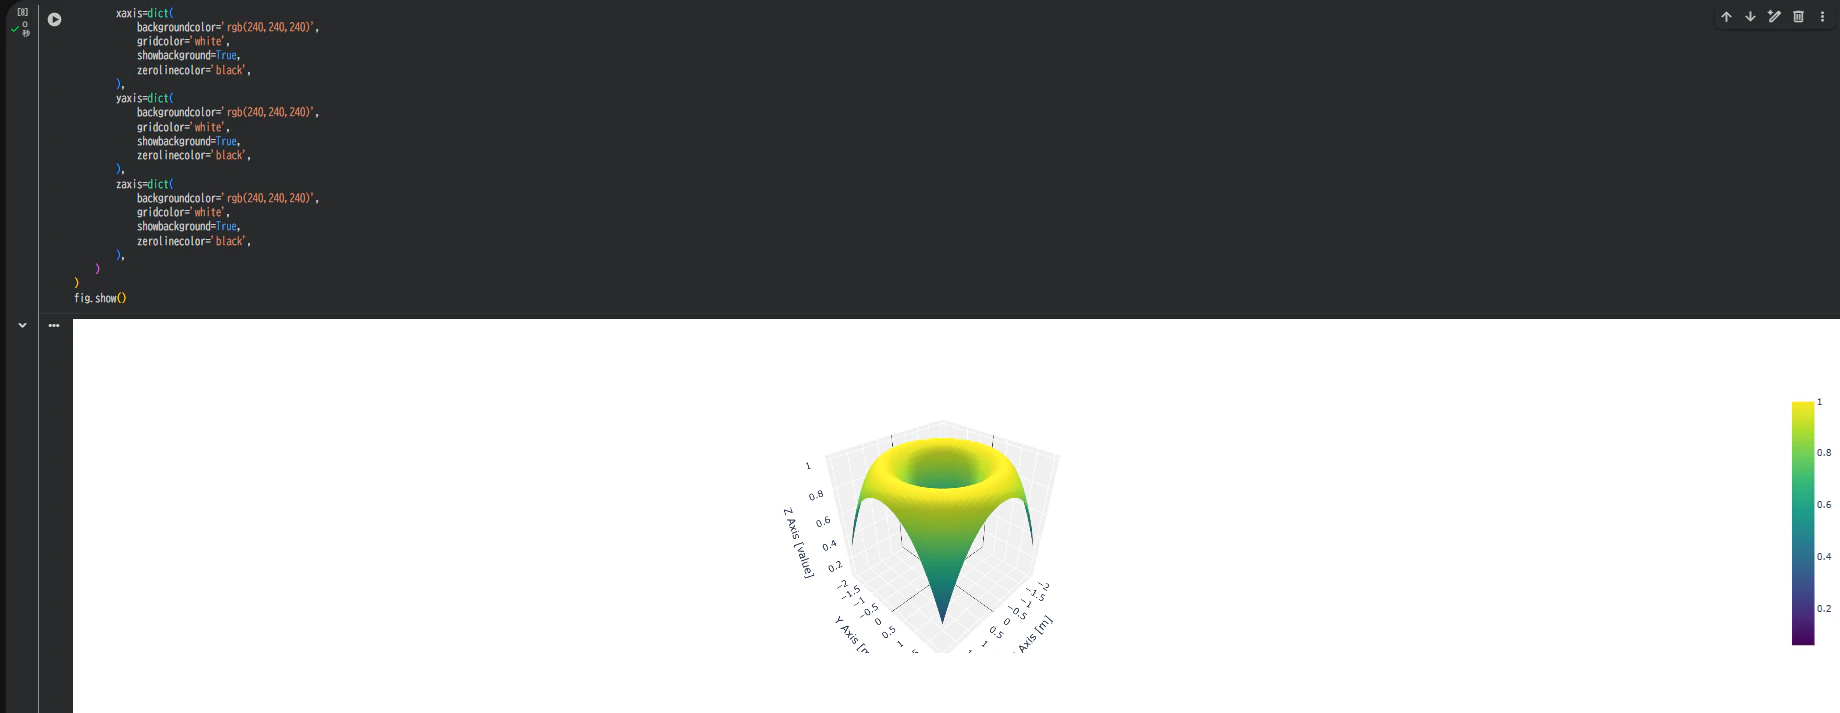
背景を薄いグレーにすると、奥行き感が出て3D構造が視覚的にわかりやすくなります。
タイトル・アスペクト比を設定
fig.update_layout(
    title="3D Surface with Axis Titles",
    scene=dict(aspectmode='data')  # 軸の比率をデータに合わせる
)
| オプション | 内容 |
|---|---|
| title | グラフタイトル |
| scene.aspectmode='data' | X,Y,Zのスケールを自動調整(歪み防止) |
| aspectmode='cube' | すべての軸を等長(立方体表示) |

軸フォント・タイトル位置の調整
fig.update_layout(
    scene=dict(
        xaxis_title='X Axis',
        yaxis_title='Y Axis',
        zaxis_title='Z Axis',
        xaxis_title_font=dict(size=14, color='black'),
        yaxis_title_font=dict(size=14, color='black'),
        zaxis_title_font=dict(size=14, color='black'),
    ),
    title=dict(
        text="Customized 3D Axes",
        font=dict(size=18, color='darkblue')
    )
)
タイトル文字の大きさ・色を変えるだけで、資料用グラフにもそのまま使える見栄えになります。

散布図にも同じ設定を適用可能
import plotly.graph_objects as go
import numpy as np

x, y, z = np.random.randn(3, 100)
fig = go.Figure(data=[go.Scatter3d(x=x, y=y, z=z, mode='markers')])

fig.update_layout(
    title='3D Scatter with Axis Labels',
    scene=dict(
        xaxis_title='Longitude',
        yaxis_title='Latitude',
        zaxis_title='Height [m]',
        xaxis=dict(backgroundcolor='rgb(245,245,245)'),
        yaxis=dict(backgroundcolor='rgb(245,245,245)'),
        zaxis=dict(backgroundcolor='rgb(245,245,245)'),
        aspectmode='data'
    )
)
fig.show()
Surface/Scatter/Line どれでも scene セクションを共通で設定できます。

よく使うテンプレート化
def set_3d_layout(fig, title="3D Graph"):
    fig.update_layout(
        title=title,
        scene=dict(
            xaxis_title='X Axis',
            yaxis_title='Y Axis',
            zaxis_title='Z Axis',
            xaxis=dict(backgroundcolor='rgb(240,240,240)', gridcolor='white'),
            yaxis=dict(backgroundcolor='rgb(240,240,240)', gridcolor='white'),
            zaxis=dict(backgroundcolor='rgb(240,240,240)', gridcolor='white'),
            aspectmode='data'
        )
    )
    return fig
トラブルシュート
| 症状 | 対処 |
|---|---|
| 軸タイトルが表示されない | scene ブロック外に書いていないか確認 |
| 背景が黒い | showbackground=True が抜けている可能性 |
| 軸が歪んで見える | aspectmode='data' で自動調整 |
| タイトルが切れる | title_x=0.5 を追加して中央寄せ可 |
まとめ

-
軸タイトル(x, y, z)を設定すると、データの意味が一目で分かるようになります。
-
背景色を調整することで、立体感や奥行きを演出できます。
-
aspectmode='data'を指定すると、比率の歪みを防ぎ、自然な形状で表示できます。
-
これらの設定はSurface・Scatter・Lineなど、すべての3Dグラフに共通して活用できます。
軸ラベルと背景を整えるだけで、立体的で読みやすい3Dグラフが実現します。
3D表示では立体感よりも、軸が伝える“文脈”がより重要です。