はじめに
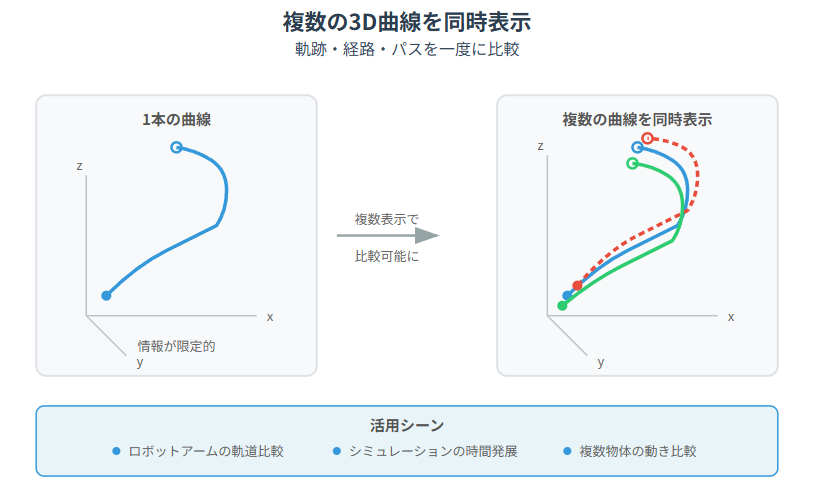
3D空間では「1本の曲線」よりも、複数の軌跡を比較する可視化が役に立つ場面が多いです。
ロボットアームの軌道、シミュレーションの時間発展、複数物体の動き比較、PCA 軸のパスなど、
複数の3Dラインを重ねて表示することで、構造や違いが直感的に理解できます。
今回は Plotly を使って 複数の3D曲線を同時に表示する方法 を整理します。
この記事でできること
- 複数の 3D ライン(line3d)をひとつの図に重ねて描画できる
- カラーやスタイルで曲線を識別しやすくする
- 曲線の開始点・終了点にマーカーを置いて理解を手助け
- Colabでそのまま動くコード付き
実装例
まずは、3本の曲線を同時に表示する基本パターン。
import plotly.graph_objects as go
import numpy as np

t = np.linspace(0, 4*np.pi, 200)

# 3種類の3D曲線
x1, y1, z1 = np.sin(t), np.cos(t), t * 0.1
x2, y2, z2 = np.sin(t+1), np.cos(t+1), t * 0.1 + 0.5
x3, y3, z3 = np.sin(t+2), np.cos(t+2), t * 0.1 - 0.5

fig = go.Figure()

fig.add_trace(go.Scatter3d(
    x=x1, y=y1, z=z1,
    mode='lines',
    line=dict(color='blue', width=5),
    name='Curve A'
))

fig.add_trace(go.Scatter3d(
    x=x2, y=y2, z=z2,
    mode='lines',
    line=dict(color='red', width=5),
    name='Curve B'
))

fig.add_trace(go.Scatter3d(
    x=x3, y=y3, z=z3,
    mode='lines',
    line=dict(color='green', width=5),
    name='Curve C'
))

fig.update_layout(
    title="Multiple 3D Curves",
    scene=dict(aspectmode='data')
)
fig.show()
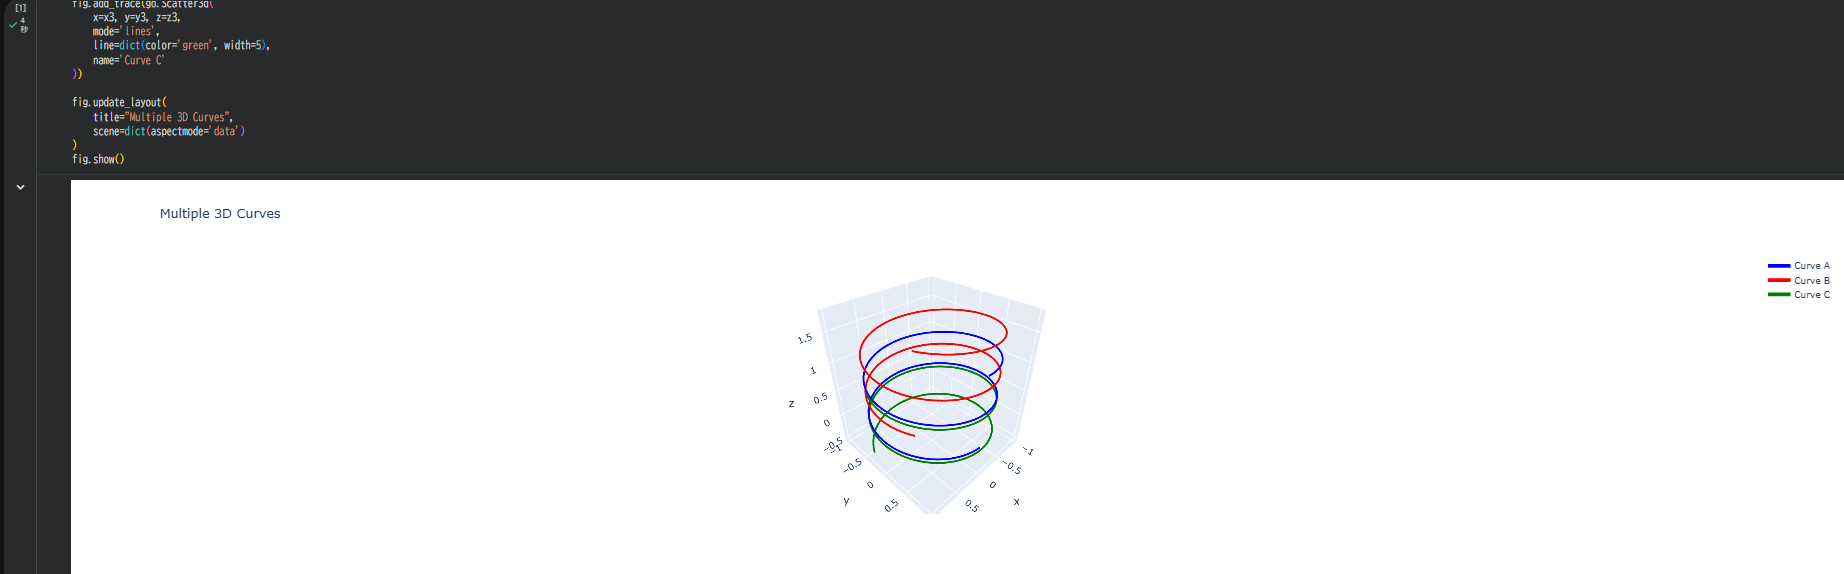
結果
- ラインが3本重なった三次元パスが表示される
- 凡例でON/OFF切り替えが可能
- 曲線の位置関係・距離・変化パターンが一目でわかる
曲線の開始点・終了点にマーカーを追加する
軌跡図では「どこから始まり、どこで終わるか」を示すと読みやすい。
def add_start_end_markers(fig, x, y, z, color):
    # 開始点
    fig.add_trace(go.Scatter3d(
        x=[x[0]], y=[y[0]], z=[z[0]],
        mode='markers',
        marker=dict(size=6, color=color, symbol='circle'),
        showlegend=False
    ))
    # 終了点
    fig.add_trace(go.Scatter3d(
        x=[x[-1]], y=[y[-1]], z=[z[-1]],
        mode='markers',
        marker=dict(size=6, color=color, symbol='cross'),
        showlegend=False
    ))

# 例:Curve A/B/Cにマーカー追加
add_start_end_markers(fig, x1, y1, z1, "blue")
add_start_end_markers(fig, x2, y2, z2, "red")
add_start_end_markers(fig, x3, y3, z3, "green")
結果
- 「丸=開始」「×=終了」という視覚ルールを入れると理解しやすくなる
- 時系列データの軌跡表示にも便利
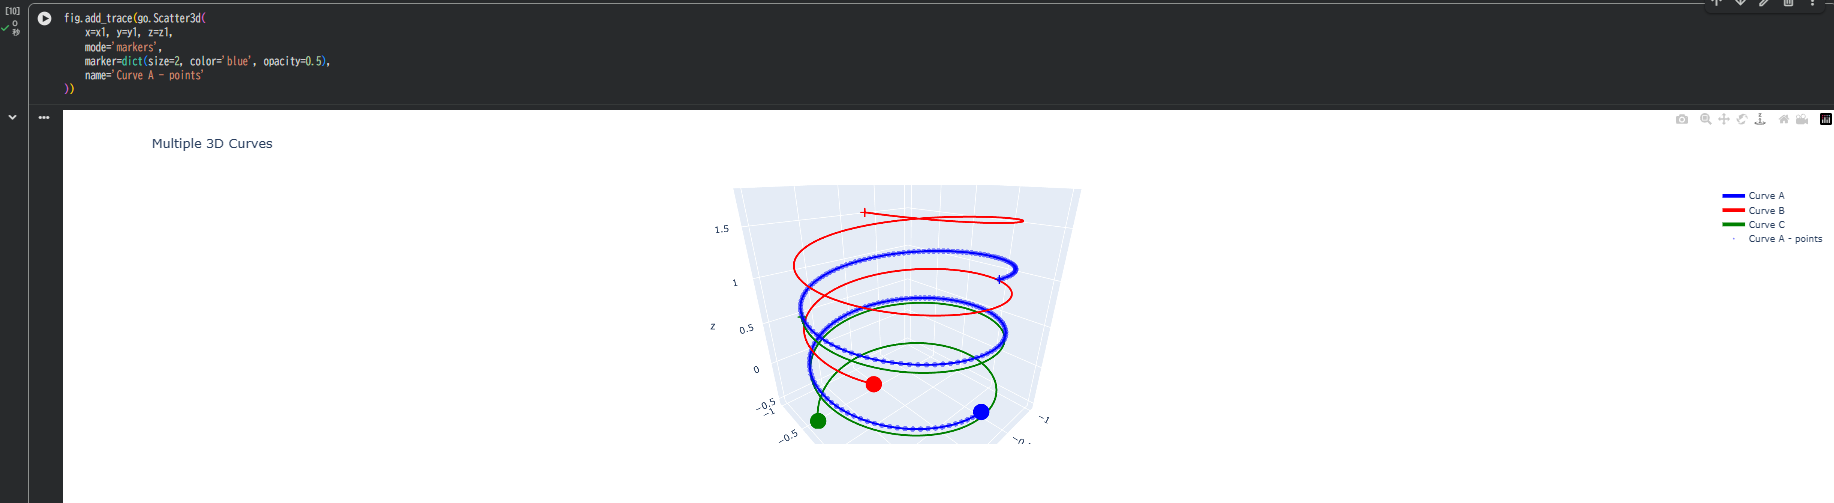
それぞれの曲線に点を散らして"軌跡の質"を見せる
線だけだと「密度」や「速度感」が伝わりにくい。
点を散らすと"どこで変化が速いか"が視覚的にわかる。
fig.add_trace(go.Scatter3d(
    x=x1, y=y1, z=z1,
    mode='markers',
    marker=dict(size=2, color='blue', opacity=0.5),
    name='Curve A - points'
))
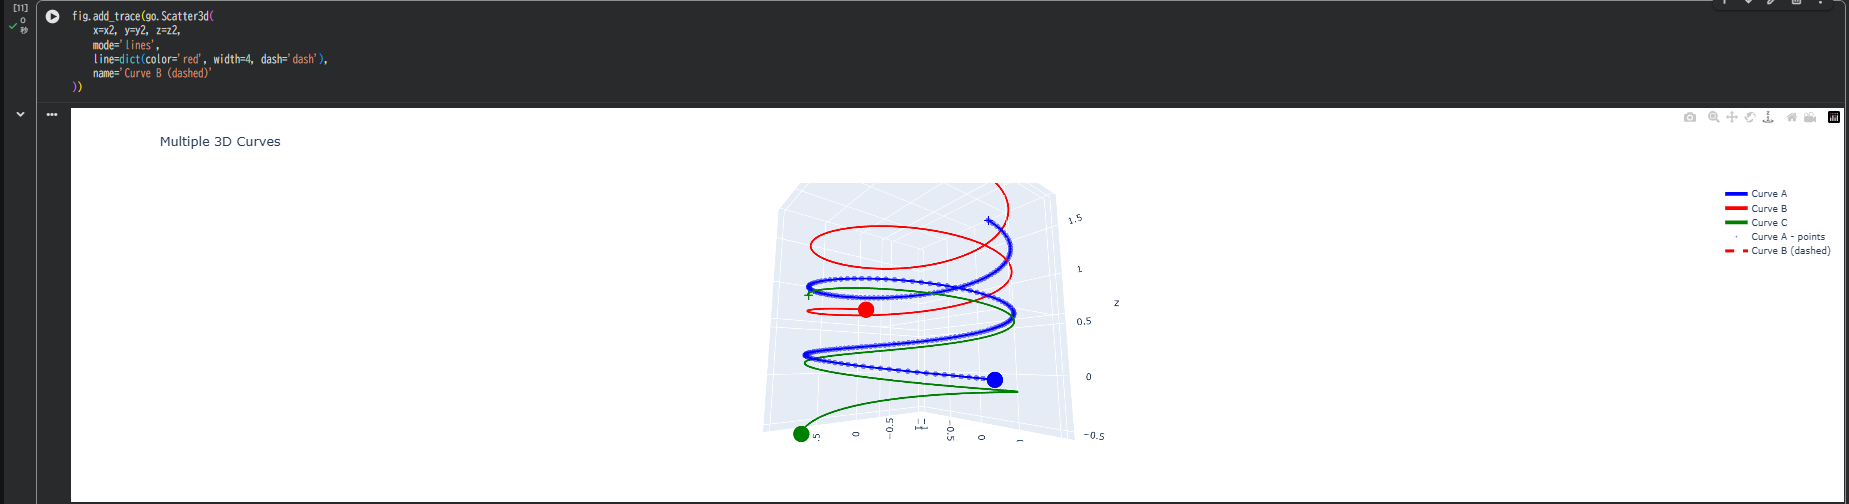
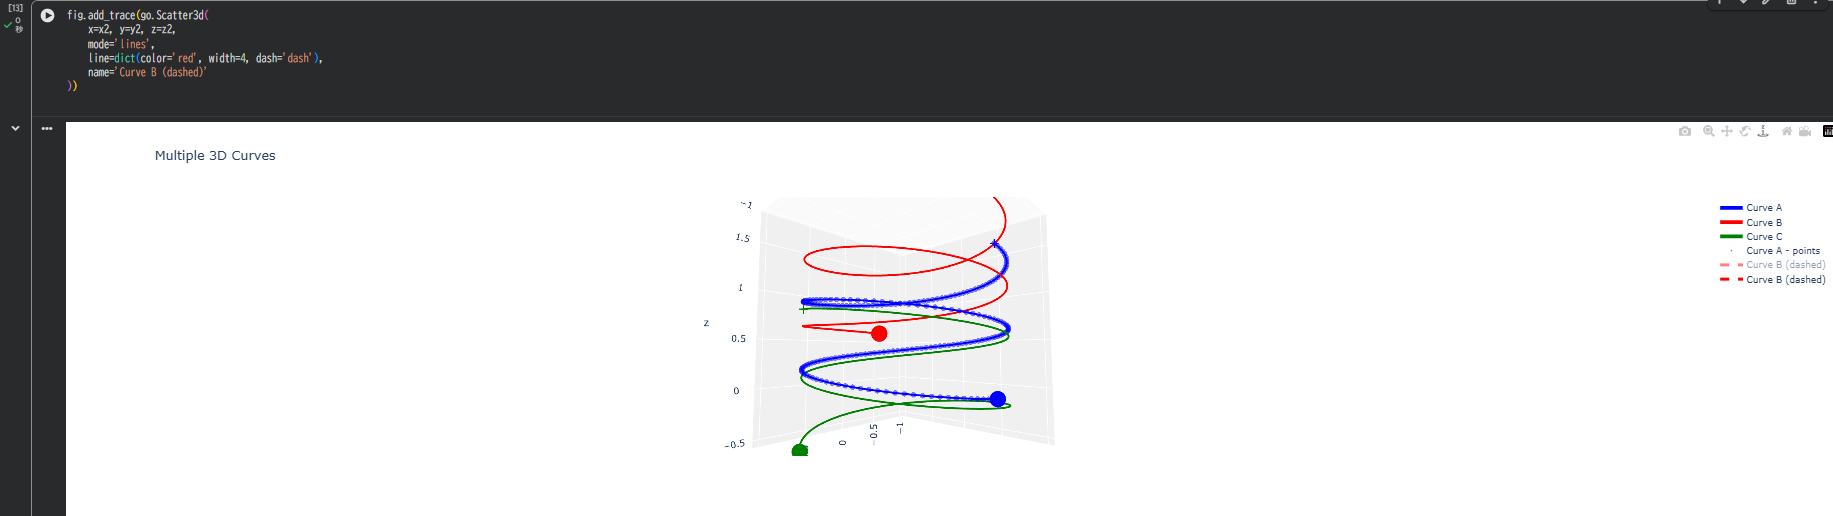
曲線ごとにスタイル(太さ・点線)を変える
Plotly では 3D の点線は "dash"が使える。
fig.add_trace(go.Scatter3d(
    x=x2, y=y2, z=z2,
    mode='lines',
    line=dict(color='red', width=4, dash='dash'),
    name='Curve B (dashed)'
))
利用可能なスタイル:
"solid" (デフォルト値)
"dot"
"dash"
"longdash"
"dashdot"
"longdashdot"
3D背景・軸・視点調整で複数曲線の比較が見やすくなる
fig.update_layout(
    scene=dict(
        xaxis=dict(backgroundcolor='rgb(240,240,240)'),
        yaxis=dict(backgroundcolor='rgb(240,240,240)'),
        zaxis=dict(backgroundcolor='rgb(250,250,250)'),
        aspectmode='data'
    )
)
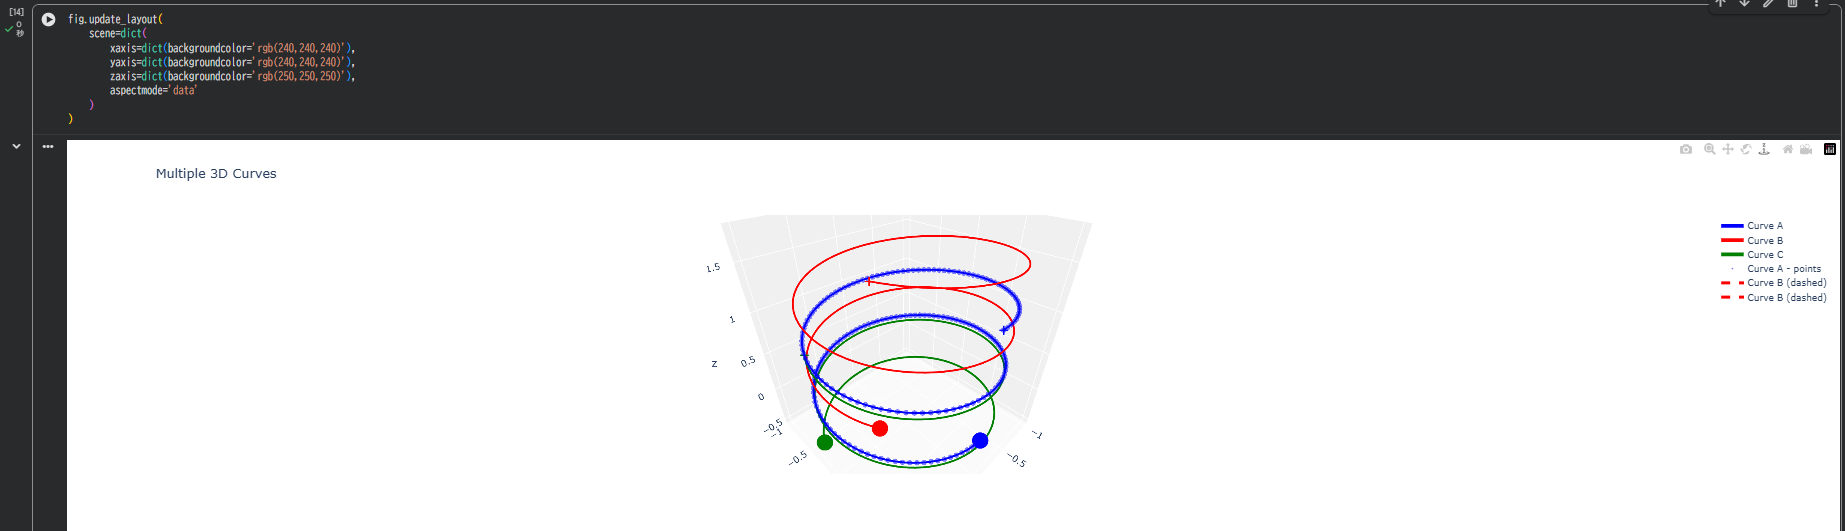
ポイント
- 背景色を薄くすると曲線の色が映える
-
aspectmode='data'はデータの比率を維持したい場合に推奨(曲線が歪まない)
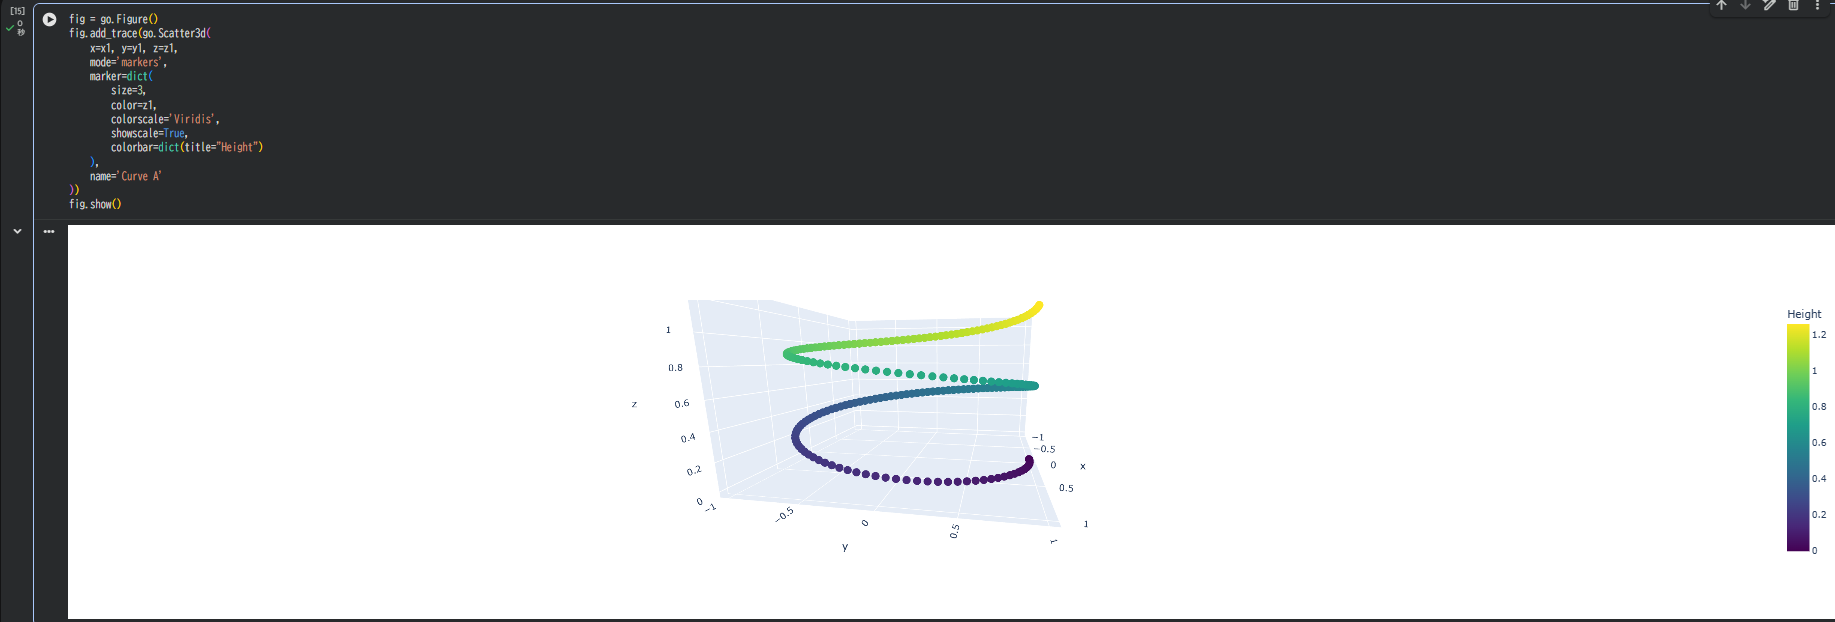
応用:複数曲線を「色のカラーバー」付きで表示する
たとえば z の高さで色を変えると、
「高さの変化パターン」もひと目でわかる。
fig = go.Figure()
fig.add_trace(go.Scatter3d(
    x=x1, y=y1, z=z1,
    mode='markers',
    marker=dict(
        size=3,
        color=z1,
        colorscale='Viridis',
        showscale=True,
        colorbar=dict(title="Height")
    ),
    name='Curve A'
))
fig.show()
トラブルシュート
| 症状 | 原因・対策 |
|---|---|
| 曲線同士が重なって見えない | 色・太さ・ dash スタイルの調整 |
| 開始/終了点が分からない | マーカー(circle・cross)で補助 |
| 曲線が歪む |
aspectmode='data' でデータ比率を維持 |
| 描画が重い | 点数を 200 → 100 に削減 |
| カラーバーが表示されない |
showscale=True を指定 |
まとめ
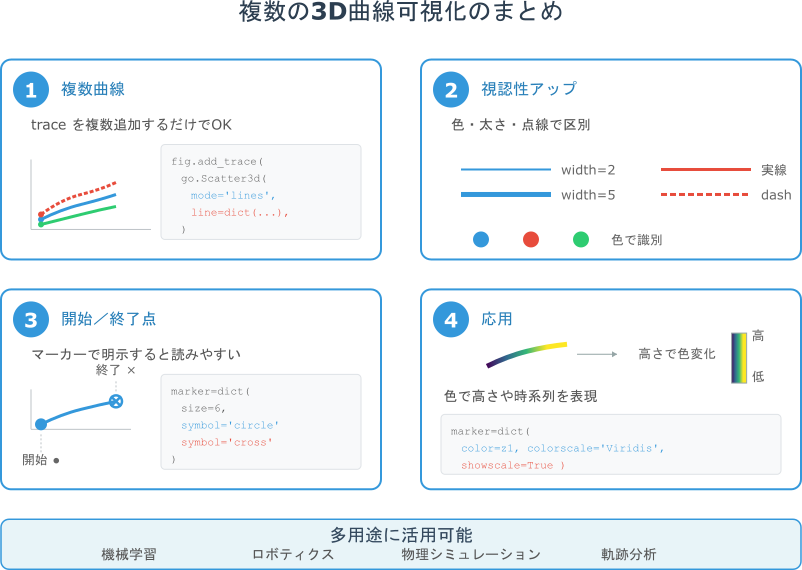
複数の3D曲線は、trace を追加していくだけで簡単に重ね描きできます。
色や太さ、点線などで区別すると視認性が上がり、開始点・終了点をマーカーで示すとさらに読みやすくなります。
高さや時系列を色で表現するなど応用範囲も広く、軌跡の比較が必要な機械学習・ロボティクス・物理シミュレーションで特に有効です。
参考情報