目的
Bリーグの試合結果から得失点のヒートマップを作成します

実装
データ取得
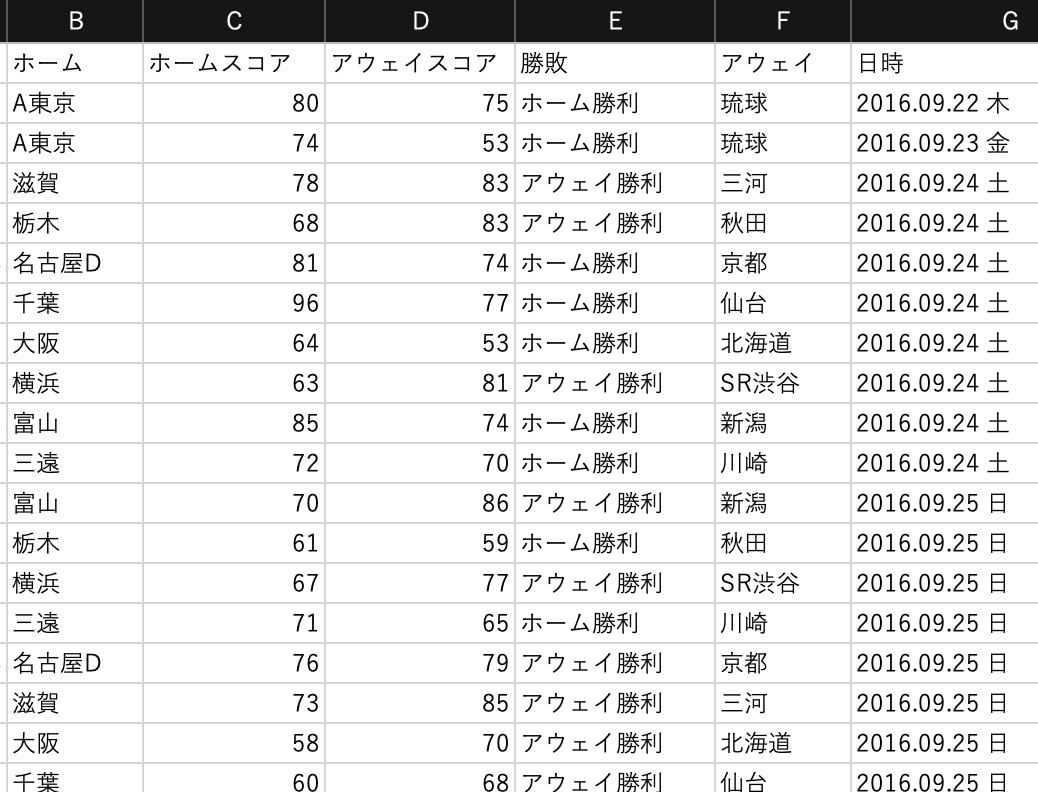
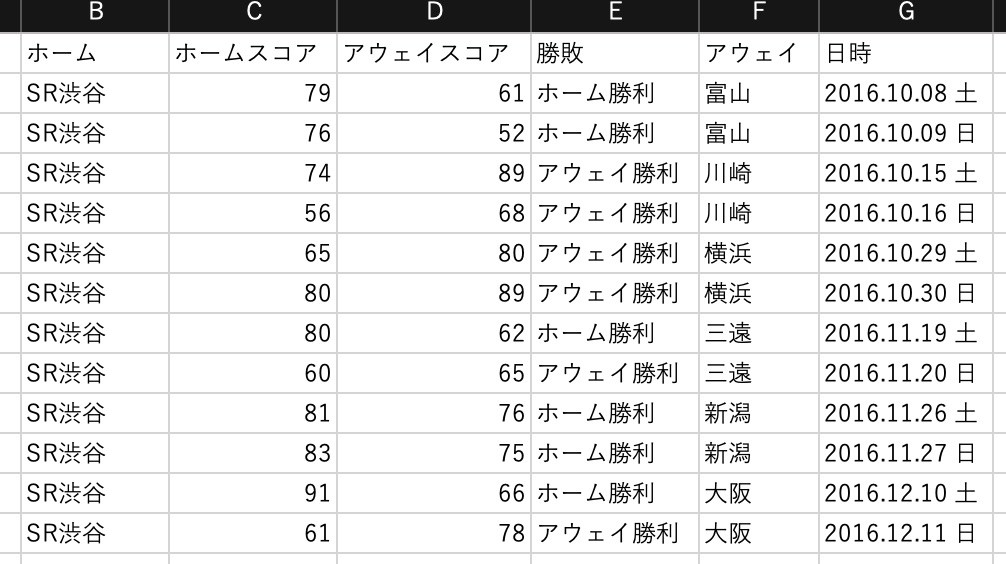
こちらのサイトからBリーグの試合結果を取得します
https://www.bleague.jp/schedule/?s=1&tab=1&year=2019&event=2&club=&setuFrom=1
取得はPythonのSeleniumを使用します
取得結果はpandas.DataFrameにまとめます
結果

整形
得点頒布のラベル付け
バスケはサッカーや野球と比較すると得点の幅が広いため、10点区切りの頒布表を作成します
こちらの記事を参考に得点の階級カラムを追加します
https://qiita.com/kshigeru/items/bfa8c11d1e6487c791d3
labels = [ "{0} - {1}".format(i, i + 9) for i in range(40, 200, 10) ]
df['ホームスコア頒布'] = pd.cut(df['ホームスコア'], np.arange(40, 201, 10), labels=labels)
df['アウェイスコア頒布'] = pd.cut(df['アウェイスコア'], np.arange(40, 201, 10), labels=labels)
40〜200点までを10点区切りでラベル付けを行います
範囲外のものにはNaNがセットされます
結果

ホーム/アウェイごとにグルーピング
ホームの戦績とアウェイの戦績は差が出ることが予想できるので、
ホーム戦のヒートマップ、アウェイ戦のヒートマップ、全戦のヒートマップを作成します
for team in teamList:
    teamHomeDf = df.query('ホーム == @team')
    teamAweyDf = df.query('アウェイ == @team')
    teamDf = pd.concat([teamHomeDf, teamAweyDf])
teamListには全チームのチーム名が格納されています
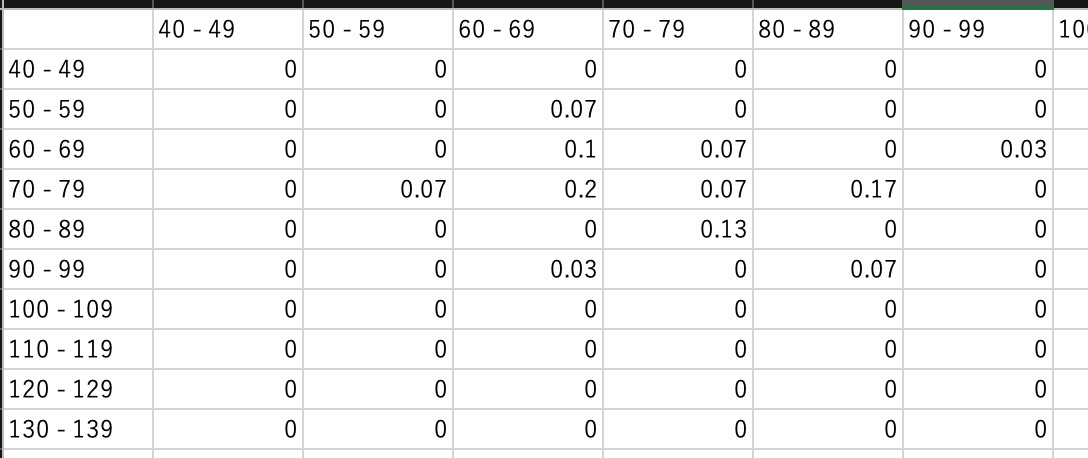
結果

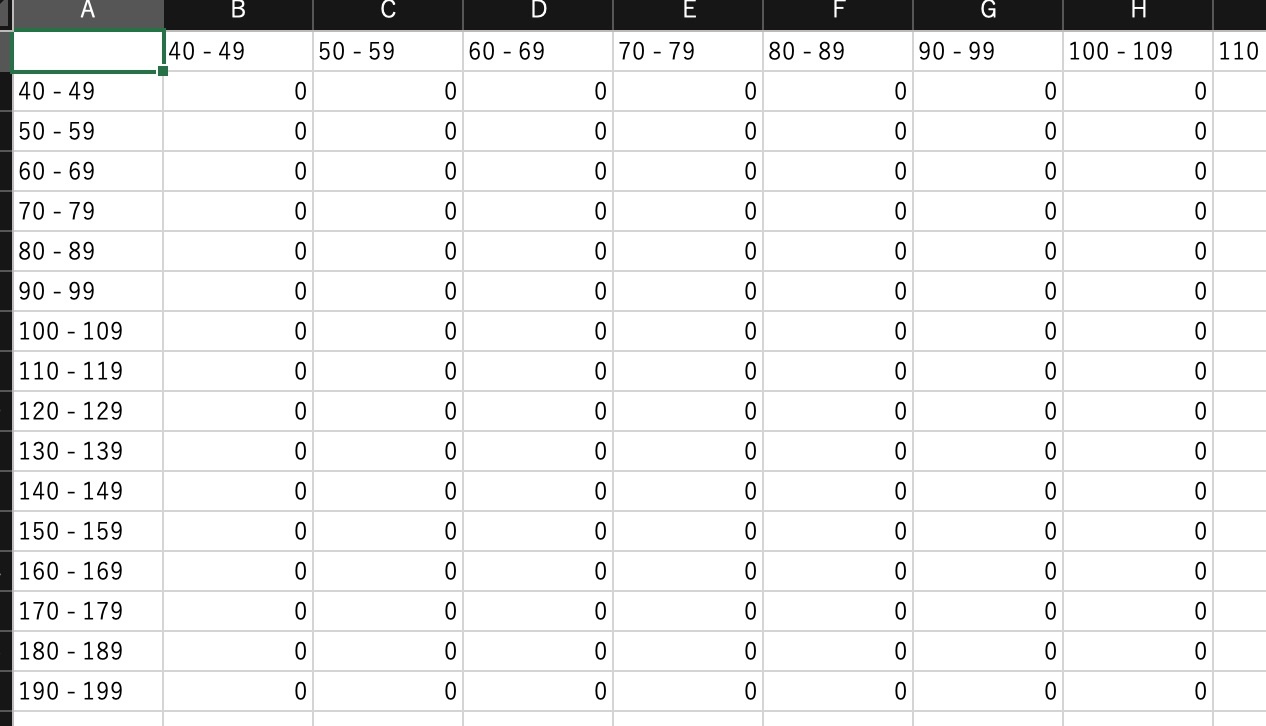
ヒートマップ用のデータ作成
distributionDf = teamHomeDf.groupby(['ホームスコア頒布', 'アウェイスコア頒布'])
distributionDf = distributionDf.size().unstack()
distributionDf = distributionDf.fillna(0)

cols = distributionDf.columns
indexs = distributionDf.index

for index in indexs:
	for col in cols:
		allDf.at[index, col] = round(distributionDf.at[index, col] / total, 2)

plt.figure(figsize=(8, 8))
sns.heatmap(allDf, annot = True, cmap = color, vmin = 0, square = True)
if not os.path.exists(path):
	os.makedirs(path)
plt.savefig(path + '/' + fileNm)
plt.close('all')
出力
整形したデータをもとにヒートマップを出力します
ヒートマップについてはこちら
https://note.nkmk.me/python-seaborn-heatmap/
https://matplotlib.org/tutorials/colors/colormaps.html
plt.figure(figsize=(8, 8))
sns.heatmap(allDf, annot = True, cmap = 'hot', vmin = 0, square = True)
if not os.path.exists(path):
	os.makedirs(path)
plt.savefig(path + '/' + fileNm)
plt.close('all')
出力されたヒートマップ


