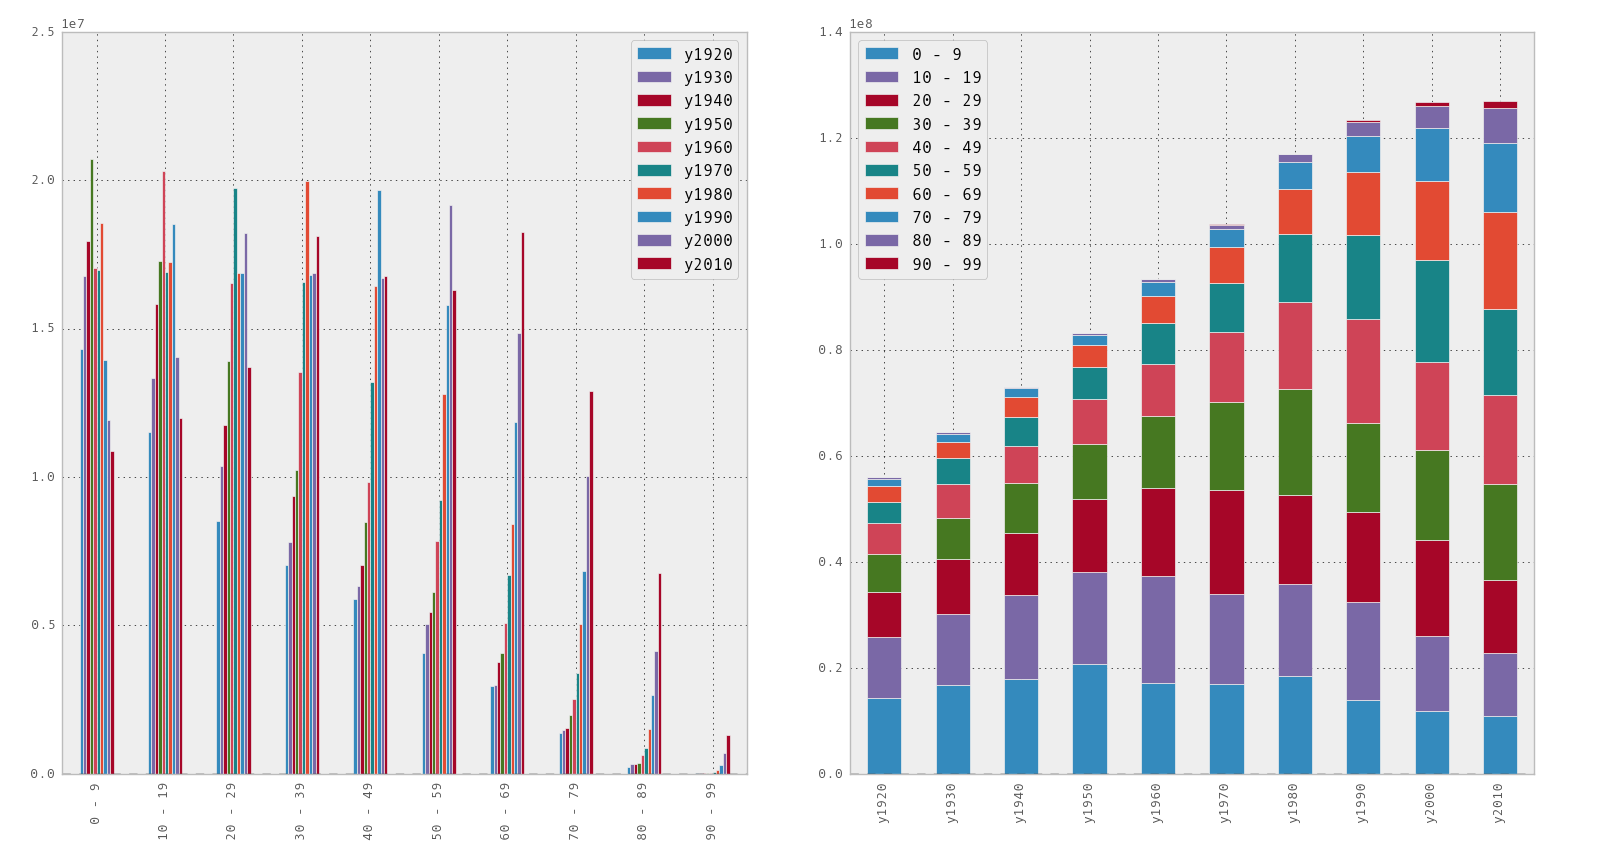
1歳ごとに集計された値を10歳ごとにまとめます。
pandas の cut で階級を設定し、groupby で集計します。
- pandas.cut — pandas 0.15.1 documentation
- pandas.DataFrame.groupby — pandas 0.15.1 documentation
- Group By: split-apply-combine — pandas 0.15.1 documentation
データは総務省統計局が公開している「年齢別人口」のエクセルをCSV形式にしたものを使います。
- 統計局ホームページ/第六十四回日本統計年鑑 平成27年-第2章 人口・世帯
- → 2 - 7 年齢別人口(エクセル:42KB)
扱いを簡単にするために、データ上部の説明行と、下部の注意書きおよび「100歳以上」と「不詳」の行を削除しておきます。調整したファイルは population-by-age.csv とします。
pandas で処理
まずは numpy と pandas のモジュールを読み込みます。
IPython でグラフを描画する設定も追加しておきます。
import numpy as np
import pandas as pd
import matplotlib.pyplot as plt
pd.options.display.mpl_style = 'default'
CSVファイルを読み込みます。1列目をインデックスに指定します。
読み込んだらデータ型を確認しておきます。
df = pd.read_csv('population-by-age.csv', index_col='age')
print df.dtypes
y1920    int64
y1930    int64
y1940    int64
y1950    int64
y1960    int64
y1970    int64
y1980    int64
y1990    int64
y2000    int64
y2010    int64
dtype: object
その他に、先頭と末尾、統計量を確認しておきましょう。表示は省略します。
print df.head(3)
print df.tail(3)
print df.describe()
cut を使って階級を設定します。
階級幅を変更したい場合は range の第3引数を調整してください。階級の両端を含む・含まないはオプションで指定します。 include_lowest と right オプションを適宜切り替えてください。
labels は表示用の文字列を設定します。数学的な閉区間・開区間の表現の方が分かりやすい場合は未指定で構いません。
labels = [ "{0} - {1}".format(i, i + 9) for i in range(0, 100, 10) ]
c = pd.cut(df.index, np.arange(0, 101, 10),
           include_lowest=True, right=False,
           labels=labels)

print df.groupby(c).sum()
            y1920     y1930     y1940     y1950     y1960     y1970     y1980
0 - 9    14314635  16778220  17961607  20728122  17049068  16965066  18547450
10 - 19  11520624  13340649  15816378  17267585  20326076  16921989  17231873
20 - 29   8533259  10367140  11756837  13910662  16527810  19749434  16882381
30 - 39   7020188   7798498   9370143  10250310  13555835  16578939  19973312
40 - 49   5902331   6332741   7041270   8487529   9835689  13217564  16427887
50 - 59   4074855   5046797   5446760   6137697   7842597   9230197  12813527
60 - 69   2968342   2977915   3782574   4074610   5092019   6709761   8429928
70 - 79   1378630   1478319   1541314   1967261   2518482   3401952   5059662
80 - 89    236419    315624    338472    354836    638738    879221   1503633
90 - 99     13657     13997     18567     16258     32043     65629    118391

            y1990     y2000     y2010
0 - 9    13959454  11925887  10882409
10 - 19  18533872  14034777  11984392
20 - 29  16870834  18211769  13720134
30 - 39  16791465  16891475  18127846
40 - 49  19676302  16716227  16774981
50 - 59  15813274  19176162  16308233
60 - 69  11848590  14841772  18247422
70 - 79   6835747  10051176  12904315
80 - 89   2665908   4147012   6768852
90 - 99    286141    688769   1318463
ということで、1歳ごとに集計された値を10歳ごとに集計できました。
集計関数は sum 以外にも指定できますし、複数を指定することも可能です。
以下の結果を確認しておきましょう。
print df.groupby(c).agg(['count', 'min', 'max', 'mean', 'std'])
グラフ描画
上述の数字だけだと関係性が分かりにくいので、グラフにして数の概況を把握します。
描画するときの stacked オプションを比較するために並べて配置してみます。
fig, axes = plt.subplots(ncols=2)
df.groupby(c).sum().plot(kind='bar', ax=axes[0])
df.groupby(c).sum().T.plot(kind='bar', stacked=True, ax=axes[1])
10歳ごとに並べてみると、最近になるほどに60歳以上の人口が増えています。一方で、若年層の人口は減っていることが分かります。積み上げグラフにしてみると、1920年から2000年までは順調に人口が増加していますが、2010年にかけては減少していることが分かります。世代分布としても、グラフの棒の上部の比率が増えています。
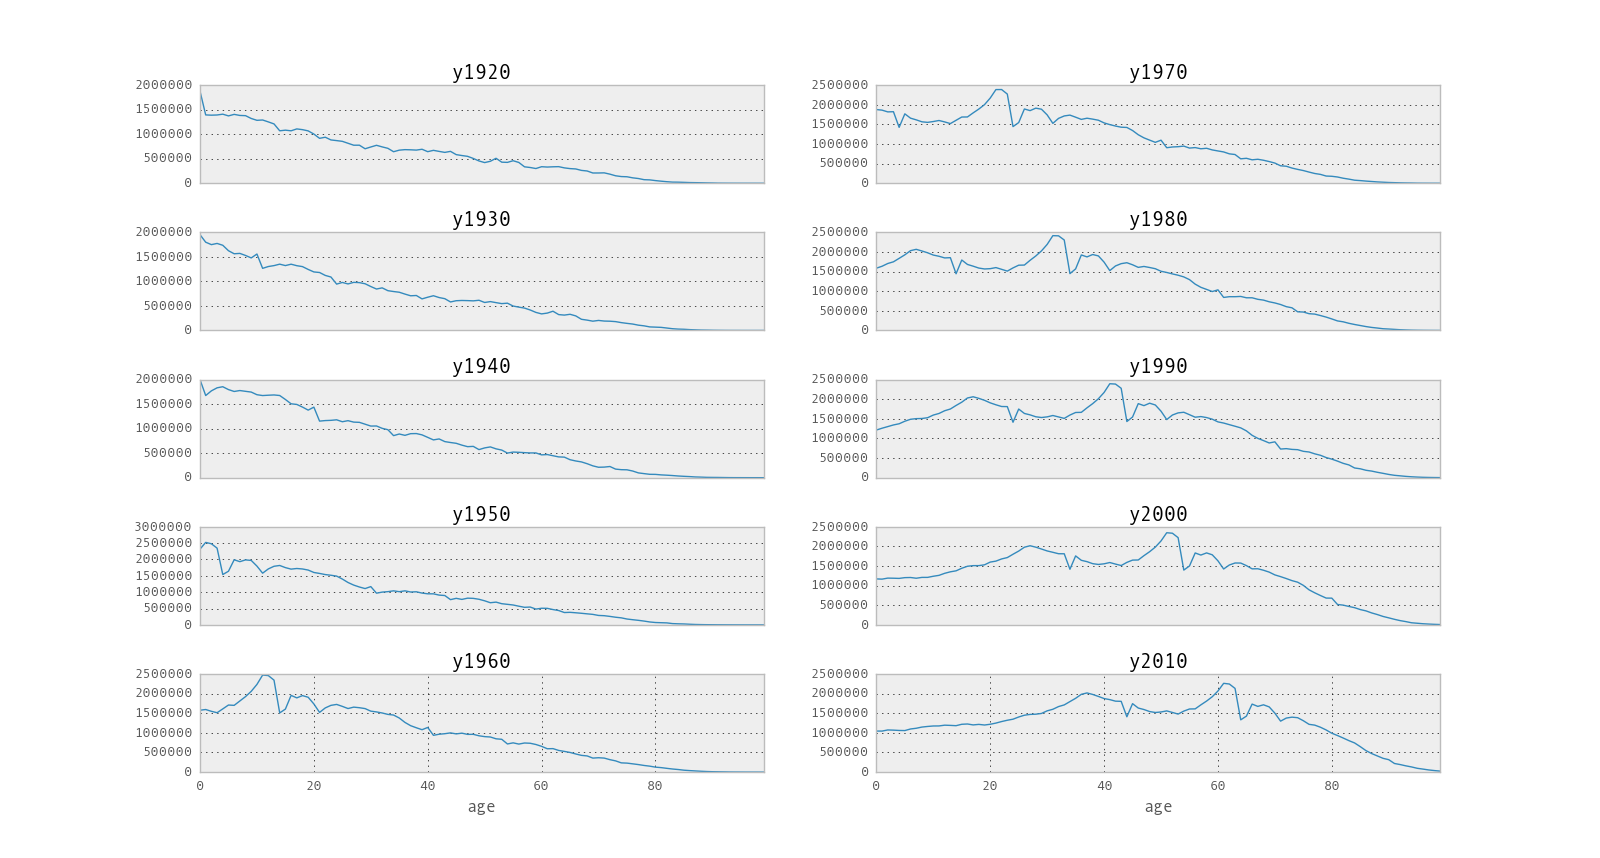
集計してだいたいの傾向は分かりましたので、元のデータフレームの各系列を描画します。単にプロットするとゴチャゴチャとしますので、それぞれの年ごとに別々のグラフとして描画してみます。今度は axes 変数は二次元になっていますので、配列インデックスを指定するときは注意しましょう。
fig, axes = plt.subplots(nrows=5, ncols=2)
for i, y in enumerate(['y1920', 'y1930', 'y1940', 'y1950', 'y1960']):
    df[y].plot(ax=axes[i, 0])
    axes[i, 0].set_title(y)
    if y != 'y1960':
        axes[i, 0].get_xaxis().set_visible(False)
for i, y in enumerate(['y1970', 'y1980', 'y1990', 'y2000', 'y2010']):
    df[y].plot(ax=axes[i, 1])
    axes[i, 1].set_title(y)
    if y != 'y2010':
        axes[i, 1].get_xaxis().set_visible(False)
個別のグラフを見てみると、ベビーブームの影響がよく分かります。また、第二次ベビーブーム以降は出生数が減っていることや、1970年以降は高齢者の裾野が広がっている(寿命が延びている)ことも見てとれますね。

