どうしても環状二本鎖DNAをキレイに描きたい
プレゼンの際、パワポに載せる図として環状二本鎖DNAのイラストが欲しい時がある。せっかくなのでPythonで描いてみる。
major groove と minor grooveを区別して描く

circular_dsDNA_groove.py
# !/usr/bin/env python3

import math
import matplotlib.pyplot as plt

zigzag_num=24
zigzag_size=0.075
lw=1

fig=plt.figure(figsize=(5,5))
ax=fig.add_subplot(111)

# DNA1本目
x=[]
y=[]
for theta in range(3600):
    theta=theta/10
    i=math.sin(math.radians(theta * zigzag_num))
    mag= 1 + (zigzag_size * i)
    x.append(math.sin(math.radians(theta)) * mag)
    y.append(math.cos(math.radians(theta)) * mag)
ax.plot(x, y, color='k', linewidth=lw)

# DNA2本目
x=[]
y=[]
for theta in range(3600):
    theta=theta/10
    i=math.cos(math.radians(theta * zigzag_num))
    mag= 1 + (zigzag_size * i)
    x.append(math.sin(math.radians(theta)) * mag)
    y.append(math.cos(math.radians(theta)) * mag)
ax.plot(x, y, color='gray', linewidth=lw)

plt.savefig('plot_out.png', transparent=True)
major groove と minor grooveは描きたくない場合

circular_dsDNA.py
# !/usr/bin/env python3

import math
import matplotlib.pyplot as plt

zigzag_num=24
zigzag_size=0.075
lw=1

fig=plt.figure(figsize=(5,5))
ax=fig.add_subplot(111)

# DNA1本目
x=[]
y=[]
for theta in range(3600):
    theta=theta/10
    i=math.sin(math.radians(theta * zigzag_num))
    mag= 1 + (zigzag_size * i)
    x.append(math.sin(math.radians(theta)) * mag)
    y.append(math.cos(math.radians(theta)) * mag)
ax.plot(x, y, color='k', linewidth=lw)

# DNA2本目
x=[]
y=[]
for theta in range(3600):
    theta=theta/10
    i=math.sin(math.radians(theta * zigzag_num))
    mag= 1 - (zigzag_size * i)
    x.append(math.sin(math.radians(theta)) * mag)
    y.append(math.cos(math.radians(theta)) * mag)
ax.plot(x, y, color='gray', linewidth=lw)

plt.savefig('plot_out_circular.png', transparent=True)
ついでに線状二本鎖DNAもキレイに描きたい
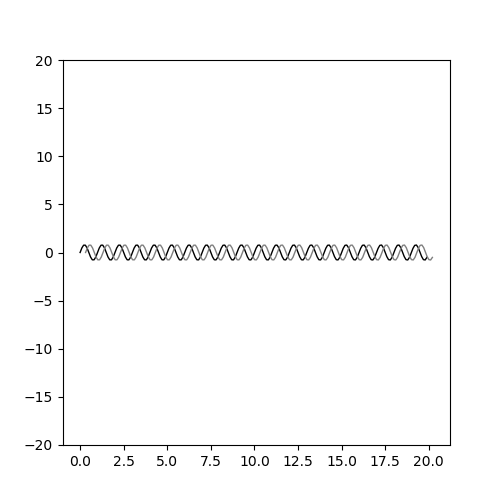
linear_dsDNA.py
# !/usr/bin/env python3

import math
import matplotlib.pyplot as plt

len=20
zigzag_size=0.8
lw=1

fig=plt.figure(figsize=(5,5))
ax=fig.add_subplot(111)

# DNA1本目
x=[]
y=[]
for i in range(10 * len):
    i=i/10
    x.append(i)
    y.append(math.sin(i*3.14*2) * zigzag_size)
ax.plot(x, y, color='k', linewidth=lw)

# DNA2本目
x=[]
y=[]
for i in range(10 * len):
    i=i/10
    x.append(i + 0.314)
    y.append(math.sin(i*3.14*2) * zigzag_size)
ax.plot(x, y, color='gray', linewidth=lw)

ax.set_ylim(-len, len)
plt.savefig('plot_out_linear.png', transparent=True)
環境
Ubuntu 18.04
Python 3.7.3
matplotlib 3.1.0