Why not login to Qiita and try out its useful features?

We'll deliver articles that match you.

You can read useful information later.

0
1

Delete article

Deleted articles cannot be recovered.

Draft of this article would be also deleted.

Are you sure you want to delete this article?

More than 3 years have passed since last update.

python (numpy)でsinwaveを生成してmatplotlibで表示する

Last updated at Posted at 2021-04-04

実装したアルゴリズムを手っ取り早く試すときに、サイン波が重宝することがある。

長さ200、周期4のサイン波を生成を生成する


import numpy as np
import pandas as pd

n=200
x = np.linspace(0, 4*np.pi, n)

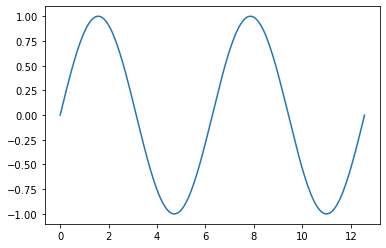
プロットしてみる。。。


s = pd.Series(np.sin(x), index=x)
s.plot()

ダウンロード (11).png

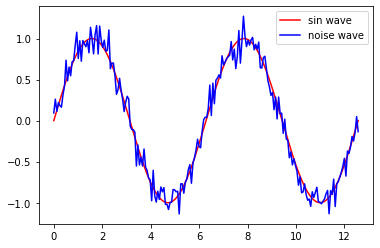
このサイン波に、ノイズを追加する。


snoise = s + 0.1 * np.random.randn(n)
sdf = pd.DataFrame({'sin wave':s, 'noise wave': snoise})
sdf.plot(color=('r', 'b'))

ダウンロード (14).png


from matplotlib import pyplot as plt
plt.plot(snoise)
ダウンロード (13).png

0
1
0

Register as a new user and use Qiita more conveniently

  1. You get articles that match your needs
  2. You can efficiently read back useful information
  3. You can use dark theme
What you can do with signing up
0
1

Delete article

Deleted articles cannot be recovered.

Draft of this article would be also deleted.

Are you sure you want to delete this article?