Introduction
In the previous post, I talked about showing icons on a web report.
The icons were displayed in a column next to the related numbers column.
I would like to show to display the number and icon together in a column this time.

Base Query
Let's create a new report with Sharperlight publisher.
I had the report created before so make a clone of it this time.
Choose the existing report, right-click to show the popup menu and select Clone, once Sharperlight publisher is open.
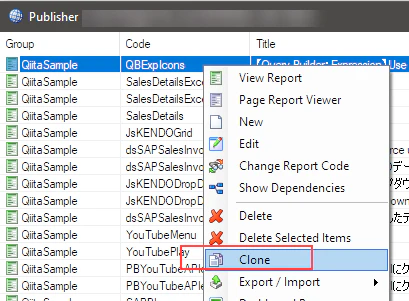
It would create a clone of it with '2' at the end of its code.

Editing
Open the clone and go for its query definition, and let's start modifing the existing expression.
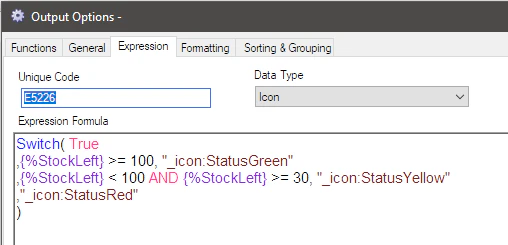
The number and icon need to be together in a cell so I use HTML Table tag this time.
The expression can be like this and don't forget the Data Type property should be HTML.
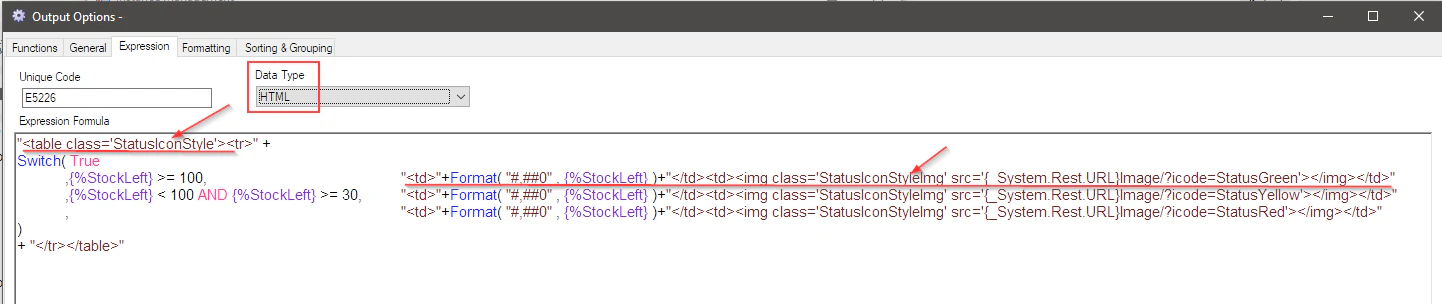
"<table class='StatusIconStyle'><tr>" +
Switch( True
,{%StockLeft} >= 100,"<td>"+Format( "#,##0" , {%StockLeft} )+"</td><td><img class='StatusIconStyleImg' src='{_System.Rest.URL}Image/?icode=StatusGreen'></img></td>"
,{%StockLeft} < 100 AND {%StockLeft} >= 30,	"<td>"+Format( "#,##0" , {%StockLeft} )+"</td><td><img class='StatusIconStyleImg' src='{_System.Rest.URL}Image/?icode=StatusYellow'></img></td>"
,"<td>"+Format( "#,##0" , {%StockLeft} )+"</td><td><img class='StatusIconStyleImg' src='{_System.Rest.URL}Image/?icode=StatusRed'></img></td>"
)
+ "</tr></table>"
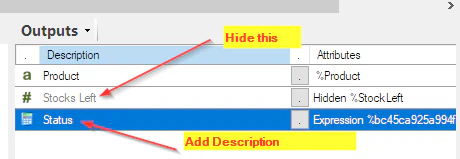
Stocks Left can be hidden as its value is now displayed with the icon, also add description to the expression.
Preview
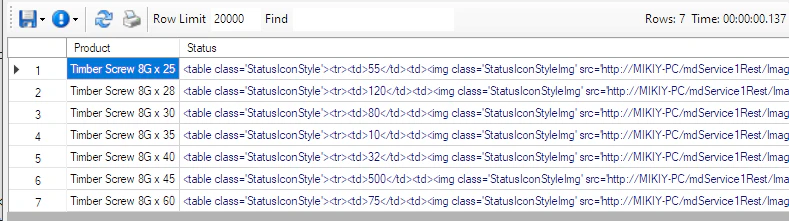
We can now preview it with Preview button. Preview doesn't show icons this time and display HTML table tags.
CSS
The HTML table tag and img tag each have a class.
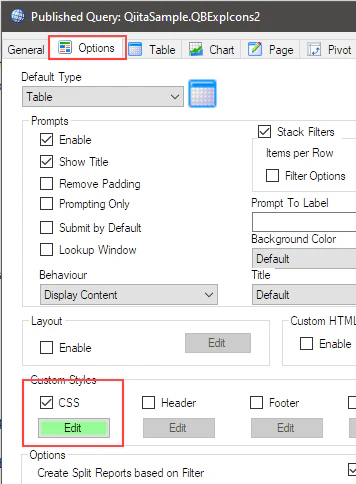
Let's define the classes to CSS option of the report.
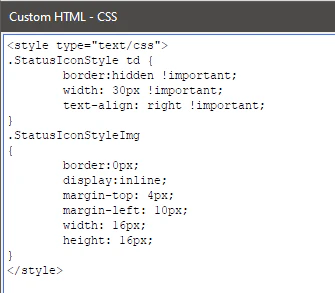
<style type="text/css">
.StatusIconStyle td {
	border:hidden !important;
	width: 30px !important;
	text-align: right !important;
}
.StatusIconStyleImg
{
	border:0px;
	display:inline;
	margin-top: 4px;
	margin-left: 10px;
    	width: 16px;
    	height: 16px;
}
</style>
Publishing the report
Save the query and save the web report.
Start Sharperlight service.
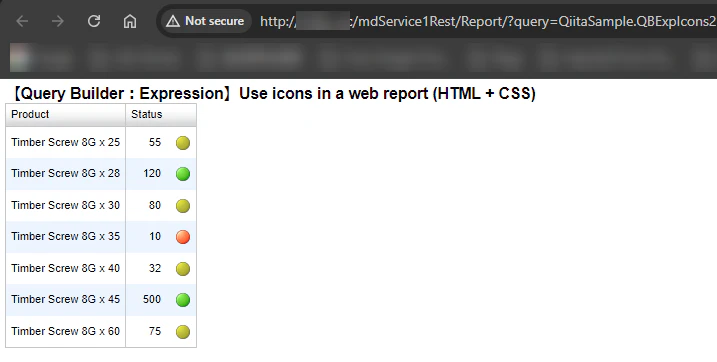
View the web report in your browser.
We shoud see the web report like this.
Conclusion
There are many Sharperlight expressions and we can create more attractive web reports with them.