Introduction
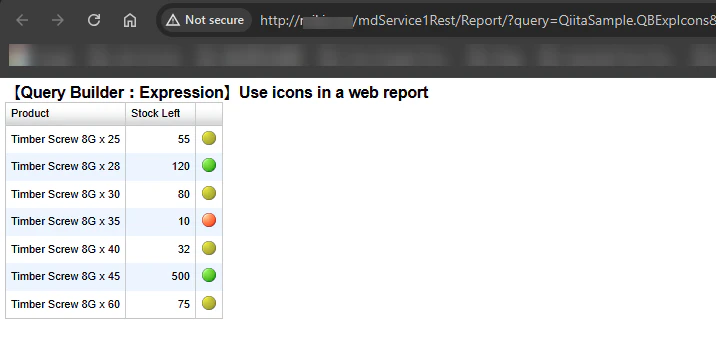
I would like to talk about showing icon on a web report with Sharperlight expression.
Depending on the number, different color icons are displayed.
Base Query
Let's create a web report with Sharperlight publisher, and design a query like this.
This should be a simple dataset so I used "Custom Defined Dataset" option to prepare a dataset.
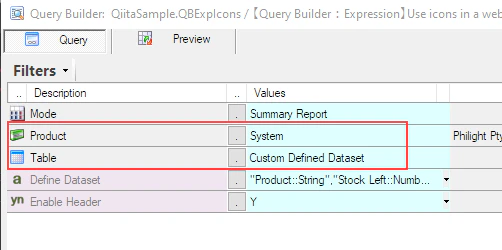
The dataset is like this.
"Product::String","Stock Left::Number"
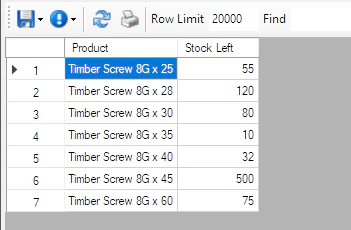
"Timber Screw 8G x 25",55
"Timber Screw 8G x 28",120
"Timber Screw 8G x 30",80
"Timber Screw 8G x 35",10
"Timber Screw 8G x 40",32
"Timber Screw 8G x 45",500
"Timber Screw 8G x 60",75
With preview
On a browser
Expression
Template
We add a Sharperlight expression, and use a built in template.
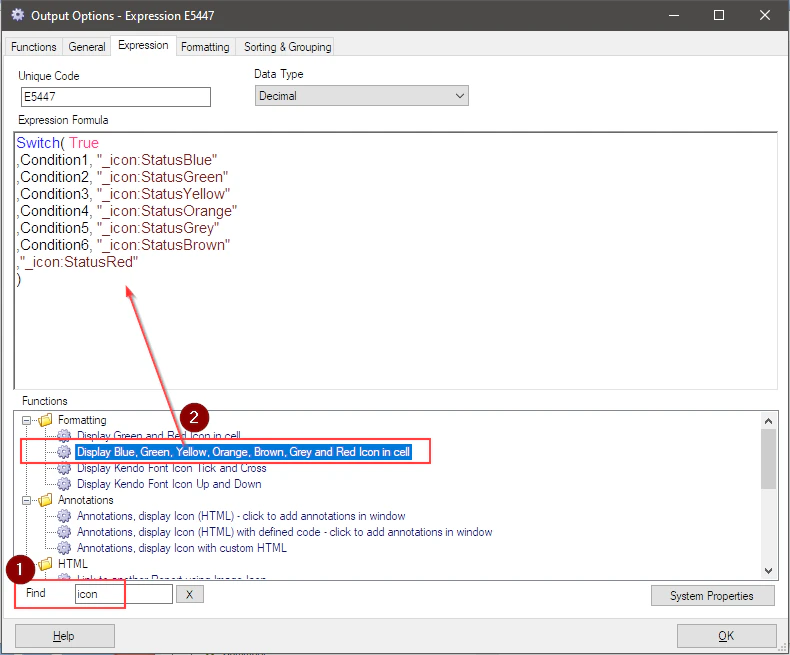
- Type icon into
Findfield to find the expression template - Double-click to transfer the template found to the editor
Editing
Let's start modifing the template.
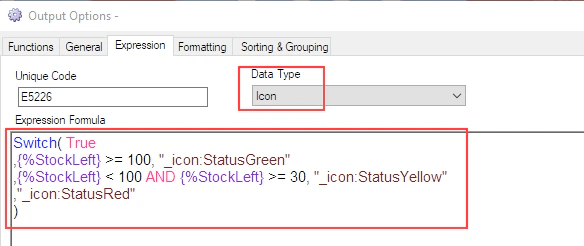
We do when Stocks Left is 100 or greater than 100, showing Grenn icon, when it is between 30 or greater then 30 and less than 100, showing Yellow icon, otherwise showing Red icon.
Don't forget to set Icon for Data Type property.
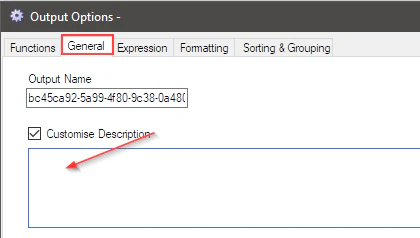
We don't need the column header for this so clear the value from the Description.
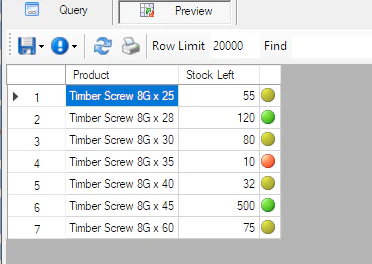
Preview
We can now preview it with Preview button.
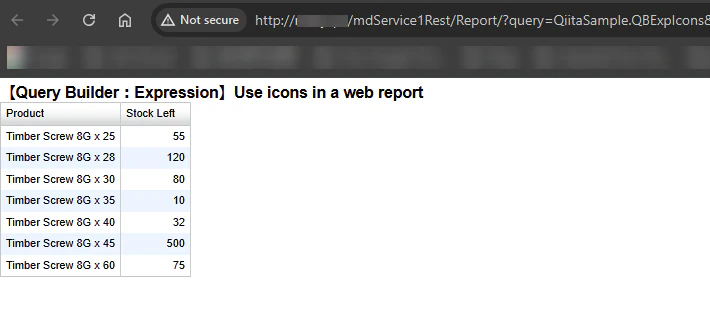
Publishing the report
Save the query and save the web report.
Start Sharperlight service.
View the web report in your browser.
We shoud see the web report like this.

Conclusion
There are many Sharperlight expressions and we can create more attractive web reports with them.