マテリアルズインフォマティクスを進める上で必要なのが、大規模なデータベースです。我々の分野でも、主に計算データを集めたMaterialsProjectやTEdesignLab、実験データを集めたUCSBデータベースやAtomWorkなど様々なデータベースがすでに存在しています。計算データは自動化ができることから、比較的容易に大規模なデータを集めることができています。ところが、実験データのほとんどは、各研究機関や企業のパソコンや装置の中に存在しています。たとえその実験データが公開されることになったとしても、論文の中のグラフ画像としてのみです(最近はデータもあげるように求める論文誌も出てきていますが)。
そこで、我々のグループでは、手始めとしてすでに公開されている論文内のプロット画像から容易に抽出、管理、共有できるプラットフォームを開発し、実験値プロットの大規模データベースを構築しました。また、我々のプラットフォームは、Scopusの論文検索機能やMendelayのような論文管理機能も兼ね備えているため、論文の整理だけをしたいユーザーも歓迎しています(基本的にはGeneralDBで試してください)。
本ページでは、我々のプラットフォームが用意しているAPIを利用して、どんなデータが取れるのかを中心に紹介します。
ライブラリの読み込み
StarrydataのAPIは、JSON形式で出力されるため、JSONファイルの取得、エンコードができるライブラリを読み込んでおきます。後述しますが、APIで返ってくるJOSN内の構造はRDBライクな形で返ってくるため、pandasに入れ込むことを推奨しています。ですので、pandasも読み込んでおきます。
import urllib.request
import json
import pandas as pd
import tqdm
データの取得
前知識(データベースの構造)
我々のデータベースの構造は、「どの論文のどの図にあるどの試料がどういうデータを持っているか」がわかるように、データとメタデータが全て紐づいています。そして、各論文、各図、各試料にそれぞれユニークなIDを振っています。このような構造をとっているのは、データ処理の時にあらゆる条件でフィルタリングするためや、データの出典元を明確にするためです。ですので、データを利用される方は、出典元も意識してお使いください。
現時点でのAPIは、以下の3つの検索スタイルを用意しています。
- IDによる検索
- 含有元素による検索
- メタデータ単一検索
以下では、順を追って説明していきます。
IDによる検索
我々のデータベースでは、おおよそ以下のようなデータベースの構造になっている。この構造を頭に入れておくと本APIを利用しやすくなる。
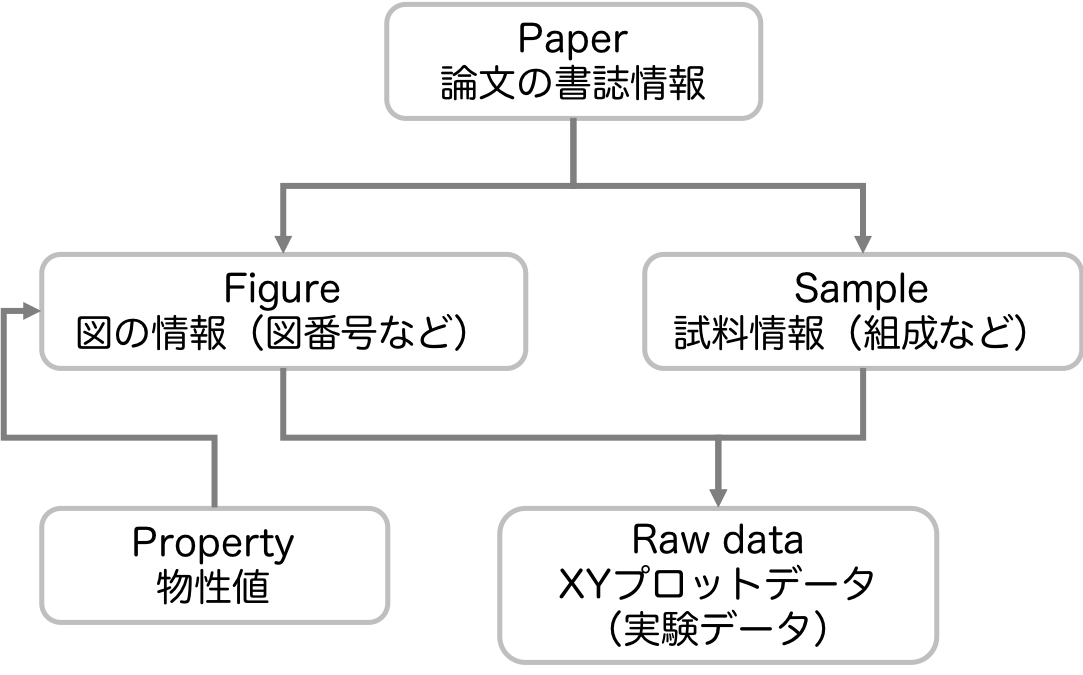
それぞれのテーブルには、インクリメント型のIDを持たせている(PaperidやFigureidなど)。そのIDを指定して、それに紐付く全てのデータを取得するAPIが本節の内容です。例えば、"/api/paper/:paperid(asid)"の場合、paperidに一致する全ての図、全てのサンプル、またそれらに紐付くプロットデータが取得できます。返ってくるデータは、RDBライクなJSONファイルであるため、それぞれのテーブルの情報をPandasに入れ直してからデータ処理を行うことを推奨してます。
reporturl = 'https://www.starrydata2.org/api/paper/2'
reportresponse = urllib.request.urlopen(reporturl) #responce={"paperid":[1,2,3,...], "figureid":[1,2,3,...], "sampleid":[1,2,3,...]}
report_dict_all = json.loads(reportresponse.read().decode('utf8'))
df_rawdata=pd.DataFrame(report_dict_all["rawdata"])
df_paper=pd.DataFrame(report_dict_all["paper"])
df_figure=pd.DataFrame(report_dict_all["figure"])
df_sample=pd.DataFrame(report_dict_all["sample"])
df_property=pd.DataFrame(report_dict_all["property"])
print(df_paper["title"].values[0].strip())
↓↓↓↓↓↓↓↓結果↓↓↓↓↓↓↓↓
Promising Thermoelectric Properties of Commercial PEDOT:PSS Materials and Their Bi2Te3Powder Composites
その他にも、"/api/figure/:figureid"の場合、figureidに一致する1つの図、その図が載った論文情報、その図に存在する全てのサンプル、またそれらに紐付くプロットデータが取得できます。返ってくるJSONの構造は、paperやfigure、sampleの場合でも同じです。
reporturl = 'https://www.starrydata2.org/api/figure/10'
reportresponse = urllib.request.urlopen(reporturl) #responce={"paperid":[1,2,3,...], "figureid":[1,2,3,...], "sampleid":[1,2,3,...]}
report_dict_all = json.loads(reportresponse.read().decode('utf8'))
df_rawdata=pd.DataFrame(report_dict_all["rawdata"])
df_paper=pd.DataFrame(report_dict_all["paper"])
df_figure=pd.DataFrame(report_dict_all["figure"])
df_sample=pd.DataFrame(report_dict_all["sample"])
df_property=pd.DataFrame(report_dict_all["property"])
print(df_sample["composition"].values[0].strip())
↓↓↓↓↓↓↓↓結果↓↓↓↓↓↓↓↓
Pb1.001Te1I0.002
Sampleの場合も同様で、"/api/sample/:sampleid"の場合、sampleidに一致する1つの試料、その試料が載った1つ以上の図の情報、その試料が載った論文、またそれらに紐付くプロットデータが取得できます。
reporturl = 'https://www.starrydata2.org/api/sample/1'
reportresponse = urllib.request.urlopen(reporturl) #responce={"paperid":[1,2,3,...], "figureid":[1,2,3,...], "sampleid":[1,2,3,...]}
report_dict_all = json.loads(reportresponse.read().decode('utf8'))
df_rawdata=pd.DataFrame(report_dict_all["rawdata"])
df_paper=pd.DataFrame(report_dict_all["paper"])
df_figure=pd.DataFrame(report_dict_all["figure"])
df_sample=pd.DataFrame(report_dict_all["sample"])
df_property=pd.DataFrame(report_dict_all["property"])
print(df_sample["composition"].values[0].strip())
↓↓↓↓↓↓↓↓結果↓↓↓↓↓↓↓↓
Pb1Te1I0.0006
含有元素による検索
Starrydataをすでに使用している人は、先ほどの「IDによる検索」をいきなり使用することができるかもしれないが、多くの場合いきなりIDを知っていることは考えにくいです。そのため、この含有元素による検索の方が便利だと思います。ここでは、"/api/search/search?atom=Pb,Te,or"のように指定します。末尾に",or"を指定すると、OR検索になり、",and"もしくはデフォルトはAND検索になっています。ここでは、PbかTeのいずれかに一致する全てのpaperid、figureid、sampleidのリストが返ってきます。1つ目のsearchをpaperやfigure、sampleに変えることで、それぞれのidのリストのみが返され、それ以外は空リストが返ってきます。以下の例では、AND検索で"Pb,Te,Ag"を検索しています。
url = 'https://www.starrydata2.org/api/search/search?atom=Pb,Te,Ag'
response = urllib.request.urlopen(url) #responce={"paperid":[1,2,3,...], "figureid":[1,2,3,...], "sampleid":[1,2,3,...]}
dict_all = json.loads(response.read().decode('utf8'))
paperid = dict_all["paperid"]
figureid = dict_all["figureid"]
sampleid = dict_all["sampleid"]
print(paperid)
print(figureid)
print(sampleid)
↓↓↓↓↓↓↓↓結果↓↓↓↓↓↓↓↓
[18585, 18588, 18583]
[1800, 1801, 1804, 1805, 1806, 1807, 1808, 1809, 1810, 1811, 1812, 1813, 1814, 1815, 1816, 1817, 1818, 1819, 1820, 1821, 1822, 1823, 1824, 1825, 1826, 1827, 1828, 1829, 1830, 1831, 1832, 1833, 1834, 1835, 1836, 1765, 1766, 1767, 1768]
[2738, 2767, 2706, 2739, 2740, 2741]
上記のAPIで、IDのリストが取得できますので、そのリストを利用し、For文を回すなどして"IDによる検索"を実行することで、指定した含有元素を含む全てのデータを取得することができます。ただし、注意すべき点は、sampleid以外のリストを使用した場合です。sampleidのリストを利用する場合は、以下の例のように、含有元素を含むデータのみを取得できます。
for i, samid in enumerate(sampleid):
    url = 'https://www.starrydata2.org/api/sample/'+str(samid)
    response = urllib.request.urlopen(url) #responce={"paperid":[1,2,3,...], "figureid":[1,2,3,...], "sampleid":[1,2,3,...]}
    dict_all = json.loads(response.read().decode('utf8'))
    if i == 0:
        df_paper = pd.DataFrame(dict_all["paper"])
        df_figure = pd.DataFrame(dict_all["figure"])
        df_sample = pd.DataFrame(dict_all["sample"])
        df_property = pd.DataFrame(dict_all["property"])
        df_rawdata = pd.DataFrame(dict_all["rawdata"])
    else:
        df_paper = pd.concat([df_paper,pd.DataFrame(dict_all["paper"])])
        df_figure = pd.concat([df_figure,pd.DataFrame(dict_all["figure"])])
        df_sample = pd.concat([df_sample,pd.DataFrame(dict_all["sample"])])
        df_property = pd.concat([df_property,pd.DataFrame(dict_all["property"])])
        df_rawdata = pd.concat([df_rawdata,pd.DataFrame(dict_all["rawdata"])])
print(list(map(str,set(df_sample["composition"].values))))
↓↓↓↓↓↓↓↓結果↓↓↓↓↓↓↓↓
['Pb0.407Te0.399Ag0.054O0.14', 'Pb0.97La0.03Te1.055Ag0.11', 'Pb0.409Te0.417Ag0.012O0.162', 'Pb0.374Te0.357Ag0.143O0.126', '\tPb0.381Te0.378Ag0.107O0.134', 'PbTe(Ag)']
しかし、sampleid以外のリストを使用した場合(例えば、figureidのリストの場合)、"Pb,Te,Ag"を含む図、に存在するデータが取得されます。つまり、"Pb,Te,Ag"の比較対象としてプロットされているデータも含めてデータを取得することになります。
for i, figid in enumerate(figureid):
    testurl = 'https://www.starrydata2.org/api/figure/'+str(figid)
    testresponse = urllib.request.urlopen(testurl) #responce={"paperid":[1,2,3,...], "figureid":[1,2,3,...], "sampleid":[1,2,3,...]}
    test_dict_all = json.loads(testresponse.read().decode('utf8'))
    if i == 0:
        test_df_paper = pd.DataFrame(test_dict_all["paper"])
        test_df_figure = pd.DataFrame(test_dict_all["figure"])
        test_df_sample = pd.DataFrame(test_dict_all["sample"])
        test_df_property = pd.DataFrame(test_dict_all["property"])
        test_df_rawdata = pd.DataFrame(test_dict_all["rawdata"])
    else:
        test_df_paper = pd.concat([df_paper,pd.DataFrame(test_dict_all["paper"])])
        test_df_figure = pd.concat([df_figure,pd.DataFrame(test_dict_all["figure"])])
        test_df_sample = pd.concat([df_sample,pd.DataFrame(test_dict_all["sample"])])
        test_df_property = pd.concat([df_property,pd.DataFrame(test_dict_all["property"])])
        test_df_rawdata = pd.concat([df_rawdata,pd.DataFrame(test_dict_all["rawdata"])])
print(list(map(str,set(test_df_sample["composition"].values))))
↓↓↓↓↓↓↓↓結果↓↓↓↓↓↓↓↓
['Pb0.407Te0.399Ag0.054O0.14', 'Pb0.97La0.03Te1.055Ag0.11', 'Pb0.409Te0.417Ag0.012O0.162', 'Pb0.374Te0.357Ag0.143O0.126', '\tPb0.381Te0.378Ag0.107O0.134', 'PbTe', 'PbTe(Ag)']
重複したデータが並んでしまうため、それぞれユニークなデータになるようにDataFrameを作り直します。また、concatの直後ではindexが順番に並んでいないため、インデックスの振り直しも行います。drop=Trueを設定しないと、新しい絡むとして以前のindexを保存してしまうので設定しておきます。
df_paper=df_paper.drop_duplicates(['sid']).reset_index(drop=True)
df_figure=df_figure.drop_duplicates(['figureid']).reset_index(drop=True)
df_sample=df_sample.drop_duplicates(['sampleid']).reset_index(drop=True)
df_rawdata=df_rawdata.reset_index(drop=True)
df_property=df_property.drop_duplicates(['propertyname', 'unit']).reset_index(drop=True)
メタデータ単一検索
また、ID検索の派生として用意しているAPIがこのメタデータ単一検索です。例えば、以下のように/api/paper/:paperid(sid)/titleとIDの次にメタデータを記載することで、そのデータのみを取得することができます。paperの場合、その他にもDOIやsid、authorなどを取得することができます。
url = 'https://www.starrydata2.org/api/paper/2/title'
response = urllib.request.urlopen(url) #responce={"paperid":[1,2,3,...], "figureid":[1,2,3,...], "sampleid":[1,2,3,...]}
output = json.loads(response.read().decode('utf8'))
output
↓↓↓↓↓↓↓↓結果↓↓↓↓↓↓↓↓
'Promising Thermoelectric Properties of Commercial PEDOT:PSS Materials and Their Bi2Te3Powder Composites'
sampleの場合も、compositionやsamplenameなどを取得することができます。figureも同様です。
url = 'https://www.starrydata2.org/api/sample/1/composition'
response = urllib.request.urlopen(url) #responce={"paperid":[1,2,3,...], "figureid":[1,2,3,...], "sampleid":[1,2,3,...]}
output = json.loads(response.read().decode('utf8'))
output
↓↓↓↓↓↓↓↓結果↓↓↓↓↓↓↓↓
'Pb1Te1I0.0006'
テーブルの結合
取得したデータは、RDBライクな構造をしているのでPandasを利用してそれぞれのテーブルをJoinします。
Paperテーブルとの結合
data = pd.merge(df_rawdata, df_paper, left_on='paperid', right_on='sid').drop("sid", axis=1).drop("paperid_x", axis=1).drop("propertyid_x", axis=1).drop("propertyid_y", axis=1)
Figureテーブルを結合
data = pd.merge(data, df_figure, on='figureid').drop("figureid", axis=1).drop("paperid", axis=1)
Propertyテーブルを結合
data = pd.merge(data, df_property, left_on='propertyid_x', right_on='propertyid').rename(columns={'propertyname': 'propertyname_x'})
data = pd.merge(data, df_property, left_on='propertyid_y', right_on='propertyid').rename(columns={'propertyname': 'propertyname_y'}).drop("propertyid_x", axis=1).drop("propertyid_y", axis=1)
Sampleテーブルを結合
data = pd.merge(data, df_sample, on='sampleid').drop("sampleid", axis=1)
テーブルのcsv保存
data.to_csv("data.csv")
データの可視化
今回は、検索したデータの中でも温度依存性のグラフを描いてみます。なので、xlabelには温度を設定し、x軸が温度のデータのみを抽出します。ylabelについては、図を描画する際にユニークな数でForを回すため取得しておきます。
xlabel = "Temperature"
xtemp = data[data["propertyname_x"] == xlabel]
ylabel = list(set(data["propertyname_y"]))
それでは、描画していきます。描画に関する詳しい設定内容については、以前まとめたページをご覧いただければと思います。以下に、私が美しいと思う図の初期設定をしましています。
import json
import numpy as np
import pandas as pd
import matplotlib
import matplotlib.pyplot as plt
import math
from sklearn.preprocessing import MinMaxScaler
mms = MinMaxScaler()
%matplotlib inline
plt.rcParams['font.size'] = 8
plt.rcParams['font.family']= 'sans-serif'
plt.rcParams['font.sans-serif'] = ['Arial']
plt.rcParams['text.usetex'] = False
plt.rcParams['text.latex.unicode'] = False
plt.rcParams['xtick.direction'] = 'in'
plt.rcParams['ytick.direction'] = 'in'
plt.rcParams['xtick.major.width'] = 1.2
plt.rcParams['ytick.major.width'] = 1.2
plt.rcParams['axes.linewidth'] = 1.2
plt.rcParams['axes.grid']=True
plt.rcParams['grid.linestyle']='--'
plt.rcParams['grid.linewidth'] = 0.3
plt.rcParams["legend.markerscale"] = 2
plt.rcParams["legend.fancybox"] = False
plt.rcParams["legend.framealpha"] = 1
plt.rcParams["legend.edgecolor"] = 'black'
以下が描画のコア部分です。figureの大きさや、配置についてはylabelの数に応じて自動的に変更される仕組みに指定しています。凡例も表示できるのですが、データ数が多いと図をはみ出してしまうため、ここではコメントアウトしています。
ynum = math.ceil(len(ylabel)/3)
fig = plt.figure(figsize=(13,ynum*4),dpi=300,facecolor='w',edgecolor='k')
plt.subplots_adjust(wspace=0.25, hspace=0.2)

for i, y in enumerate(ylabel):
    ax = fig.add_subplot(ynum,3,i+1)
    ax.ticklabel_format(style="sci", scilimits=(0,0), axis="y",useMathText=True)
    ax.xaxis.set_ticks_position('both')
    ax.yaxis.set_ticks_position('both')
    ax.set_xlabel(xlabel)
    ax.set_ylabel(ylabel[i])
    ax.grid(zorder=0)
    tmpdata = data[data["propertyname_y"]==y]
    samplelist = list(set(tmpdata["composition"]))
    ax.set_xlim(tmpdata["x"].min(),tmpdata["x"].max())
    ax.set_ylim(tmpdata["y"].min(),tmpdata["y"].max())

    for sam in samplelist:
        plotdata = tmpdata[tmpdata["composition"]==sam]
        ax.scatter(plotdata["x"], plotdata["y"], marker='o', linestyle='-',s=30,alpha = 0.8,lw=0,zorder=3,label=sam)
    #↓データが多い場合判例が収まらない
    ax.legend(loc='best',fontsize=8).get_frame().set_linewidth(0.3)
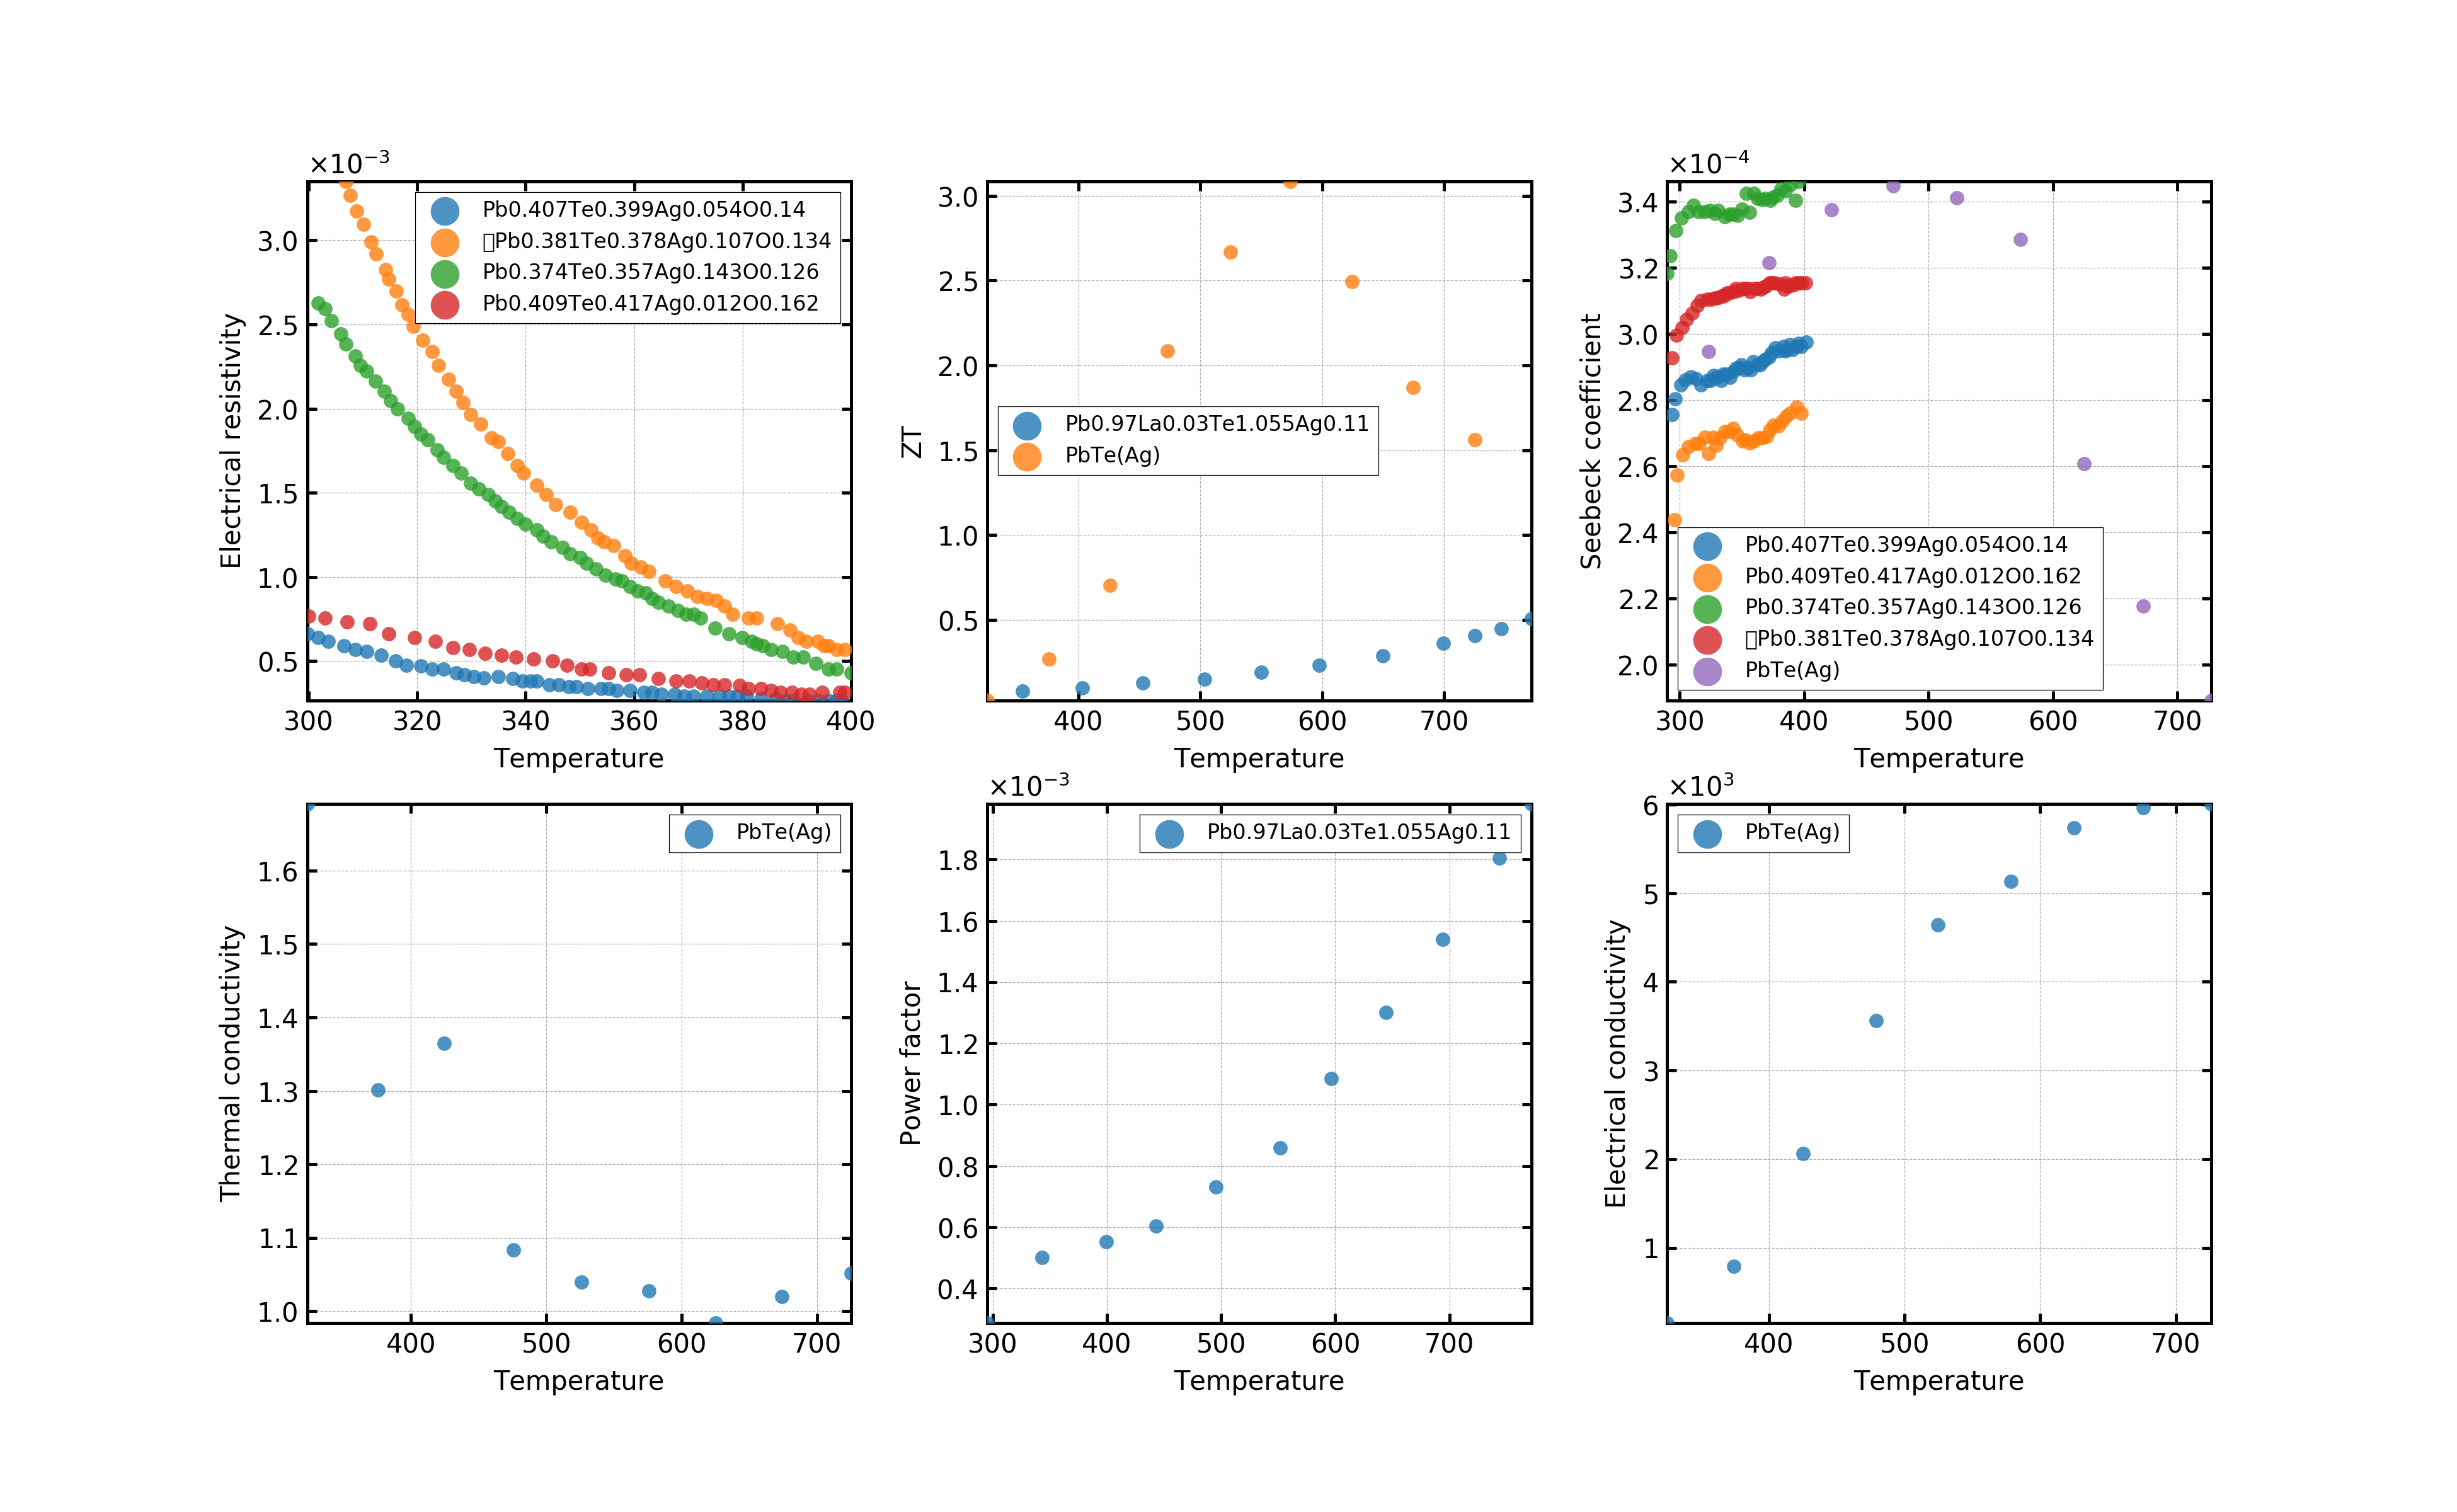
画像の保存
fig.savefig('starrydata_Pb-Te-Ag.png', dpi=300)
終わりに
データ数が多いときに凡例をどうするかとか、Pandasの部分が重くなることについてはもう少し対策をする必要があるかもしれません。
材料の組成のデータが取得できるので、その組成と材料系のライブラリPymatgenとを組み合わせるとメタデータを増やすこともできます。また、本データベースも実験方法などのメタデータを絶賛作成中です。
このデータを利用した機械学習なども進めていきたい。