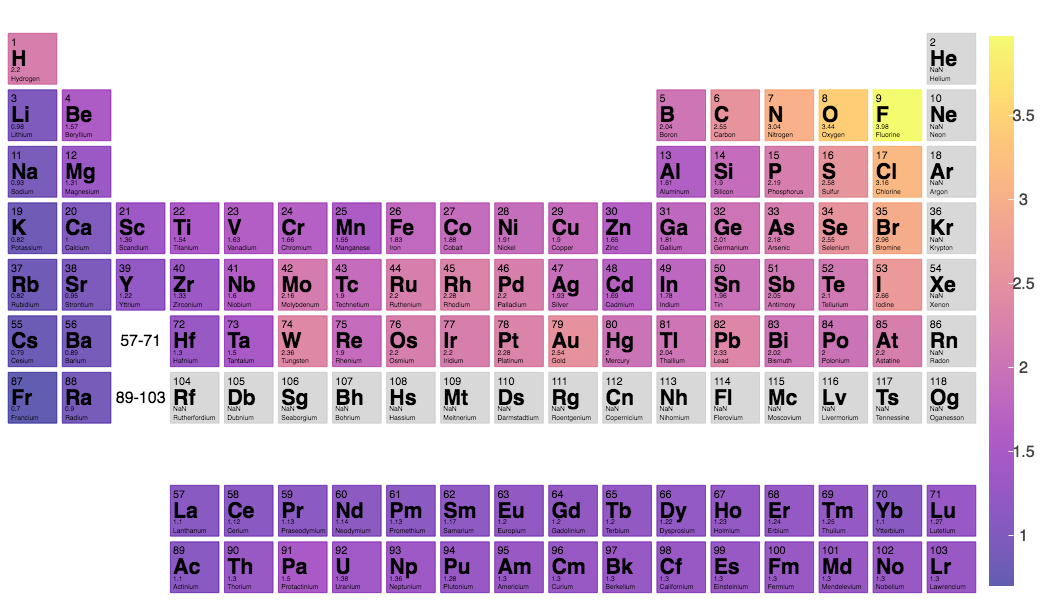
マテリアルズインフォマティクスを進めている中で、元素毎の特性を可視化して比較したくなりました。なので今回は、JupyterLab上で周期表を用いた傾向表示ができるサンプルコードを記しておきます。Pythonで周期表を描く場合、可視化ライブラリbokehを利用することになるかと思います。bokehで描かれる周期表は美しいので、論文や学会発表などにそのまま利用できそうです。
環境構築
jupyterlabのインストール
まずはjupyterlabのインストールを行います。現在の最新のバージョンは0.35.3でした。もしすでにインストールしている際には、使用しているjupyterlabのバージョン情報を確認しておいてください。jupyterlabのバージョンは、メニューバーにあるhelpの「About JupyterLab Beta」から簡単に確認できます。
conda install -c conda-forge jupyterlab
bokeh拡張のインストール
続いて、bokehをjupyterlab上で動作させるための拡張をインストールします。jupyterlabとのバージョンの整合性が取れていないと、インストールに失敗しますので、https://github.com/bokeh/jupyterlab_bokeh で確認して、インストールしてください。
jupyter labextension install jupyterlab_bokeh@0.6.3
実装
元素表の描画
早速、以下に周期表による傾向表示をするサンプルコードを示します。bokehには元素表表示が用意されていますが、それを用いて元素の傾向まで表示するようにしたコード(https://github.com/arosen93/ptable_trends )を挙げている方がおられました。今回はそれを参考にして、jupyterLab上でも表示するように微修正しました。
from __future__ import absolute_import
from bokeh.models import (ColumnDataSource, LinearColorMapper, LogColorMapper, ColorBar, BasicTicker)
from bokeh.plotting import figure
from bokeh.io import output_file, show
from bokeh.sampledata.periodic_table import elements
from bokeh.transform import dodge
from matplotlib.colors import Normalize, LogNorm, to_hex
from matplotlib.cm import plasma, inferno, magma, viridis, ScalarMappable
from pandas import options
import bokeh.plotting as bp
import numpy as np
import math
bp.output_notebook()
options.mode.chained_assignment = None

output_file('ptable_trends.html')

width = 1050
cmap_choice = 0
alpha = 0.65
log_scale = 0
cbar_height = 550
cbar_standoff =5
cbar_fontsize = 12

# 描画したいトレンドデータ選択(列選択)
label = "electronegativity"

if cmap_choice == 0:
    cmap = plasma
    bokeh_palette = 'Plasma256'
elif cmap_choice == 1:
    cmap = inferno
    bokeh_palette = 'Inferno256'
elif cmap_choice == 2:
    cmap = magma
    bokeh_palette = 'Magma256'
elif cmap_choice == 3:
    cmap = viridis
    bokeh_palette = 'Viridis256'

# 族および周期の定義
period_label = ['1', '2', '3', '4', '5', '6', '7']
group_range = [str(x) for x in range(1, 19)]

# データの取得
df = elements.copy()

data_elements = []
data = []
for idx, d in df.iterrows():
    if d[label] != "-" and not math.isnan(float(d[label])):
        data_elements.append(d["symbol"])
        data.append(float(d[label]))

period_label.append('blank')
period_label.append('La')
period_label.append('Ac')

count = 0
for i in range(56,71):
    df.period[i] = 'La'
    df.group[i] = str(count+4)
    count += 1

count = 0
for i in range(88,103):
    df.period[i] = 'Ac'
    df.group[i] = str(count+4)
    count += 1

# matplotlibとbokehのカラーマップの定義
if log_scale == 0:
    color_mapper = LinearColorMapper(palette = bokeh_palette, low=min(data),
        high=max(data))
    norm = Normalize(vmin = min(data), vmax = max(data))
elif log_scale == 1:
    for datum in data:
        if datum < 0:
            raise ValueError('Entry for element '+datum+' is negative but log-scale is selected')
    color_mapper = LogColorMapper(palette = bokeh_palette, low=min(data), high=max(data))
    norm = LogNorm(vmin = min(data), vmax = max(data))
color_scale = ScalarMappable(norm=norm, cmap=cmap).to_rgba(data,alpha=None)

# 空の場合のカラー定義
blank_color = '#c4c4c4'
color_list = []
for i in range(len(df)):
    color_list.append(blank_color)

# データが空でない場合の色設定
for i, data_element in enumerate(data_elements):
    element_entry = df.symbol[df.symbol.str.lower() == data_element.lower()]
    if element_entry.empty == False:
        element_index = element_entry.index[0]
    else:
        print('WARNING: Invalid chemical symbol: '+data_element)

    if color_list[element_index] != blank_color:
        print('WARNING: Multiple entries for element '+data_element)
    color_list[element_index] = to_hex(color_scale[i])

# データを可視化するための図の設定
source = ColumnDataSource(
    data=dict(
        group=[str(x) for x in df['group']],
        period=[str(y) for y in df['period']],
        sym=df['symbol'],
        atomic_number=df['atomic number'],
        name=df['name'],
        label=df[label],
        type_color=color_list
    )
)

# 周期表の描画
p = figure(x_range=group_range, y_range=list(reversed(period_label)), tools='save')
p.plot_width = width
p.outline_line_color = None
p.toolbar_location='above'
p.rect('group', 'period', 0.9, 0.9, source=source,alpha=alpha, color='type_color')
p.axis.visible = False
text_props = {
    'source': source,
    'angle': 0,
    'color': 'black',
    'text_align': 'left',
    'text_baseline': 'middle'
}
x = dodge("group", -0.4, range=p.x_range)
p.text(x=x, y='period', text='sym',text_font_style='bold', text_font_size='16pt', **text_props)
p.text(x=x, y=dodge("period", 0.3, range=p.y_range), text='atomic_number',text_font_size='8pt', **text_props)
p.text(x=x, y=dodge("period", -0.35, range=p.y_range), text="name",text_font_size="5pt", **text_props)
p.text(x=x, y=dodge("period", -0.2, range=p.y_range), text="label",text_font_size="5pt", **text_props)
p.text(x=["3", "3"], y=["6", "7"], text=["57-71", "89-103"], text_align="center", text_baseline="middle")


color_bar = ColorBar(color_mapper=color_mapper,
    ticker=BasicTicker(desired_num_ticks=10),border_line_color=None,
    label_standoff=cbar_standoff,location=(0,0),orientation='vertical',
    scale_alpha=alpha,major_label_text_font_size=str(cbar_fontsize)+'pt')

if cbar_height is not None:
    color_bar.height = cbar_height

p.add_layout(color_bar,'right')
p.grid.grid_line_color = None
show(p)
以上のコードを実行した結果、以下のような図を得ることができます。

今回は、"電気陰性度(electronegativity)"の描画を例に挙げましたが、bokehが標準で提供しているelementsには以下のような情報(数字のカラムのみ表示しています)が提供されているので、他の情報で描画することも可能です。表示を変える場合は、上記コードにおける変数labelの値を変更してください。また、すでにある情報から計算して新しいカラムを作ったり、pymatgenのAPIを利用してさらに高度な情報を得るなどをすることで、詳細な傾向分析も可能です。
|atomic number| atomic mass| electronegativity| atomic radius| van der Waals radius| IE-1| EA| melting point| boiling point| density year| discovered| group| period|
|:-----:|:-------------:|:-------------:|:-------------:|:-------------:|:-------------:|:-------------:|:-------------:|:-------------:|:-------------:|:-------------:|:-------------:|:-------------:|:-------------:|
|1 |1.00794 |2.20 |37.0 |120.0 |1312.0 |-73.0 |14.0 |20.0 |0.00009 |1766 |1| 1
|2 |4.002602 |NaN |32.0 |140.0 |2372.0 |0.0 |NaN |4.0 |0.00000 |1868 |18 |1
|3 |6.941 |0.98 |134.0 |182.0 |520.0 |-60.0 |454.0 |1615.0 |0.54000 |1817 |1 |2
|4 |9.012182 |1.57 |90.0 |NaN |900.0 |0.0 |1560.0 |2743.0 |1.85000 |1798 |2 |2
|5 |10.811 |2.04 |82.0 |NaN |801.0 |-27.0 |2348.0 |4273.0 |2.46000 |1807 |13 |2
※本ドキュメントのコードは、arosen93さんのコードを微修正して、JupyterLab上で実装したものです。