はじめに
Recipe は、 Plots 自体の実装や他パッケージとの連携に使われるほど強力で、一般ユーザーにとっても有用であろうにも関わらず、いまいち取っつきづらいのか、広く使われているようには思えない1。そこで、ユーザーがよく使うであろう機能 (User Recipes) を中心に、一通りの解説を試みたい。
公式ドキュメント
https://docs.juliaplots.org/latest/recipes/
http://juliaplots.org/RecipesBase.jl/stable/
Recipe の実装(Plots.jl で @reexport されている)
https://github.com/JuliaPlots/RecipesBase.jl
How do Recipes actually work?
https://daschw.github.io/recipes/
Recipe とは?
大まかには、 plot を多重ディスパッチすることで、引数の型に応じた前処理ができるとイメージすればよい(正確には RecipesBase.apply_recipe を多重ディスパッチしている)。
最終的には何ができるのか?
- 独自の型に対するプロット
- プロットの雛形の作成
- オリジナルのプロットコマンドの作成
Recipe の利点
- プロットするデータを加工できる
- プロットオプションのデフォルト値などを設定できる
-
plot(y),plot!(y),plot!(plt, y)の全てを同時に設定できる
例えば、プロット用の関数を自前で定義する場合を考えると、1番目は可能だが、それ以外を実現するのは面倒である。
myplot(y::MyType; kw...) = plot(y.field; kw...)
引数やオプションを処理する
最も良く使うであろう User Recipes の基本を解説していく。
簡単な例から
using Plots
struct MyVector{A<:AbstractVector}
v :: A
end
@recipe function f(myvec::MyVector, k=1)
markershape --> :circle
k * myvec.v
end
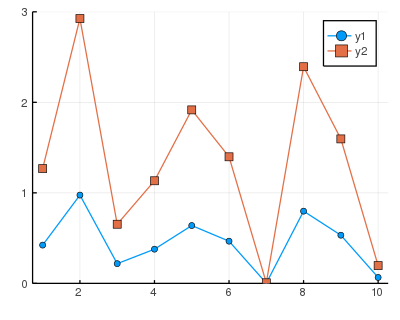
myvec = MyVector(rand(10))
plot(myvec)
plot!(myvec, 3; markershape=:square, ylims=(0, 3)) |> display
独自の型 MyVector を k 倍してプロットする。
Recipe を定義しておけば、 plot に独自の型を直接渡すことができる。
これだけ覚えていれば使える
-
-->でオプションのデフォルト値を設定できる(呼び出し時のオプション設定が優先される) -
:=でオプションの強制値を設定できる(呼び出し時のオプション設定は無視される) - 最後に
plotの引数となるような値かタプルを返す
細かい注意点
Recipe は function の形式で定義するが、あくまでも形式的なもので、実際には関数ではない。
- 関数名は利用されない
- だからといって無名関数ではいけない
-
plotattributesという辞書にアクセスできる returnと書いてはいけない
`@recipe` マクロ展開後
@macroexpand @recipe function f(x::MyType)
    xlim  := (0, 1)
    ylim --> (0, 1)
    x.field
end
:(function (RecipesBase.RecipesBase).apply_recipe(plotattributes::AbstractDict{Symbol, Any}, x::MyType)
    series_list = RecipesBase.RecipeData[]
    func_return = begin
        plotattributes[:xlim] = (0, 1)
        RecipesBase.is_explicit(plotattributes, :ylim) || (plotattributes[:ylim] = (0, 1))
        x.field
    end
    if func_return != nothing
        push!(series_list, RecipesBase.RecipeData(plotattributes, RecipesBase.wrap_tuple(func_return)))
    end
    series_list
end)
簡単な例その2
using Plots
struct KTimes end
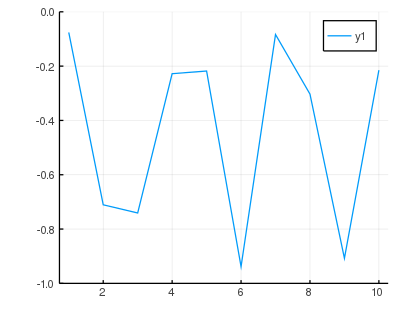
@recipe f(::KTimes, vec::AbstractVector, k=1) = k * vec
plot(KTimes(), rand(10), -1; ylims=(-1, 0)) |> display
既存の引数と被らずに多重ディスパッチさえできれば、特に引数に制約はないので、型とデータを別々に引数として渡してもかまわない。
こうすれば、複合体の定義が単純になる(フィールドを書く必要がなくなる)。
plot 以外のコマンドを扱う
Plots には、 plot 以外にも scatter や heatmap などのプロットコマンドが存在する。これらのコマンドでは実際のところ、コマンド名を seriestype 引数として plot に渡している。例えば、次の2つは同じ処理を行う。
scatter(x, y)
plot(x, y; seriestype=:scatter)
興味がある人は、実装を追ってみるといいだろう。
julia> @macroexpand @shorthands scatter
quote
    export scatter, scatter!
    begin
        $(Expr(:meta, :doc))
        scatter(args...; kw...) = begin
            RecipesBase.plot(args...; kw..., seriestype = :scatter)
        end
    end
    begin
        $(Expr(:meta, :doc))
        scatter!(args...; kw...) = begin
            RecipesBase.plot!(args...; kw..., seriestype = :scatter)
        end
    end
end
実際に scatter などが定義されている場所
https://github.com/JuliaPlots/Plots.jl/blob/master/src/shorthands.jl
@shorthands の実装
https://github.com/JuliaPlots/RecipesBase.jl/blob/master/src/RecipesBase.jl#L389
Recipe 内で heatmap を描きたい場合は、 seriestype := :heatmap (または seriestype --> :heatmap)とすればよい。
--
余談だが、オリジナルの seriestype を作ることもでき、 Series Recipes という分類で言及されている。
https://docs.juliaplots.org/latest/recipes/#Series-Recipes-2
User Recipes の範囲内で似たようなことができ、いまいち追えていないドキュメントを超えて説明すべきことも見つからないので、 Series Recipes の説明は割愛する。
プロットを重ねる
いくつかのデータを同じ図内に描きたいときには plot! を使う。
Recipe 内で同じことを実現したいなら、 @series begin ... end を使えばよい。
help?> @series
  Meant to be used inside a recipe to add additional RecipeData objects to the list:

  @recipe function f(::T)
      # everything get this setting
      linecolor --> :red

      @series begin
          # this setting is only for this series
          fillcolor := :green

          # return the args, just like in recipes
          rand(10)
      end

      # this is the main series... though it can be skipped by returning nothing.
      # note: a @series block returns nothing
      rand(100)
  end
サブプロットする
Recipe 内でレイアウトを構成したい場合は、 layout や subplot オプションを設定すればよいようだ。
プロットコマンドを作成する
User Recipes の @userplot マクロについて解説する。
https://docs.juliaplots.org/latest/recipes/#Marginal-Histograms-1
前節では、あらかじめ定義した複合体に対するプロットを構成した。
@userplot マクロを利用すると、オリジナルの複合体を定義し、さらに同名のプロットコマンドへの紐付けまでやってくれる。
下の例で流れを解説していく。
@userplot MatShow とすると、 MatShow という名前の複合体が定義される。そして、plot(::MatShow) に対応する matshow 関数も定義される。Docstrings が奇妙に見えるかもしれないが、このような書き方をすれば matshow 関数の Docstrings が設定される。
たぶんコードを見たほうがわかりやすいと思う。
julia> @macroexpand @userplot MyUserPlot
quote
    mutable struct MyUserPlot
        args
    end
    export myuserplot, myuserplot!
    begin
        $(Expr(:meta, :doc))
        myuserplot(args...; kw...) = begin
            RecipesBase.plot(MyUserPlot(args); kw...)
        end
    end
    begin
        $(Expr(:meta, :doc))
        myuserplot!(args...; kw...) = begin
            RecipesBase.plot!(MyUserPlot(args); kw...)
        end
    end
    begin
        $(Expr(:meta, :doc))
        myuserplot!(plt::RecipesBase.AbstractPlot, args...; kw...) = begin
            RecipesBase.plot!(plt, MyUserPlot(args); kw...)
        end
    end
end
@recipe は MatShow 複合体に対して定義する。引数がタプルの形で args フィールドに入っているので、必要なら引数チェックをして、通常通り Recipe を書けばよい。
using Plots
default_cgrad(default=:cinferno)
"""
matshow(M::AbstractMatrix)
matshow!(M::AbstractMatrix)
Show elements of given matrix as a heatmap.
# Example
```julia-repl
julia> matshow(rand(4, 5); clim=(0, 1))
```
"""
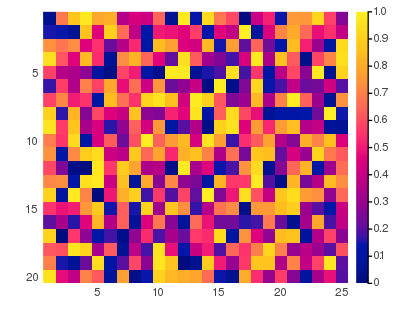
@userplot MatShow
@recipe function f(m::MatShow)
@assert length(m.args) == 1
M = m.args[1]
@assert M isa AbstractMatrix
yflip --> true
frame --> :grid
seriestype := :heatmap
reverse(axes(M))..., M
end
matshow(rand(20, 25); clim=(0, 1)) |> display
※ コード中でバッククオートをエスケープできなかったので全角にしている
他の Recipe から使うときなど、 matshow を plot の形式で呼び出したいときには、引数をタプルで包むのを忘れないようにしよう。
M = rand(20, 25)

matshow(M)
plot(MatShow((M, )))
個々の引数を処理する
この節は、ややこしい割にあまり利用シーンが思い浮かばないので、適当に読み飛ばしてもよいと思う。
plot の引数処理にはいくつかの過程があり、まず User Recipes で(キーワードなしの)全ての引数をまとめて処理する。
User Recipes に当てはまらないか、処理してもそのままプロットできなければ、個々の引数を処理する。
この「個々の引数の処理」が Type Recipes であり、この節で解説していく。
引数の処理過程
https://docs.juliaplots.org/latest/pipeline/
例えば、多重ディスパッチさせるために、配列を複合体でラップすることを考えよう。
その上で、複合体を配列として振る舞わせたい。
つまり、 plot(x, y) の x や y に直接渡したいとする。
王道の実装をするならば、 AbstractArray のサブタイプにして、配列としてのインターフェースを整えればよいだろう。
https://docs.julialang.org/en/v1/manual/interfaces/#man-interface-array-1
using Plots

struct MyVec1{T, A<:AbstractVector{T}} <: AbstractVector{T}
    v :: A
end

Base.size(mv::MyVec1) = size(mv.v)
Base.getindex(mv::MyVec1, i) = getindex(mv.v, i)

myvec1 = MyVec1(randn(100))
plot(myvec1) |> display
単にプロットすればよいだけならば、同じことが Recipe だけで完結する。
メソッドを定義したり、 AbstractArray のサブタイプにする必要がなくなる。
using Plots

struct MyVec2{A<:AbstractVector}
    v :: A
end

@recipe function f(::Type{MyVec2{A}}, mv::MyVec2) where {A<:AbstractVector}
    mv.v
end

myvec2 = MyVec2(randn(100))
plot(myvec2) |> display
Julia で多重ディスパッチするためのタイプシグネチャ
https://qiita.com/Lirimy/items/6be505199bfa271cde87
上の例を作っていて痛感したのだが、型パラメータを付加するならば相応の正確さが求められるし、付加しないならばパフォーマンスの低下を受け入れなければならない。
Type Recipes は Plots 内部ではよく使われているが、ユーザーの立場で見ると、似たようなことが User Recipes で手軽に実現できるわけで、ユーザーが Type Recipes を積極的に選択する理由は乏しいと思う。
パッケージ開発者に向けて
何かのデータをプロットする機能を実装したい場面はけっこうあると思う。
しかし、 Plots.jl のように重いパッケージを依存関係に加えるのは抵抗があるだろう。
そんなとき、 RecipesBase.jl だけを使って Recipe を実装することによって、パッケージを重くせずにプロット機能を追加できる。
パッケージを使ってプロットするときには、ユーザーに using Plots と書いてもらえばいい。
-
かくいう私自身も存在を教えてもらってから長らくは全く使えないでいた ↩