About
amcharts関連の日本語文献のあまりの少なさから、誰かのお役に立てればと思い記載しています!
Environment
この記事ではmacbook(unix)にインストールしたruby 2.5.1p57, Rails 5.2.3を使っています。
amchartsとは
amcharts
javascriptでチャートを描画するためのフレームワークです。 棒、エリア、列、バー、パイ、XY、散布、ローソク足のようなチャートを描画することが出来ます。
(参考文献)
http://mikawatan.hatenablog.com/entry/2016/10/09/171130
Demosとは
amchartsが提供しているサンプルの一覧です。
実際にご覧いただいた方が早いと思います。下記よりご確認ください。
https://www.amcharts.com/demos/
使用方法
HTML内でResources(CDN)を記載することで利用できます。
商用利用の場合も、チャート内のamchartsアイコン(amchartsへのリンク)を削除しなければそのまま使用可能です。
(参考文献)
https://www.amcharts.com/online-store/
Free license
"Use anywhere you want as long as you don't mind a small amCharts attribution on charts"
Rails環境ですが、Demoをわかりやすく、そのまま使用するために、
今回は各viewファイル内に直接記載していきます。
<!-- Resources -->
<script src="https://www.amcharts.com/lib/4/core.js"></script>
<script src="https://www.amcharts.com/lib/4/charts.js"></script>
<script src="https://www.amcharts.com/lib/4/themes/animated.js"></script>
これで準備完了です。
導入方法
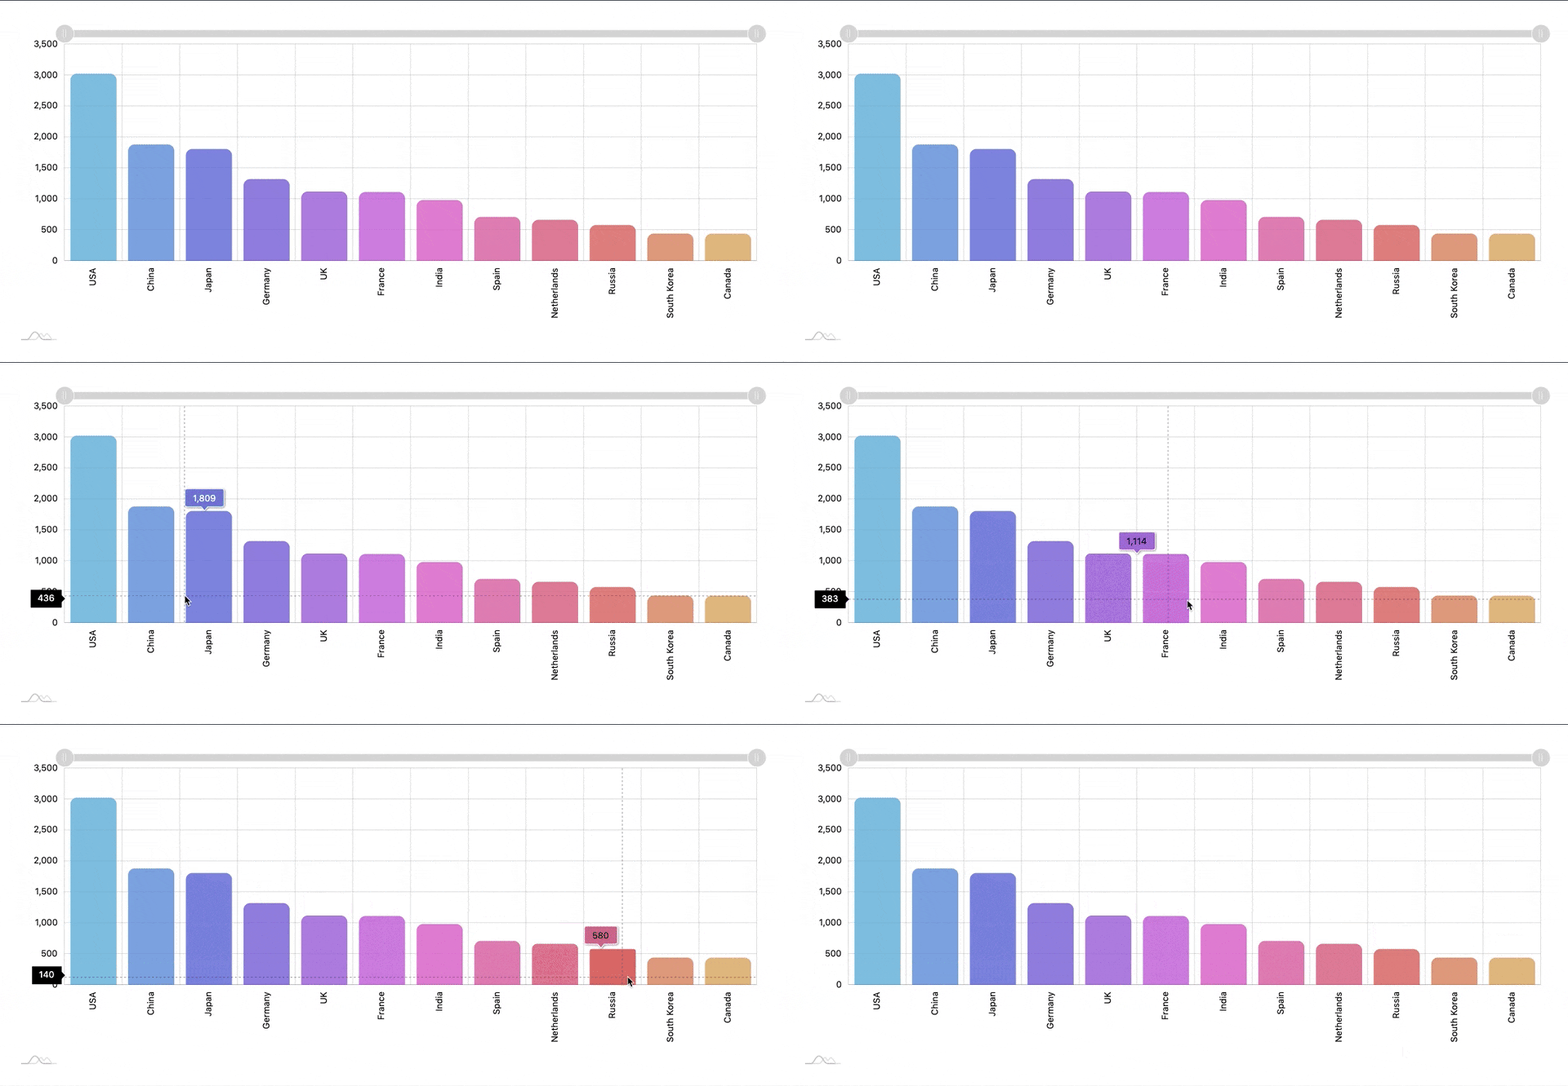
今回は、こちらのチャートを扱います。
ページ内で下にスクロールすると、Demo sourceが置いてありますので、コピーします。
<!-- Styles -->
<style>
# chartdiv {
  width: 100%;
  height: 500px;
}
</style>

<!-- Resources -->
<script src="https://www.amcharts.com/lib/4/core.js"></script>
<script src="https://www.amcharts.com/lib/4/charts.js"></script>
<script src="https://www.amcharts.com/lib/4/themes/animated.js"></script>

<!-- Chart code -->
<script>
am4core.ready(function() {

// Themes begin
am4core.useTheme(am4themes_animated);
// Themes end

// Create chart instance
var chart = am4core.create("chartdiv", am4charts.XYChart);
chart.scrollbarX = new am4core.Scrollbar();

// Add data
chart.data = [{
  "country": "USA",
  "visits": 3025
}, {
  "country": "China",
  "visits": 1882
}, {
  "country": "Japan",
  "visits": 1809
}, {
  "country": "Germany",
  "visits": 1322
}, {
  "country": "UK",
  "visits": 1122
}, {
  "country": "France",
  "visits": 1114
}, {
  "country": "India",
  "visits": 984
}, {
  "country": "Spain",
  "visits": 711
}, {
  "country": "Netherlands",
  "visits": 665
}, {
  "country": "Russia",
  "visits": 580
}, {
  "country": "South Korea",
  "visits": 443
}, {
  "country": "Canada",
  "visits": 441
}];

// Create axes
var categoryAxis = chart.xAxes.push(new am4charts.CategoryAxis());
categoryAxis.dataFields.category = "country";
categoryAxis.renderer.grid.template.location = 0;
categoryAxis.renderer.minGridDistance = 30;
categoryAxis.renderer.labels.template.horizontalCenter = "right";
categoryAxis.renderer.labels.template.verticalCenter = "middle";
categoryAxis.renderer.labels.template.rotation = 270;
categoryAxis.tooltip.disabled = true;
categoryAxis.renderer.minHeight = 110;

var valueAxis = chart.yAxes.push(new am4charts.ValueAxis());
valueAxis.renderer.minWidth = 50;

// Create series
var series = chart.series.push(new am4charts.ColumnSeries());
series.sequencedInterpolation = true;
series.dataFields.valueY = "visits";
series.dataFields.categoryX = "country";
series.tooltipText = "[{categoryX}: bold]{valueY}[/]";
series.columns.template.strokeWidth = 0;

series.tooltip.pointerOrientation = "vertical";

series.columns.template.column.cornerRadiusTopLeft = 10;
series.columns.template.column.cornerRadiusTopRight = 10;
series.columns.template.column.fillOpacity = 0.8;

// on hover, make corner radiuses bigger
var hoverState = series.columns.template.column.states.create("hover");
hoverState.properties.cornerRadiusTopLeft = 0;
hoverState.properties.cornerRadiusTopRight = 0;
hoverState.properties.fillOpacity = 1;

series.columns.template.adapter.add("fill", function(fill, target) {
  return chart.colors.getIndex(target.dataItem.index);
});

// Cursor
chart.cursor = new am4charts.XYCursor();

}); // end am4core.ready()
</script>

<!-- HTML -->
<div id="chartdiv"></div>
お気づきでしょうか?既に使用方法欄で記載した内容は、こちらのDemo sourceに必ず記載されているものです。なので、コピーをそのまま利用される方は、CDNを記載する必要はありません。
それでは、コピーした内容をそのままhtmlにペーストします。
<!--コピー内容をそのままペースト-->
編集方法
このままでは当然ですが、サンプルデータそのままになってしまいます。
各機能について(理解している部分)を記載していきます。
Styles
cssです。フォントのサイズ等を指定できますが、指定できる項目には限りがあります。
<!-- Styles -->
<style>
  #chartdiv {
    width: 100%;
    height: 500px;
    font-size: 20px;
   }
</style>
chart code
本体です。以下、コメントアウトにて詳細を記載します。
<!-- Chart code -->
<script>
am4core.ready(function() {

// Themes begin
// テーマです。
am4core.useTheme(am4themes_animated);
// Themes end

// Create chart instance
//始めにインスタンスを作成しています。
var chart = am4core.create("chartdiv", am4charts.XYChart);
//X軸方向のスクロールバーです。私はいらなかったのでコメントアウトしました。
chart.scrollbarX = new am4core.Scrollbar();

// Add data
// ここにデータを入力していきます。
chart.data = [{
  "country": "USA",
  "visits": 3025
}, {
  "country": "China",
  "visits": 1882
}, {
  "country": "Japan",
  "visits": 1809
}, {
  "country": "Germany",
  "visits": 1322
}, {
  "country": "UK",
  "visits": 1122
}, {
  "country": "France",
  "visits": 1114
}, {
  "country": "India",
  "visits": 984
}, {
  "country": "Spain",
  "visits": 711
}, {
  "country": "Netherlands",
  "visits": 665
}, {
  "country": "Russia",
  "visits": 580
}, {
  "country": "South Korea",
  "visits": 443
}, {
  "country": "Canada",
  "visits": 441
}];

// Create axes
//ここからはX軸方向について
var categoryAxis = chart.xAxes.push(new am4charts.CategoryAxis());
//データフィールドのカテゴリーです。今回はcountryですね。
categoryAxis.dataFields.category = "country";
//この辺りはあまり手を加える必要はないかと思います。
categoryAxis.renderer.grid.template.location = 0;
categoryAxis.renderer.minGridDistance = 30;
categoryAxis.renderer.labels.template.horizontalCenter = "right";
categoryAxis.renderer.labels.template.verticalCenter = "middle";
//文字の向きです。このままだと270度回転して縦方向の文字列になりますので、
//横向き希望の方は0に設定すると良いです。
categoryAxis.renderer.labels.template.rotation = 270;
categoryAxis.tooltip.disabled = true;
categoryAxis.renderer.minHeight = 110;

//ここからはY軸方向について
var valueAxis = chart.yAxes.push(new am4charts.ValueAxis());
valueAxis.renderer.minWidth = 50;

// Create series
// ようやくチャートの設定です。上記のデータフィールドの項目を使用します。
var series = chart.series.push(new am4charts.ColumnSeries());
series.sequencedInterpolation = true;
// Y軸方向はvisits
series.dataFields.valueY = "visits";
// X軸方向はcountry
series.dataFields.categoryX = "country";
// tooltipはグラフにカーソルを当てると上部に表示される内容です。
series.tooltipText = "[{categoryX}: bold]{valueY}[/]";
series.columns.template.strokeWidth = 0;

series.tooltip.pointerOrientation = "vertical";

series.columns.template.column.cornerRadiusTopLeft = 10;
series.columns.template.column.cornerRadiusTopRight = 10;
series.columns.template.column.fillOpacity = 0.8;

// on hover, make corner radiuses bigger
// ホバーした際の設定です。
var hoverState = series.columns.template.column.states.create("hover");
hoverState.properties.cornerRadiusTopLeft = 0;
hoverState.properties.cornerRadiusTopRight = 0;
hoverState.properties.fillOpacity = 1;

series.columns.template.adapter.add("fill", function(fill, target) {
  return chart.colors.getIndex(target.dataItem.index);
});

// Cursor
// カーソル設定です。非表示にしたい場合は、以下のコメントアウトのように記載します。
chart.cursor = new am4charts.XYCursor();
// chart.cursor.lineX.disabled = true;
// chart.cursor.lineY.disabled = true;

}); // end am4core.ready()
</script>
HTML
最後に、HTMLを記載します。
<!-- HTML -->
<div id="chartdiv"></div>
リンクの貼り方
chartにリンクを貼りたい!という方、必見です。
下記の様な記載で実装できます。
<script>
//  データの項目にidを追加
chart.data = [{
  "country": "USA",
  "visits": 3025,
  "id": 0
}, {
  "country": "China",
  "visits": 1882,
  "id": 1
}, {
  "country": "Japan",
  "visits": 1809,
  "id": 2
}, {
  "country": "Germany",
  "visits": 1322,
  "id": 3
}, {
  "country": "UK",
  "visits": 1122,
  "id": 4
}];

// script内で下記記載。最後の{}内の記載方法でid毎のページを呼び出せます。
series.columns.template.url =
      `http://hoge/users/huga/sleeps/{id.urlEncode()}`;
実装例
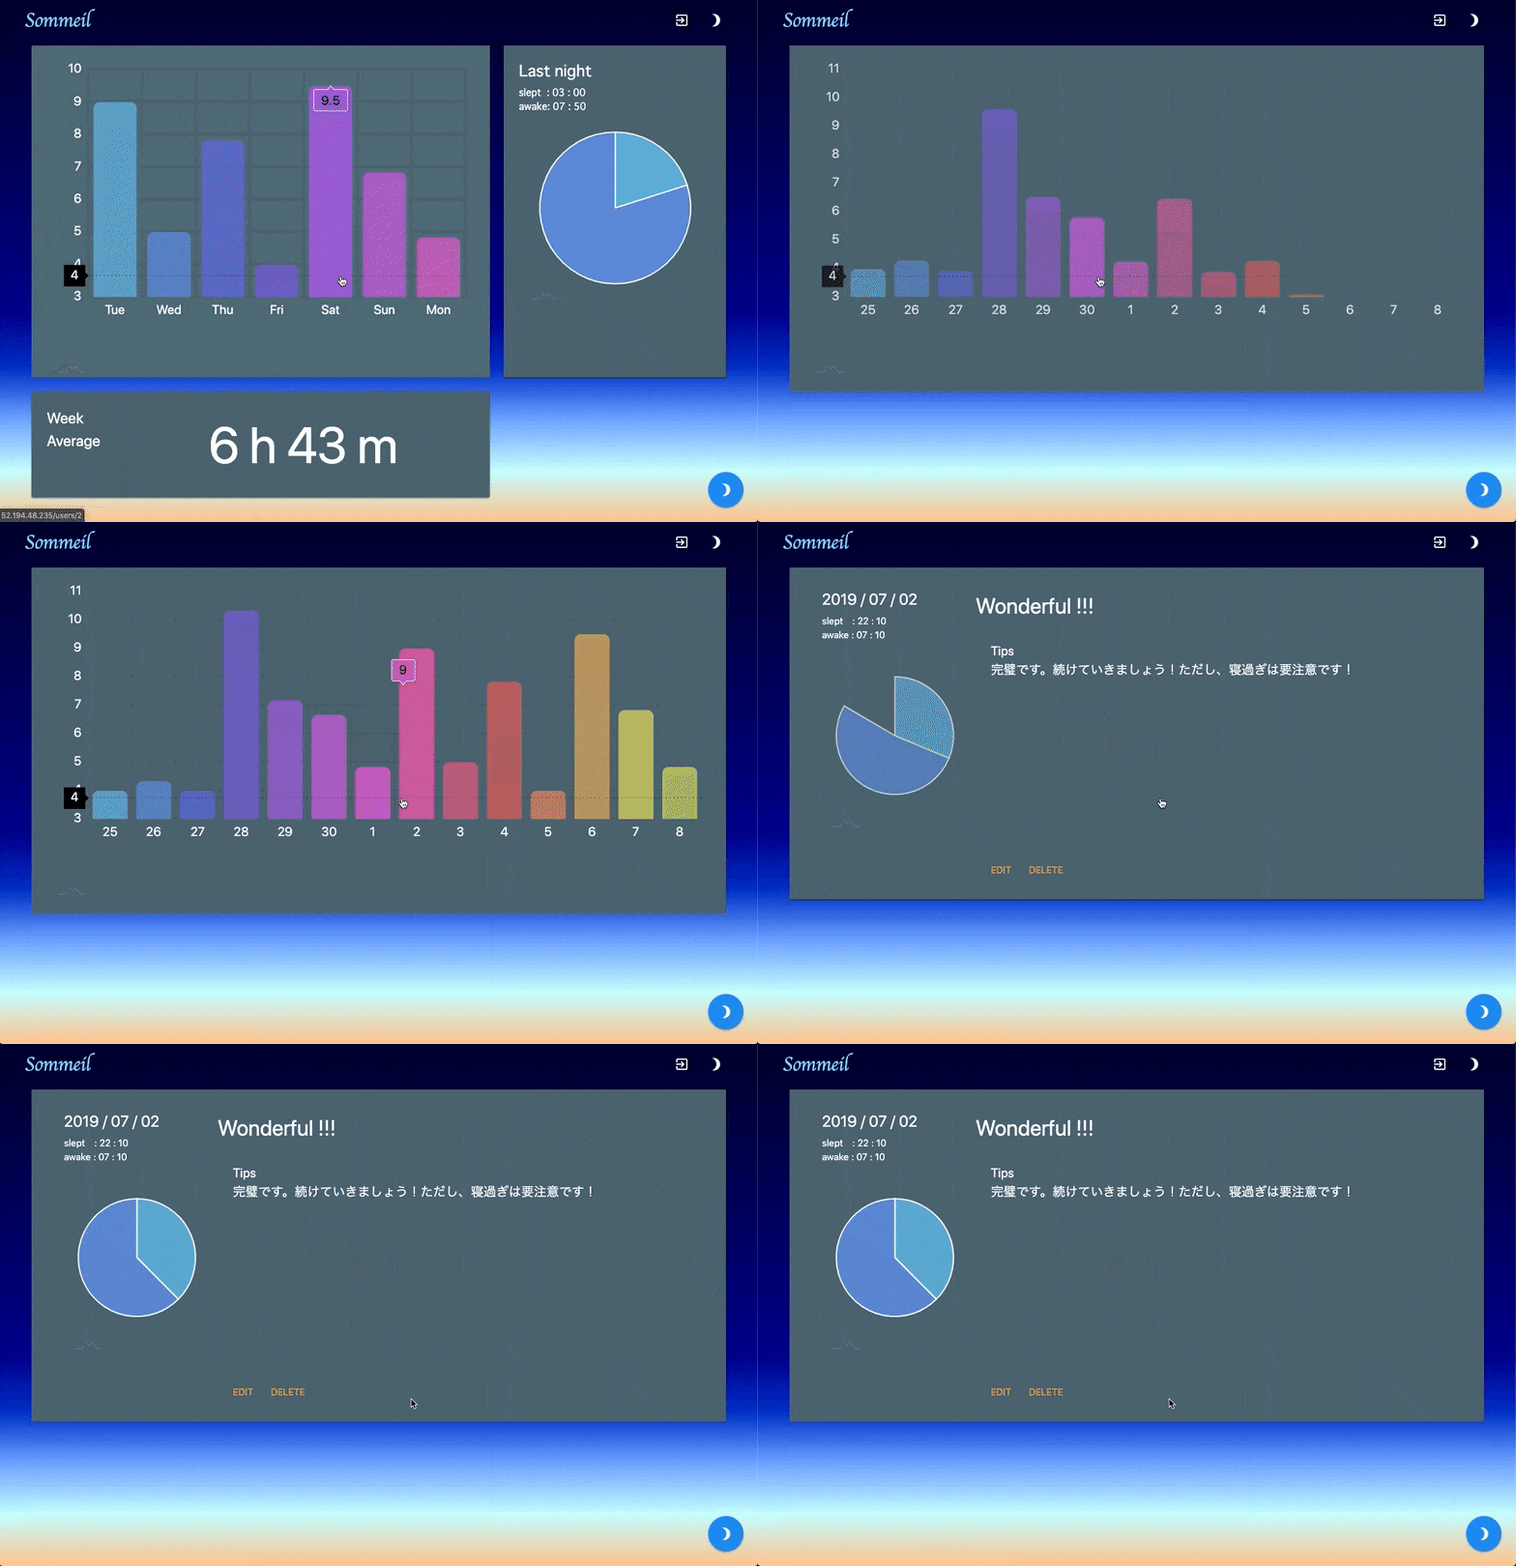
最後に、私が作成した"sommeil"というアプリケーションのコードの内、一部のamcharts部分を参考までに記載します。
こちらのコードでは、オリジナル要素としてチャートのグラフ内から詳細ページに飛べる仕組みを導入しています。
この部分に関して、いくらGoogle先生に聞いても出てこなかったので、記事を執筆しました...。
全編はgithubをご覧下さい。
実装イメージについては、グローバルIPで恐縮ですが公開中です。(sommeil)
</style>
<!-- Resources -->
<script src="https://www.amcharts.com/lib/4/core.js"></script>
<script src="https://www.amcharts.com/lib/4/charts.js"></script>
<script src="https://www.amcharts.com/lib/4/themes/animated.js"></script>
<!-- Chart code -->
<script>
  am4core.ready(function () {
    // Themes begin
    am4core.useTheme(am4themes_animated);
    // Themes end
    // Create chart instance
    var chart = am4core.create("chartdiv", am4charts.XYChart);
    //chart.scrollbarX = new am4core.Scrollbar();
    // Add data
    var sleeping_times = '<%= @sleeping_times %>'.replace(/\[/g, "").replace(/\]/g, "").split(',');
    var dates = '<%= @dates %>'.replace(/\[/g, "").replace(/\]/g, "").replace(/\s/g, "").split(',');
    var sleep_ids = '<%= @sleep_ids %>'.replace(/\[/g, "").replace(/\]/g, "").replace(/\s/g, "").split(
      ',');
    console.log(sleep_ids);
    chart.data = [{
      "day": dates[0],
      "time": sleeping_times[0],
      "id": sleep_ids[0]
    }, {
      "day": dates[1],
      "time": sleeping_times[1],
      "id": sleep_ids[1]
    }, {
      "day": dates[2],
      "time": sleeping_times[2],
      "id": sleep_ids[2]
    }, {
      "day": dates[3],
      "time": sleeping_times[3],
      "id": sleep_ids[3]
    }, {
      "day": dates[4],
      "time": sleeping_times[4],
      "id": sleep_ids[4]
    }, {
      "day": dates[5],
      "time": sleeping_times[5],
      "id": sleep_ids[5]
    }, {
      "day": dates[6],
      "time": sleeping_times[6],
      "id": sleep_ids[6]
    }, {
      "day": dates[7],
      "time": sleeping_times[7],
      "id": sleep_ids[7]
    }, {
      "day": dates[8],
      "time": sleeping_times[8],
      "id": sleep_ids[8]
    }, {
      "day": dates[9],
      "time": sleeping_times[9],
      "id": sleep_ids[9]
    }, {
      "day": dates[10],
      "time": sleeping_times[10],
      "id": sleep_ids[10]
    }, {
      "day": dates[11],
      "time": sleeping_times[11],
      "id": sleep_ids[11]
    }, {
      "day": dates[12],
      "time": sleeping_times[12],
      "id": sleep_ids[12]
    }, {
      "day": dates[13],
      "time": sleeping_times[13],
      "id": sleep_ids[13]
    }];
    // Create axes
    var categoryAxis = chart.xAxes.push(new am4charts.CategoryAxis());
    categoryAxis.dataFields.category = "day";
    categoryAxis.renderer.grid.template.location = 0;
    categoryAxis.renderer.minGridDistance = 30;
    categoryAxis.renderer.labels.template.horizontalCenter = "middle";
    categoryAxis.renderer.labels.template.verticalCenter = "middle";
    categoryAxis.renderer.labels.template.rotation = 0;
    categoryAxis.renderer.labels.template.fill = am4core.color("#fff");
    categoryAxis.tooltip.disabled = true;
    categoryAxis.renderer.minHeight = 110;
    var valueAxis = chart.yAxes.push(new am4charts.ValueAxis());
    valueAxis.renderer.minWidth = 50;
    valueAxis.renderer.labels.template.fill = am4core.color("#fff");
    // Create series
    var series = chart.series.push(new am4charts.ColumnSeries());
    series.sequencedInterpolation = true;
    series.dataFields.valueY = "time";
    series.dataFields.categoryX = "day";
    series.tooltipText = "[{categoryX}: bold]{valueY}[/]";
    series.columns.template.strokeWidth = 0;
    series.tooltip.pointerOrientation = "vertical";
    //Go to detail page
    var current_user_id = '<%= @user.id %>'
    series.columns.template.url =
      `http://52.194.48.235/users/${current_user_id}/sleeps/{id.urlEncode()}`;
    series.columns.template.column.cornerRadiusTopLeft = 10;
    series.columns.template.column.cornerRadiusTopRight = 10;
    series.columns.template.column.fillOpacity = 0.8;
    // on hover, make corner radiuses bigger
    var hoverState = series.columns.template.column.states.create("hover");
    //hoverState.properties.cornerRadiusTopLeft = 0;
    //hoverState.properties.cornerRadiusTopRight = 0;
    hoverState.properties.fillOpacity = 1;
    series.columns.template.adapter.add("fill", function (fill, target) {
      return chart.colors.getIndex(target.dataItem.index);
    });
    // Cursor
    chart.cursor = new am4charts.XYCursor();
    chart.cursor.lineX.disabled = true;
  }); // end am4core.ready()
</script>
<!-- HTML -->
<div id="chartdiv"></div>
最後に
合わせてpiechartの作成方法なども近日公開予定です。
ご覧いただき、ありがとうございました。
筆者について
TECH::EXPERTにて4月よりruby, railsを学習している未経験エンジニアです。
記載内容に不備・不足があればご指摘いただけると幸いです。
至らぬ点ばかりですので、改善点がありましたらどんどんご指摘下さい!

