0 準備
必要なものをimportします.
ソースコード0
%matplotlib inline
import numpy as np
import matplotlib.pyplot as plt
import math
from matplotlib.colors import LogNorm
1 関数形を見てみる
1.1 描画設定
最初にグラフ描画の設定をします(two_d_plot_setting(title_name),ソースコード1).背景が黒で文字などが白になるように設定しています.グリッドを点線にしているところもこだわりです.
ソースコード1
def two_d_plot_setting(title_name):
    ax.set_xlabel(r'$r$', fontsize = 15) #x value is radius
    ax.set_ylabel(r'$V$', fontsize = 15) #y value is potential energy

    ax.spines['bottom'].set_color('white')
    ax.spines['top'].set_color('white')
    ax.spines['left'].set_color('white')
    ax.spines['right'].set_color('white')

    ax.xaxis.label.set_color('white')
    ax.yaxis.label.set_color('white')

    plt.xticks(rotation = 0) #rotation
    ax.tick_params(which='both', axis='both', colors='white') #which = <major> or <minor> or <both>

    ax.set_facecolor('black')
    fig.patch.set_facecolor('black')  #これでfigの背景を黒に

    ax.grid(color = 'white', linestyle='dotted')

    ax.set_title(title_name,fontname="Helvetica Neue", fontsize=15, color = 'white')
1.2 グラフをプロットする
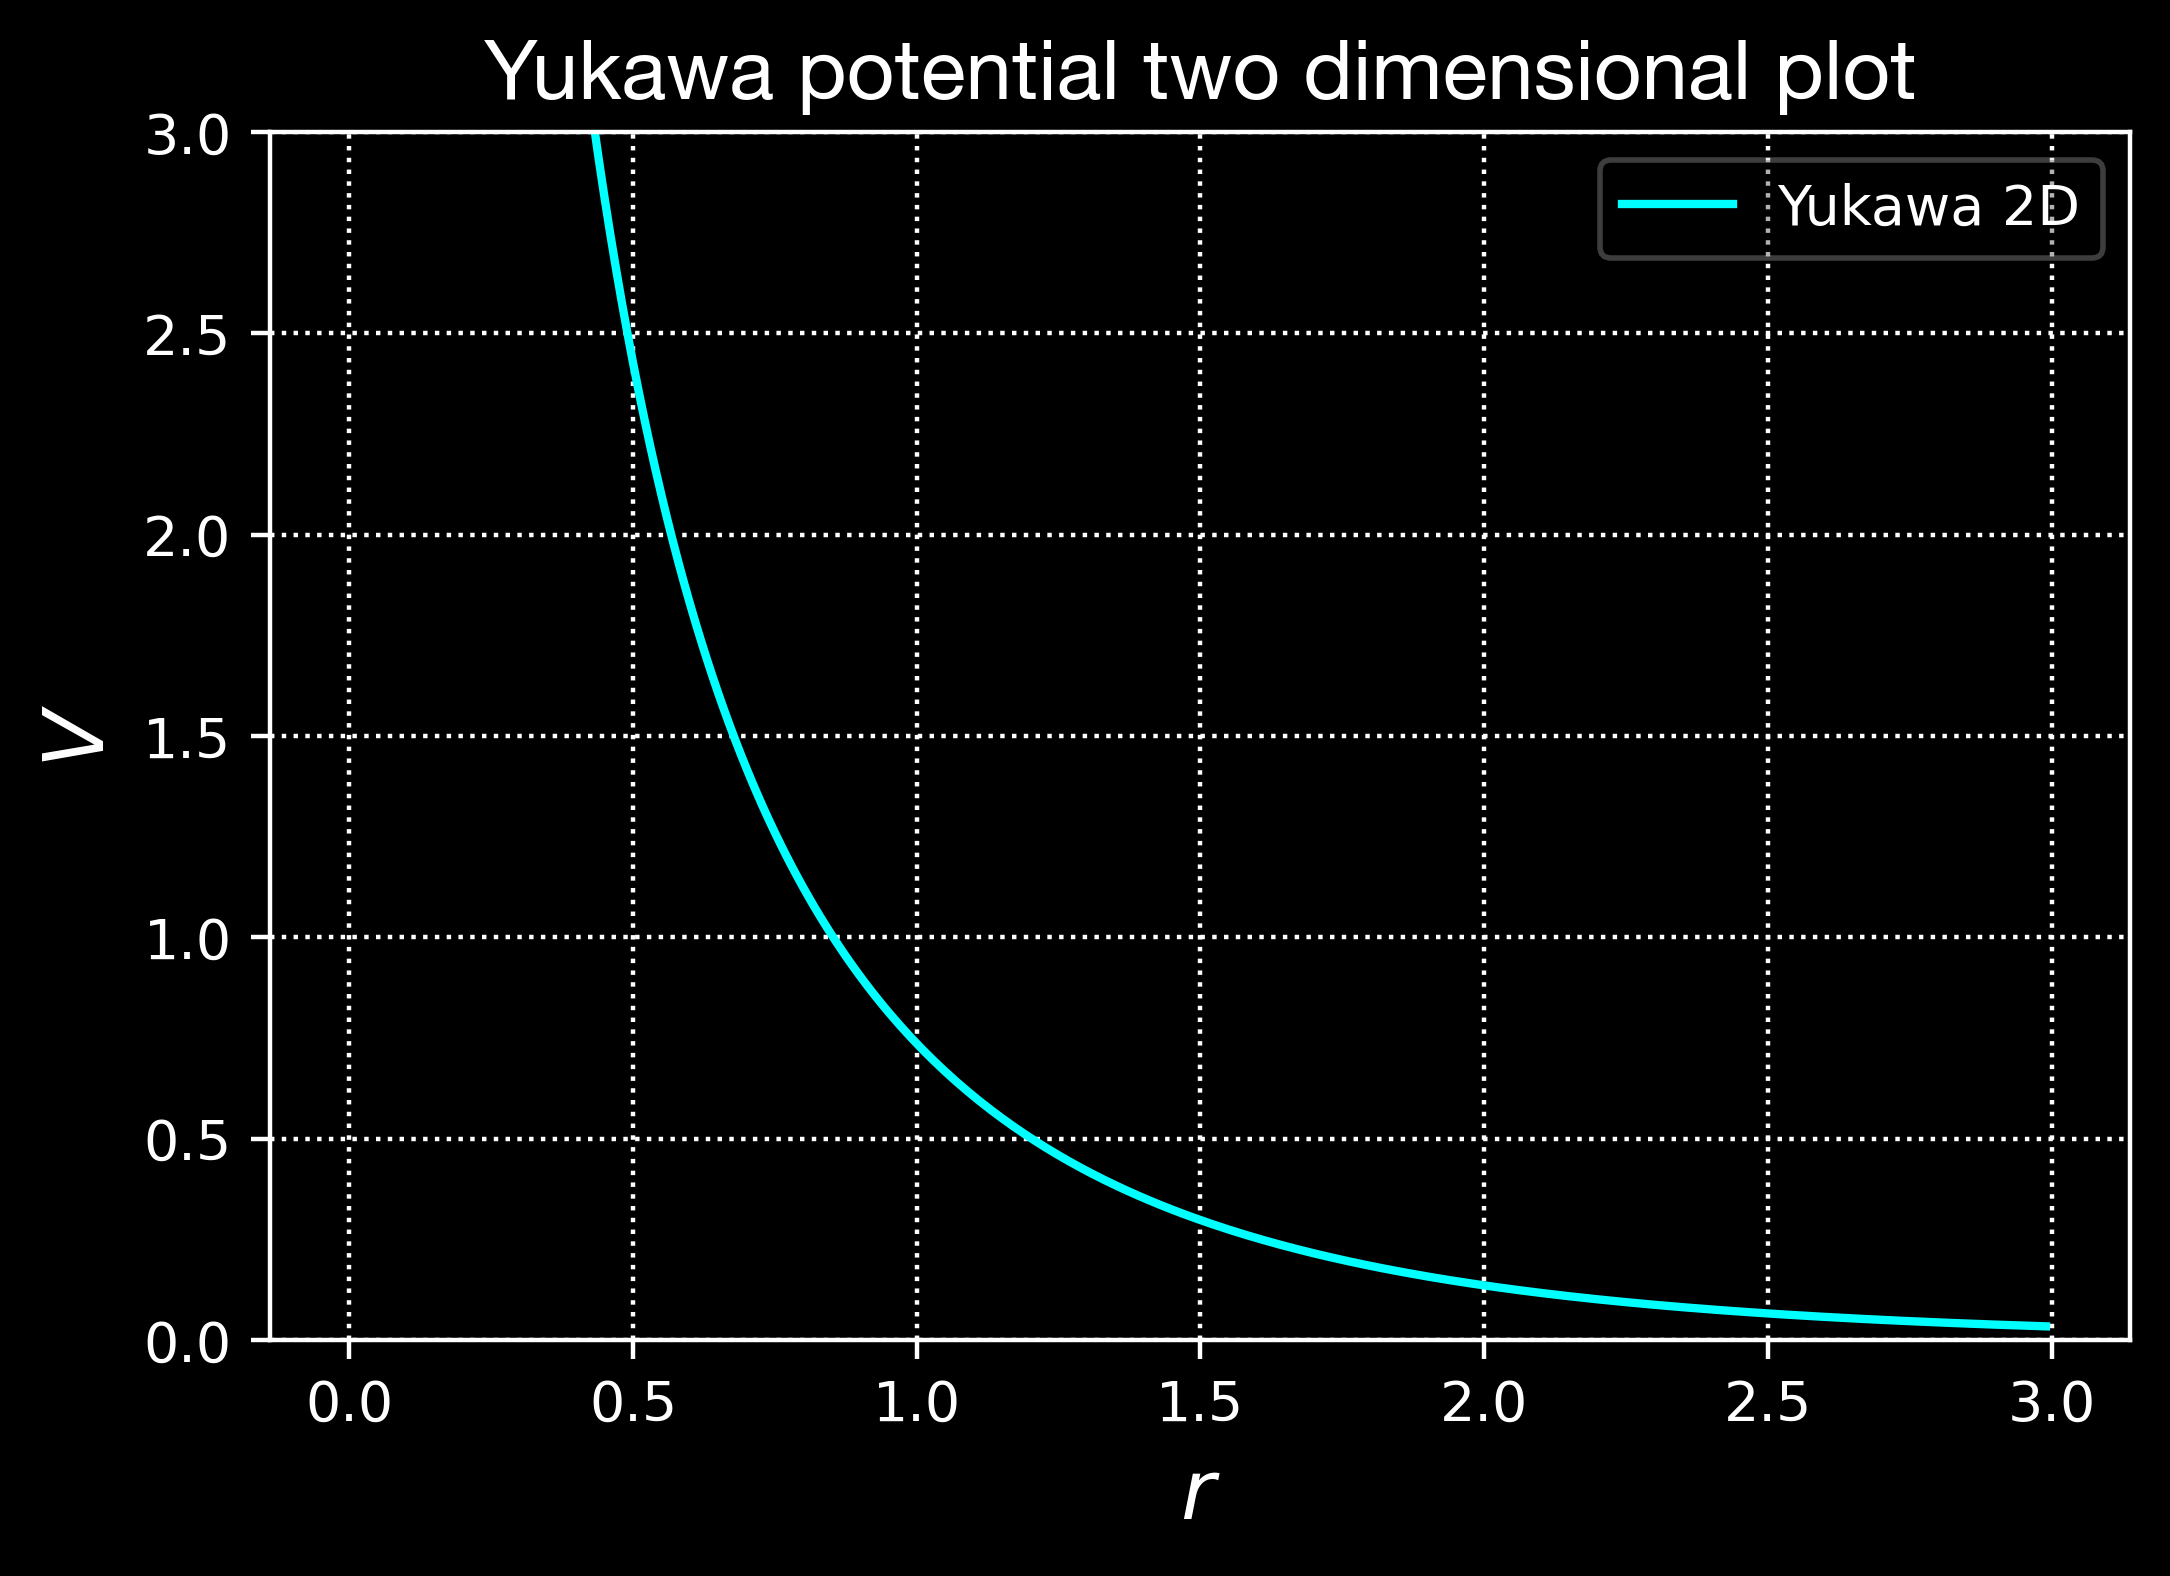
まずは $x,,y$ 平面で湯川ポテンシャルをプロットしてどんな関数か見てみましょう(ソースコード2).
F(x) = \alpha \frac{e^{- \kappa x} }{x}
ソースコード2
step = 0.01
a = 3
x = np.arange(step, a, step)

def F(x):
    al = 2
    ka = 1
    return al*np.exp(- ka*x)/x

y = F(x)

fig = plt.figure()
ax = fig.add_subplot(111)

ax.plot(x, y, color = 'cyan', label = 'Yukawa 2D')

ax.set_ylim([0,a])

plt.legend(loc='best', labelcolor = 'white', facecolor='black', framealpha=.3)

two_d_plot_setting('Yukawa potential two dimensional plot')
plt.show()
fig.savefig('yukawa_2d.png', dpi=400, facecolor='black', bbox_inches="tight")

なるほど,1/rの発散とexpの収束が合わさったような形をしています.
2 カラープロットする
2.1 線形プロット
さて,
z = \alpha \frac{e^{- \kappa \sqrt{x^2 + y^2}}}{\sqrt{x^2 + y^2}}
という方程式をカラープロットする事を考えましょう.
以下で, two_d_plot_setting(title_name)を修正してtwo_d_plot_setting_color(title_name)と名前を変えています(ソースコード3).これはソースコード4でも共通です.数式に代入されるパラメータも若干変えています.
ソースコード3
def two_d_plot_setting_color(title_name):
    ax.set_xlabel(r'$x$', fontsize = 15)
    ax.set_ylabel(r'$y$', fontsize = 15)

    ax.spines['bottom'].set_color('white')
    ax.spines['top'].set_color('white')
    ax.spines['left'].set_color('white')
    ax.spines['right'].set_color('white')

    ax.xaxis.label.set_color('white')
    ax.yaxis.label.set_color('white')

    ax.xaxis.set_ticks(list_ticks_x) # x axis ticks
    ax.yaxis.set_ticks(list_ticks_y) # y axis ticks
    plt.xticks(rotation = 0) #rotation
    ax.tick_params(which='both', axis='both', colors='white') #which = <major> or <minor> or <both>

    ax.set_facecolor('black')
    fig.patch.set_facecolor('black')  #これでfigの背景

    #ax.set_aspect('equal') #axを等アスペクト比にもできる
    ax.grid(color = 'white', linestyle='dotted')

    ax.set_title(title_name,fontname="Helvetica Neue", fontsize=15, color = 'white')


step = 0.01 #幅
a = 1 #範囲.
neg = np.arange(-a, -1*step, step)
pos = np.arange(1*step, a, step)
x = np.concatenate([neg, pos]) #x軸.0割りを回避.
y = np.concatenate([neg, pos]) #y軸.0割りを回避.

grid_interval_x = .25
grid_interval_y = .25

list_ticks_x = np.arange(-a, a + a/100, grid_interval_x)
list_ticks_y = np.arange(-a, a + a/100, grid_interval_y)


X, Y = np.meshgrid(x, y)
al = 0.1 #ポテンシャルの比例係数.alphaのつもり.
ka = 0.01 #減衰の速さ.kappaのつもり.
Z = al*np.exp(- ka*np.sqrt(X**2 + Y**2))/np.sqrt(X**2 + Y**2) #Yukawa potential


fig = plt.figure()
ax = fig.add_subplot(111)

mappable = ax.pcolormesh(X, Y, Z, cmap='jet', shading='nearest') #色付け規則.cmapで配色.
cbar = fig.colorbar(mappable, ax=ax, orientation="vertical")
cbar.set_label("color", fontname="Helvetica Neue", fontsize=18, color = 'white',rotation=90) #カラーバーのラベル
cbar.ax.yaxis.set_tick_params(color= 'white') #メモリを白に
cbar.outline.set_edgecolor('white') #枠線を白に
plt.setp(plt.getp(cbar.ax.axes, 'yticklabels'), color='white')

two_d_plot_setting_color('Yukawa potential color plot (linear)')

plt.show()
fig.savefig('yukawa_linear.png', dpi=400, facecolor='black', bbox_inches="tight")
結果は以下のようになります.指数型の減衰なので原点から離れるとすぐに絶対値が潰れてしまって,色がベタ塗りになってしまっていますね.少しパラメータをいじっても解決しないかもしれません.どうしたら良いでしょうか.

2.2 湯川ポテンシャルを美しくカラープロットする.
そこでカラーバーのスケールを対数軸に変えてしまいましょう.こうすれば指数と対数がうまく相殺してきれいな配色になるはずです.以下のプログラムを書いてやればOKです(ソースコード0, 4).Jupyter notebook で改行してあることに注意して下さい.
from matplotlib.colors import LogNorm
mappable = ax.pcolormesh(X, Y, Z, cmap='jet',norm=LogNorm(vmin=1e-1, vmax=1e1),
                        shading='nearest') #対数プロットのカラーバー
副メモリまで白で表示するために,
cbar.ax.yaxis.set_tick_params(which = 'both', color= 'white')
において which = 'both'を忘れないようにしましょう.
ソースコード4
step = 0.01
a = 1
neg = np.arange(-a, -1*step, step)
pos = np.arange(1*step, a, step)
x = np.concatenate([neg, pos])  #x軸.0割りを回避.
y = np.concatenate([neg, pos])  #y軸.0割りを回避.

grid_interval_x = .25
grid_interval_y = .25

list_ticks_x = np.arange(-a, a + a/100, grid_interval_x)
list_ticks_y = np.arange(-a, a + a/100, grid_interval_y)


X, Y = np.meshgrid(x, y)
al = 0.1
ka = 0.01
Z = al*np.exp(- ka*np.sqrt(X**2 + Y**2))/np.sqrt(X**2 + Y**2) #Yukawa potential

fig = plt.figure()
ax = fig.add_subplot(111)

mappable = ax.pcolormesh(X, Y, Z, cmap='jet',norm=LogNorm(vmin=1e-1, vmax=1e1),
                        shading='nearest') #対数プロットのカラーバー
cbar = fig.colorbar(mappable, ax=ax, orientation="vertical")
cbar.set_label("color", fontname="Helvetica Neue", fontsize=18, color = 'white',rotation=90) #カラーバーのラベル.
cbar.ax.yaxis.set_tick_params(which = 'both', color= 'white') #メモリを白に.which = 'both'で副メモリまで白に.

cbar.outline.set_edgecolor('white') #枠線を白に
plt.setp(plt.getp(cbar.ax.axes, 'yticklabels'), color='white')


two_d_plot_setting_color('Yukawa potential color plot (log scale)')

plt.show()
fig.savefig('yukawa_log.png', dpi=400, facecolor='black', bbox_inches="tight")
結果は以下です.

非常に美しいグラフが出力できました.軸が log スケールであることを意識しておけば,指数型で (short-range で) 減衰するという物理的直観も保たれます.
最後までお読みいただき,ありがとうございました.
参考記事
[Pythonによる科学・技術計算] 2次元(カラー)等高線等の描画,可視化,matplotlib - Qiita
matplotlibでカラーバーの範囲を思い通りにする - Qiita
color example code: colormaps_reference.py — Matplotlib 2.0.2 documentation
python - matplotlib:タイトルとカラーバーのテキストとティックカラーを変更する
[ オブジェクト指向なカラーバーの表示 - Helve’s Python memo]
(https://helve-python.hatenablog.jp/entry/2018/08/07/000000)