はじめに
もともとこちらでElasticsearchとKibanaを連携させていた。
その後も学習はしていたものの投稿はしていなかったため、
記憶を辿りつつ部分的に肉付けしながら書いていく。
概要
ホストOS
Apache, MySQL, Drupal で作られたシステムが稼働している。
ApacheのアクセスログをFluentdがゲストOSへ転送する。
ゲストOS
Fluentd, Elasticsearch, Kibana が稼働している。
ホストOSから受信したログをElasticsearchへ格納する。
また、格納された情報をKibanaで可視化する。
(可視化はホストOSのブラウザから行う)
環境
[ホストOS] OS X Yosemite 10.10.5El Capitan 10.11.3
[ゲストOS] CentOS 67
VirtualBox 4.3.14
Fluentd 2.3.0
Elasticsearch
Kibana 4.3.0
ホストOS
Fluentdをインストールする
ここをから、ダウンロードする。
私のゲストOSはOS Xのため、.dmgをダウンロードして、
"次へ"ボタン連打でインストール完了。
<source>
  type tail
  format apache
  path /Applications/drupal-7.41-1/apache2/logs/access_log
  tag apache.access
</source>

# ファイルへの出力も可
# <match apache.access>
#  type file
#  path /Applications/drupal-7.41-1/apache2/logs/access_log.pos
# </match>

<match apache.access>
  type forward
  <server>
    host 192.168.56.10
  </server>
</match>
起動と停止について。
# 起動
launchctl load /Library/LaunchDaemons/td-agent.plist
# 停止
launchctl unload /Library/LaunchDaemons/td-agent.plist
ゲストOS
Elasticsearchのインストール
インストールについては、こちらを参照。
# ======================== Elasticsearch Configuration =========================
#
# NOTE: Elasticsearch comes with reasonable defaults for most settings.
#       Before you set out to tweak and tune the configuration, make sure you
#       understand what are you trying to accomplish and the consequences.
#
# The primary way of configuring a node is via this file. This template lists
# the most important settings you may want to configure for a production cluster.
#
# Please see the documentation for further information on configuration options:
# <http://www.elastic.co/guide/en/elasticsearch/reference/current/setup-configuration.html>
#
# ---------------------------------- Cluster -----------------------------------
#
# Use a descriptive name for your cluster:
#
# cluster.name: my-application
#
# ------------------------------------ Node ------------------------------------
#
# Use a descriptive name for the node:
#
# node.name: node-1
#
# Add custom attributes to the node:
#
# node.rack: r1
#
# ----------------------------------- Paths ------------------------------------
#
# Path to directory where to store the data (separate multiple locations by comma):
#
# path.data: /data
#
# Path to log files:
#
path.logs: /var/log/elasticsearch/logs
#
# ----------------------------------- Memory -----------------------------------
#
# Lock the memory on startup:
#
# bootstrap.mlockall: true
#
# Make sure that the `ES_HEAP_SIZE` environment variable is set to about half the memory
# available on the system and that the owner of the process is allowed to use this limit.
#
# Elasticsearch performs poorly when the system is swapping the memory.
#
# ---------------------------------- Network -----------------------------------
#
# Set the bind address to a specific IP (IPv4 or IPv6):
#
network.host: localhost
# network.host: 192.168.56.10
#
# Set a custom port for HTTP:
#
# http.port: 9200
#
# For more information, see the documentation at:
# <http://www.elastic.co/guide/en/elasticsearch/reference/current/modules-network.html>
#
# ---------------------------------- Gateway -----------------------------------
#
# Block initial recovery after a full cluster restart until N nodes are started:
#
# gateway.recover_after_nodes: 3
#
# For more information, see the documentation at:
# <http://www.elastic.co/guide/en/elasticsearch/reference/current/modules-gateway.html>
#
# --------------------------------- Discovery ----------------------------------
#
# Elasticsearch nodes will find each other via unicast, by default.
#
# Pass an initial list of hosts to perform discovery when new node is started:
# The default list of hosts is ["127.0.0.1", "[::1]"]
#
# discovery.zen.ping.unicast.hosts: ["host1", "host2"]
#
# Prevent the "split brain" by configuring the majority of nodes (total number of nodes / 2 + 1):
#
# discovery.zen.minimum_master_nodes: 3
#
# For more information, see the documentation at:
# <http://www.elastic.co/guide/en/elasticsearch/reference/current/modules-discovery.html>
#
# ---------------------------------- Various -----------------------------------
#
# Disable starting multiple nodes on a single system:
#
# node.max_local_storage_nodes: 1
#
# Require explicit names when deleting indices:
#
# action.destructive_requires_name: true

# enable cross-origin resource sharing
http.cors.enabled: true
起動とステータス確認。
systemctl start elasticsearch
systemctl status elasticsearch
Fluentdのインストール
stable版を使う。
# yum -y install td-agent
<source>
  type forward
</source>

<match apache.access>
  type elasticsearch
  logstash_format true
  hosts localhost:9200
  type_name application-log
  buffer_type memory
  retry_limit 17
  retry_wait 1.0
  num_threads 1
  flush_interval 60
  retry_limit 17
尚、細かい設定方法は本家サイトを参照。
設定方法のレシピもあるため、とても参考になる。
Kibanaのインストール
インストールについては、こちらを参照。
起動とステータス確認。
systemctl start td-agent
systemctl status td-agent
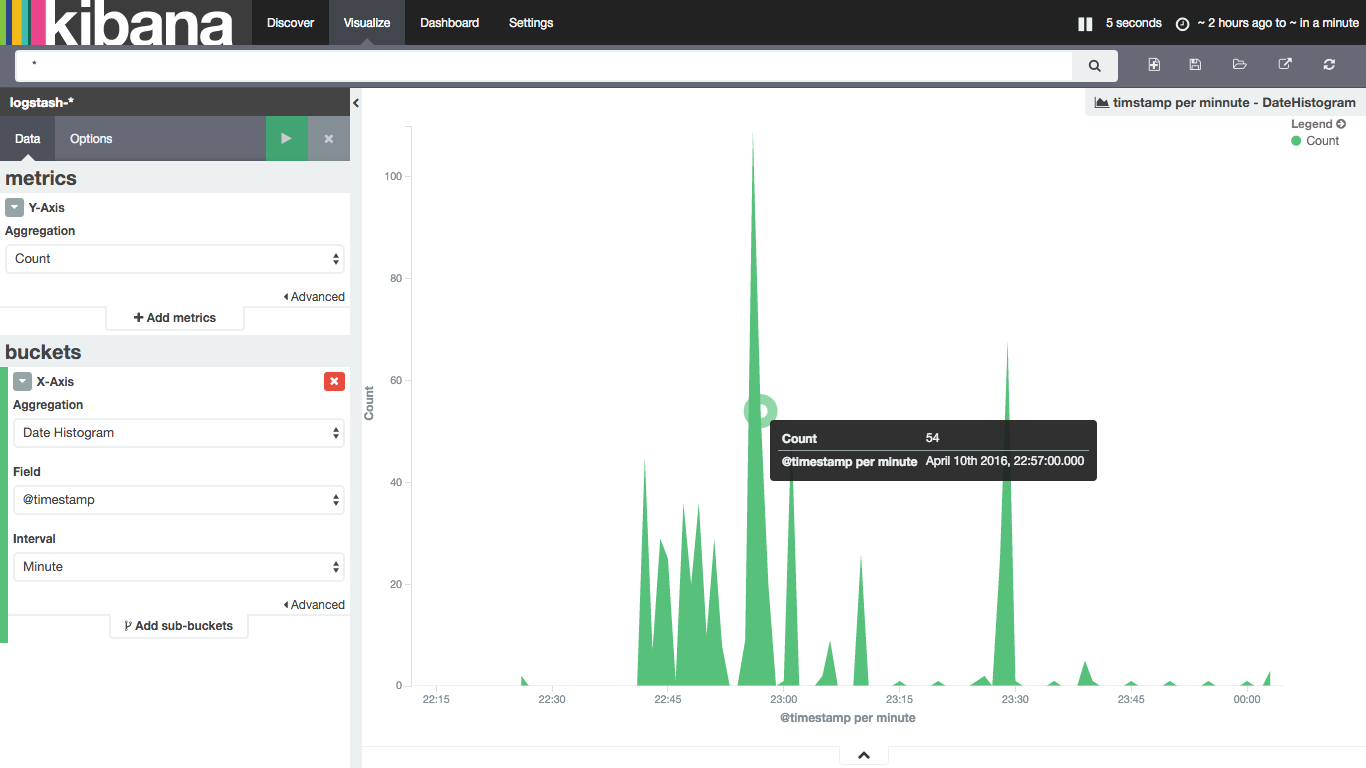
動作確認
1.冒頭で記載したシステムに対してアクセスする(http://localhost/drupal)
2.http://[ホストOS IP]:5601 にアクセスし、Kibanaの表示を確認する
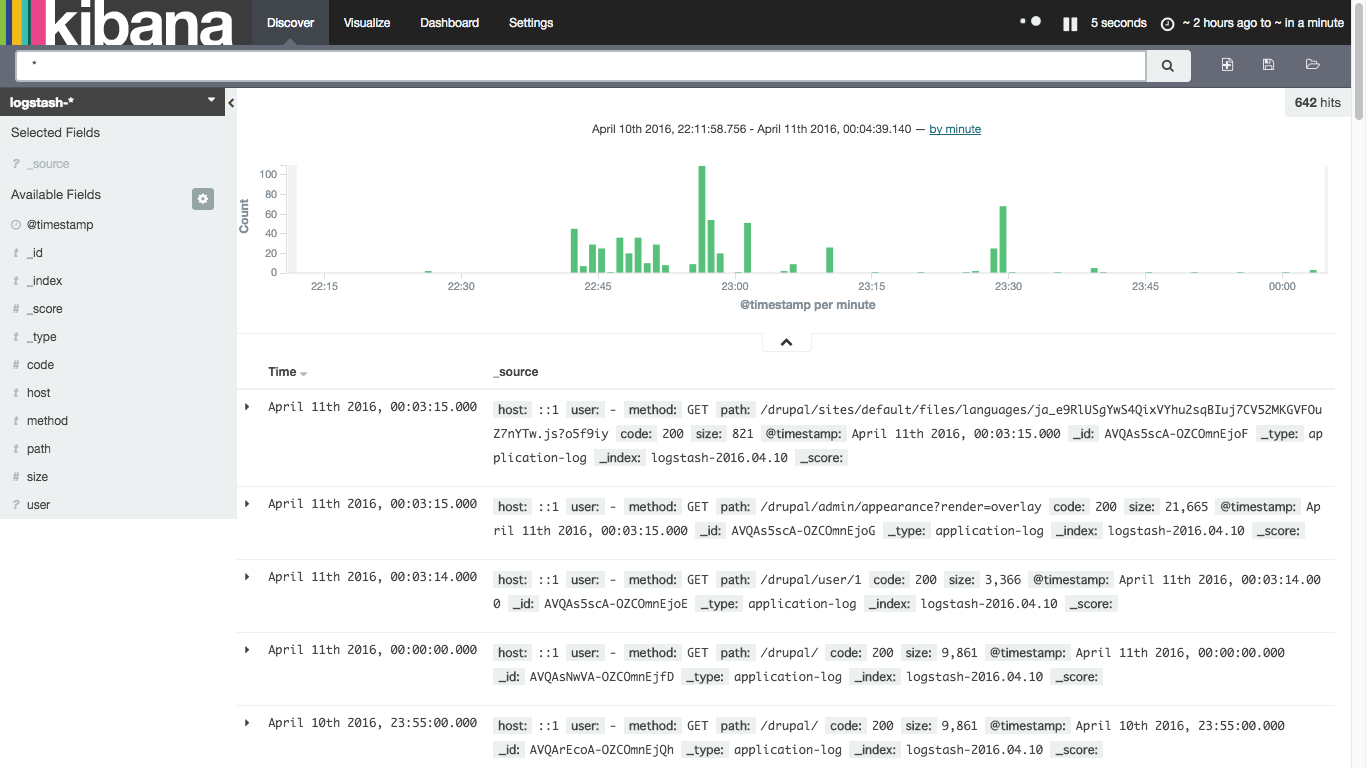
まずは、マニュアル等参照せず触ってみた。割りと直感的に操作できる。
おわりに
ログを転送し、ログを蓄積・可視化することができた。
今回作ったゲストOSをCactiで監視する方法をこちらに投稿したため、
合わせて読むとよさげ。